

Bitcoin is now trading close to $108K while buyers and sellers battle within a narrowing triangle shape
The 50MA is stopping upward movement while the 100MA is holding strong right below the current price zone
Traders are watching the triangle closely because a breakout or drop could start a large directional move next
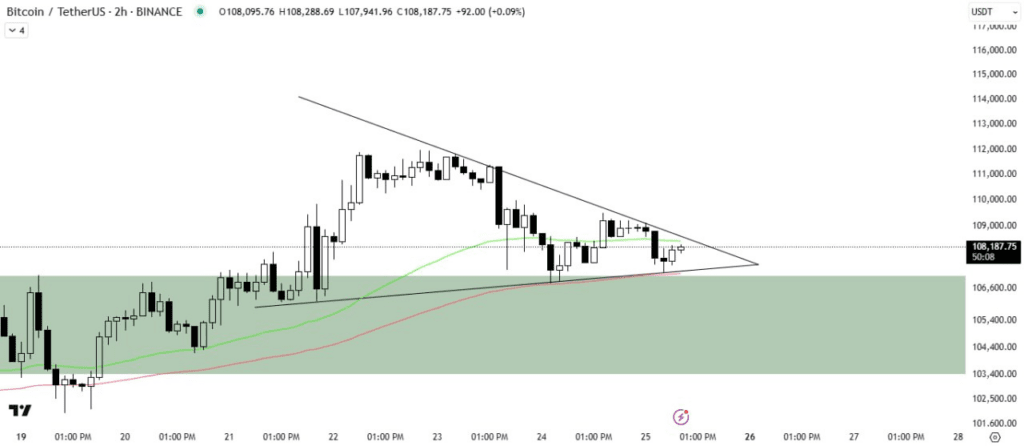
BTC is currently consolidating near $108,000 while trading inside a symmetrical triangle pattern on the 2-hour chart.
 Source: X
This technical formation appears as a price compression between two converging trendlines, indicating a potential breakout or breakdown move. According to a chart shared by The Crypto Express on May 25, BTC is trading above a key weekly support zone but faces resistance from the 50-day moving average (50MA).
At 8:57 AM UTC, BTC was priced at $108,187.75 on Binance, registering a marginal increase of +$92.00 or +0.09% from its previous session.
Pressure Builds at Support and Resistance Convergence
The symmetrical triangle on Bitcoin's chart shows price action compressing between lower highs and higher lows. This structure commonly signals an upcoming price move, though the direction remains uncertain until confirmed.
The green shaded zone beneath the pattern marks the weekly support level. BTC has bounced off this area multiple times, showing that buyers remain active around $106,000. However, the 50MA is acting as a ceiling and preventing bullish momentum from breaking through.
The presence of the 100MA, shown in red, adds to the technical picture. The 100MA is positioned beneath the price and is currently supporting Bitcoin’s lower boundary. Analysts are watching how these two moving averages—both essential trend indicators—interact with the pattern’s edges.
As the triangle narrows, the potential for an explosive move grows. Traders are closely watching for a candle close above or below the triangle lines.
Triangle Pattern Demands Market Attention
A breakout above the upper trendline could suggest renewed bullish activity toward the $110,000–$115,000 range. Conversely, a break below the triangle could lead BTC back toward $105,000 or even lower. Triangle patterns often lead to significant volatility once price escapes the compressed range.
The 50MA has repeatedly capped Bitcoin’s upward movement, showing short-term sellers are still active. Unless volume increases above this line, BTC may not build strong momentum upward. At the same time, the underlying strength shown by the 100MA signals buying pressure is present and holding price from falling further. If this continues, the pattern may resolve upward.
This technical setup has placed BTC at a crossroads where either bulls or bears could take control. Chart patterns like these are known for catalyzing trend changes. Can Bitcoin break out of the triangle or will resistance reject its move?
Market Observers Urged to Watch Closely
The Crypto Express advised traders to “keep a close eye” on the current setup. This suggests a directional move is approaching, and timing could be crucial.
In less than 24 hours, the post received over 8,820 views and engagement from traders noting the triangle's relevance. The high visibility underscores the market’s interest in Bitcoin's next direction. Price behavior over the next several sessions will likely confirm whether the triangle breaks upward or downward. Until then, Bitcoin remains coiled inside the tightening formation.

