Bitcoin (BTC) has strongly rebounded since April 7 and reached a historical high of $111,880 (ATH) on May 22.
Interestingly, BTC reached its historical high on Bitcoin Pizza Day, which marks the record of Bitcoin's first physical purchase of goods.
On May 22, 2010, programmer Laszlo Hanyecz bought two pizzas for 10,000 BTC, establishing Bitcoin's use in everyday shopping.
Is this the beginning of Bitcoin's parabolic rebound? Or will Bitcoin's price, like in 2021, form a double top and decline? Let's wait and see.
Bitcoin sets a historical high
Weekly timeframe analysis shows that Bitcoin's price reached a historical high weekly closing price last week.
Bitcoin closed above the level resistance area of $105,000, marking the last breakout before reaching a historical high.
This week, BTC has once again created a bullish K line and set a historical high of $111,880.
With the price reaching a historical high, the 1.61 external Fibonacci retracement level ($130,810) may become the next resistance level.
Despite the bullish price trend, technical indicators show some worrying signs.
The Relative Strength Index (RSI) has shown bearish divergence since March 2024 and is close to a trend line (orange).
Nevertheless, this divergence has led to a decline, and the indicator may soon break through the trend line.

Although the RSI movement shows a positive trend, the Moving Average Convergence Divergence (MACD) does not show bullish signals.
On the contrary, the histogram and signal line of the indicator show bearish divergence on the weekly timeframe.
Therefore, price analysis on the weekly timeframe is unclear and cannot confirm whether the breakout will lead to a significant price increase.
Vertical accumulation and breakout
The shorter six-hour timeframe provides a more positive price prediction for Bitcoin.
Since the first week of May, BTC has been consolidating within an ascending parallel channel.
Although channels usually contain corrective structures, Bitcoin's price broke through today and set a historical high.
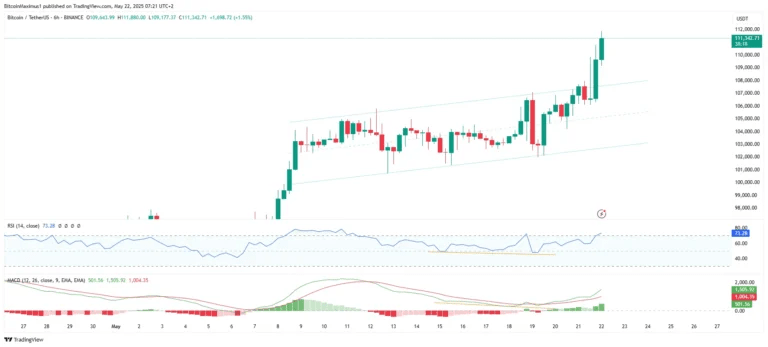
Breaking through the channel is a highly bullish sign as it indicates a pattern of vertical accumulation, where even corrections create higher lows.
Additionally, it occurred after the RSI and MACD generated hidden bullish divergence.
Therefore, short-term BTC price analysis is more bullish. It predicts that the correction has ended and new highs may be reached.
Why is Bitcoin rising?
The number of bullish positions in Bitcoin indicates that its price has just begun to show a parabolic upward trend.
Statistically, the BTC price has opened the third wave of the five-wave upward movement.
It is currently in the third sub-wave (black), which is usually the fastest part of the upward movement.
Although the second sub-wave is very shallow, it conforms to the vertical accumulation pattern of the previous section.

There is still a valid bearish wave count in play, indicating that BTC will soon reach its peak.
According to this statistic, the decline from January to April is the fourth wave in the five-wave upward movement.
If accurate, BTC is in its fifth wave of upward movement, which is also the last wave.
The issue is that there is no alternation between the second wave and the fourth wave. Both waves are deep, reaching at least the 0.618 Fibonacci retracement support level.
Moreover, if this is the fifth wave of a long-term impulse and also the last wave, then the fifth wave will extend rather than the third wave, but this did not happen.
Even if this data is accurate, BTC price will continue to rise in the short term. BTC is currently in the fifth sub-wave (black), with a minimum target price of $121,137.
Nevertheless, the count is valid and aligns with the bearish divergence in RSI and MACD.
Bitcoin historical new high
Since April 7, the BTC price has strongly rebounded, reaching a historical high today (May 22).
Despite the significant increase, there are still some worrying signs, such as bearish divergence on the weekly timeframe and the validity of the bearish count.
On the other hand, due to the lack of overhead resistance, the price movement may exhibit a parabolic shape. The fact that the breakout has continued to this day also indicates this possibility.
The trend of Bitcoin in the coming weeks is crucial and can help determine the trend for the rest of the year.
