I. Core Levels and Trend Analysis
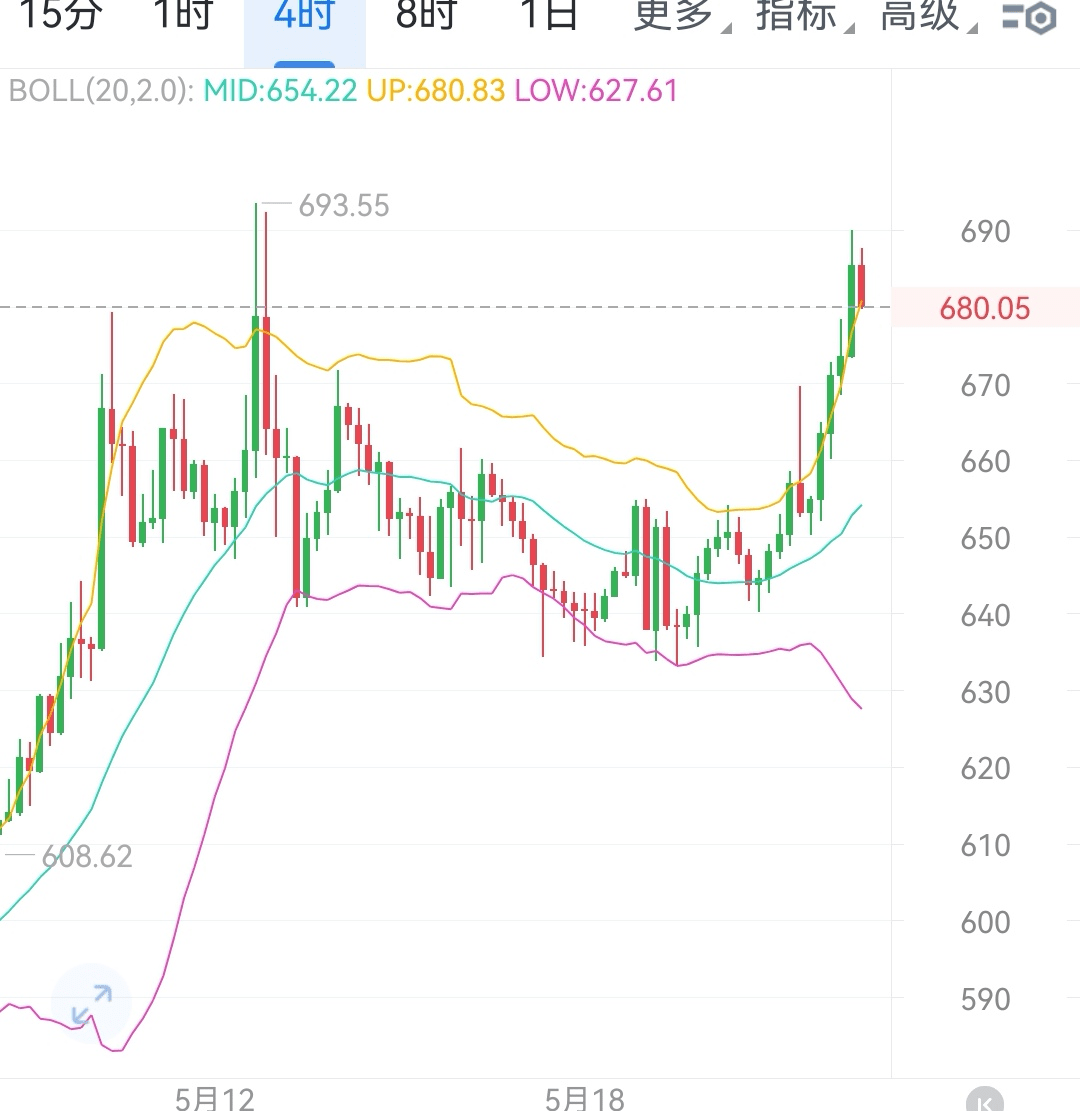
Last night, BNB's trend was strong, directly attacking the third resistance level without retracing, showcasing the bulls' vigorous upward momentum. Today, the price level of 676 has become the key watershed in the tug-of-war between bulls and bears, and its gain or loss will directly influence BNB's subsequent market direction. The performance of each cycle's candlestick at this level is worth paying close attention to.
Bullish Dominance Pattern
If BNB can consistently hold above 676 during the intraday retracement, it means the bulls firmly control the market's initiative across all cycles, and the upward trend is likely to be further consolidated and extended. In this scenario, the bulls may launch an attack towards higher targets, with key resistance levels to focus on being 689, 701, and 713. Among them, 689 serves as a significant resistance area for recent price increases, accumulating a large amount of profit-taking and trapped positions, becoming the first hurdle for the bulls to break through; 701 overlaps with crucial technical resistance levels, exerting significant pressure, requiring sufficient buying funds and positive market sentiment for a breakthrough; 713, as a round number, carries both psychological and technical dual pressure. Once effectively broken, the price of BNB may open up a new upward space.
Bearish Dominance Signal
Once BNB retraces and breaks below the key support level of 676, the 1-hour level will quickly initiate a corrective trend, and the bearish forces will dominate, facing obvious adjustment pressure in the short term. The support levels below 668 - 662 - 656 will sequentially become important lines of defense against bearish descent:
- 668 Primary Support: This position is formed by the technical support band of short-term moving averages, which can provide initial cushioning for the price, slowing down the bearish descent;
- 662 Psychological Defense Line: This level has acted as a key support in recent price fluctuations, bearing significant psychological expectations from market participants. If broken, it could trigger a panic selling wave;
- 656 Strong Support Level: Multiple cycle moving averages converge here, forming the core area for the tug-of-war between bulls and bears. If effectively lost, it could trigger a deeper downward trend, intensifying market pessimism.
II. Summary
The gain or loss at this key price level of 676 is the core point for analyzing BNB's trend today. If it can effectively stabilize above this position in the smaller time frame candlestick charts, the bulls are expected to challenge the resistance in the 689 - 713 range; if it cannot hold firm, then one must be wary of the risk of price retracing to the 668 - 656 area. The volatility is severe and filled with uncertainty. It is recommended that everyone closely monitor the changes in the smaller time frame candlestick patterns, strictly implement stop-loss and take-profit strategies, and reasonably control their positions!$BNB #BNB走势