
Institutional leverage and liquidation risks: Building momentum before BTC breaks through.

Total open interest in Bitcoin futures (in dollars). Source: CoinGlass
On May 20, 2025, the total size of Bitcoin futures open interest reached a historic peak of $72 billion, an increase of 8% from $66.6 billion a week earlier. This data not only sets a new record for the cryptocurrency derivatives market but also reveals the strong confidence that institutional investors have in BTC. In terms of open interest distribution, the Chicago Mercantile Exchange (CME) dominates with a contract volume of $16.9 billion, followed closely by Binance with $12 billion, demonstrating a collaborative effort between traditional finance and crypto-native platforms. This phenomenon echoes the market pattern when MicroStrategy made significant Bitcoin purchases in 2021, but the current depth and breadth of institutional participation are on a different scale—MicroStrategy alone holds 576,000 Bitcoins, with a market value exceeding $60 billion.

Bitcoin futures leverage heat map, unit: million dollars. Source: CoinGlass
The market's focus is concentrated on the $107,000 to $108,000 range, where there is a $1.2 billion short liquidation risk. CoinGlass data shows that this price band has accumulated the largest scale of leveraged short positions in crypto history, and once the price breaks through this threshold, it will trigger a chain reaction of forced liquidations. Notably, the structure of this liquidation heat map is highly similar to the market characteristics when Bitcoin surged to $69,000 in 2021, when the liquidity siphoning effect from short liquidations pushed prices up by 35% within two months. The current macroeconomic environment further enhances the possibility of a breakthrough: the 20-year U.S. Treasury yield continues to hover at high levels around 5%, reflecting market concerns about the sustainability of U.S. government debt, while the Federal Reserve may be forced to intervene in the Treasury market to maintain stability, further weakening the dollar's credit system and prompting funds to flow into inflation-resistant assets like Bitcoin.
The reserve game between gold and Bitcoin.
In the wave of global asset reallocation, Bitcoin is gradually encroaching on gold's status as a safe haven. As of May 2025, although the market capitalization of gold remains high at $22 trillion, its 24% increase this year shows signs of fatigue, while Bitcoin's $2.1 trillion market capitalization is now comparable to silver, becoming an indispensable component of institutional asset portfolios. More symbolically, some U.S. lawmakers have begun discussing proposals to convert 5% of gold reserves into Bitcoin—if this initiative is implemented, it could lead to an inflow of $10.5 billion, enough to push Bitcoin's price above $120,000. This evolution of reserve structure is an important signal of Bitcoin's recognition as 'digital gold' at the sovereign level.
From the market structure perspective, Bitcoin's institutionalization process has entered a new phase. The CME futures contract design, where each contract represents 5 Bitcoins (approximately $514,000), naturally filters out retail investors, making the changes in the platform's open interest more reflective of the true movements of professional institutions. Currently, CME's open interest is down 13% compared to the price highs in January, while Bitcoin's price has only retreated by 5.8%. This divergence suggests that institutions are quietly building positions during the price pullback, accumulating energy for the next round of increases. This strategy resonates with Michael Saylor's corporate Bitcoin strategy of 'cost-agnostic accumulation,' collectively building a value consensus against short-term volatility.
Ethereum's technical breakout and market test.
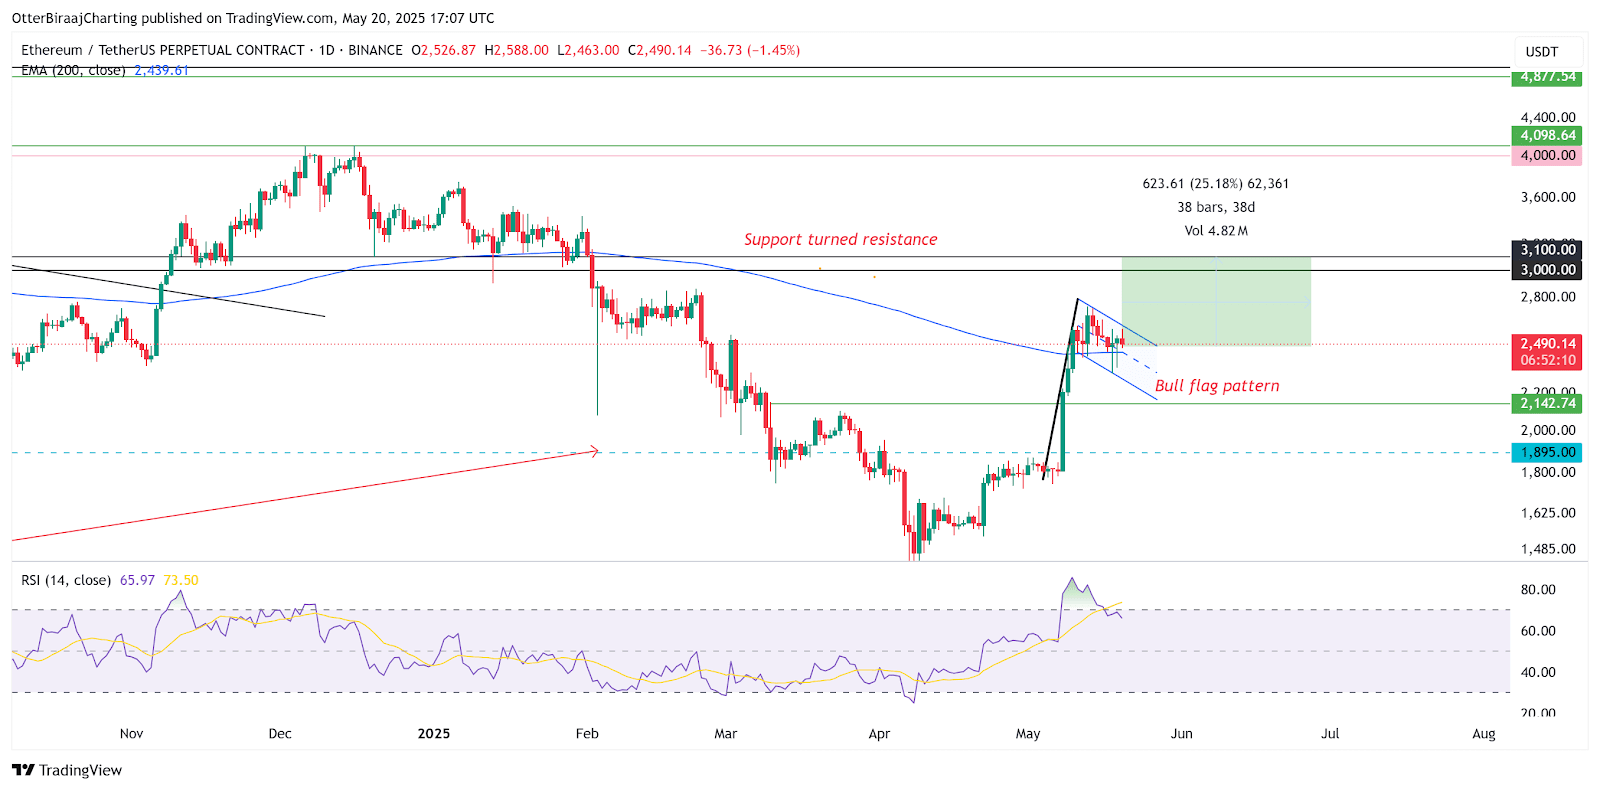
Ethereum daily chart. Source: TradingView
As Bitcoin hits historical highs, Ethereum's technical pattern is also showing signs of a breakout. On the daily chart, ETH has nearly completed a bullish flag pattern built in the $2,400 to $2,750 range, with a target price pointing towards the $3,000-$3,100 resistance zone.
If a successful breakthrough occurs, the theoretical increase calculated based on the height of the flagpole could reach $3,600, marking another significant market movement following the 93% surge in 2023. The resonance of technical indicators strengthens bullish expectations: the golden cross formed by the 50-day and 200-day moving averages appears on the 12-hour chart, and although its reliability is lower than that of the daily level, it still signals a strengthening of the medium-term trend.

Ethereum Gaussian channel analysis. Source: Cointelegraph/TradingView
Gaussian channel analysis provides Ethereum with a more profound historical reference. After ETH's price reached the middle line of this channel on May 20, the market closely watches whether it can replicate the legendary 1,820% increase from 2020—when a similar breakout triggered a comprehensive explosion of altcoins.

Ethereum weekly price analysis. Source: TradingView
However, trader XO's cautious stance is noteworthy: there is significant resistance below $2,800, and if it cannot effectively break through in the coming weeks, ETH may fall into a range-bound oscillation between $2,150 and $2,750. This divergence is reflected in the Fibonacci retracement levels, where repeated tests in the 0.5 to 0.618 range expose the hesitation of bulls and suggest that the market needs stronger catalysts to break the balance.
The tug-of-war between macro variables and market sentiment.
The fundamental force driving the cryptocurrency market always comes from the fractures within the traditional financial system. The U.S. government debt has exceeded $36.2 trillion, and the differences between the Democratic and Republican parties on fiscal policy are hard to bridge. This political economy dilemma is transmitting to the crypto market through the U.S. Treasury yield curve. When the 10-year U.S. Treasury yield rose to a 14-month high of 4.79%, the valuation models for risk assets faced severe challenges, yet Bitcoin displayed unique resilience—its 42% annual increase has outperformed U.S. stocks, indicating a structural separation of digital assets from traditional markets.
The changes in the regulatory environment are also worth noting. Grayscale Research points out that the differing attitudes of U.S. presidential candidates towards cryptocurrencies may influence the medium to long-term market direction. The Trump team's policy experimentation with allowing Bitcoin payments contrasts with the Biden administration's focus on compliance regulation, injecting new uncertainty into the market through this political game. However, a deeper trend is already clear: regardless of who occupies the White House, the reality of the U.S. government debt-to-GDP ratio exceeding 150% is difficult to reverse, and the ongoing erosion of fiat currency credit will ultimately push more institutional investors towards Bitcoin.

