I. Core judgment of short-term trend
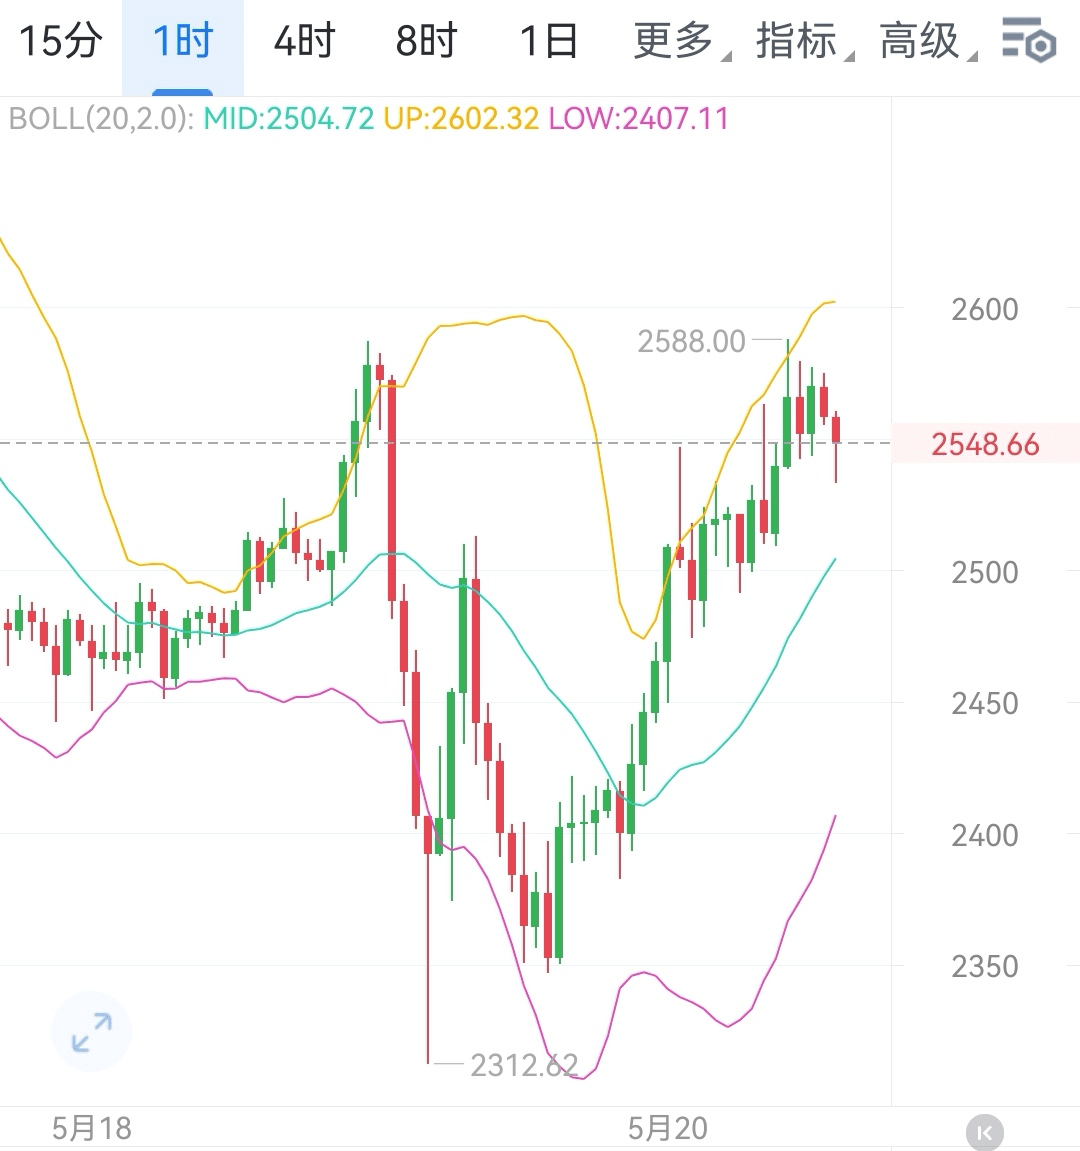
The key turning point of the Ethereum intraday market focuses on the price level of 2540, and the closing situation of the 1-hour candlestick here will become the core basis for judging whether this round of pullback or upward continuation occurs.
Bullish continuation signal
If the 1-hour candlestick can effectively hold above 2540, and the subsequent two consecutive periods close above this price, it indicates that bullish strength is solid, the pullback has ended, and a new round of upward trend is expected to start, with the price likely to gradually test the resistance level.
Bearish initiation signal
Conversely, if the price of Ethereum consistently fails to hold above 2540 at the 1-hour level, it indicates insufficient upward momentum, and bears still hold market dominance. The trend is likely to continue the pullback, entering a new round of downward testing.
II. Distribution of key levels and strategy reference
(I) Upward resistance level
1. First resistance level: 2585
This position is at the upper edge of the recent price fluctuation range, where a large amount of profit-taking and previously trapped positions are gathered. When the price of Ethereum rises to this point, dual selling pressure will directly hinder the short-term rise, becoming the primary obstacle for bulls to break upwards.
2. Mid-term resistance level: 2618
Located in the overlapping area of key moving average suppression and significant Fibonacci resistance, it poses strong resistance to price increases. To achieve an effective breakthrough, not only sufficient buying funds need to flow in, but also the overall market's bullish sentiment must actively cooperate.
3. Trend breakout level: 2650
Once the price of Ethereum successfully stabilizes at this point, it will confirm its entry into a brand new upward channel, and the subsequent upward space is expected to be significantly opened, signaling the beginning of a new round of strong upward momentum.
(II) Downward support level
If the 1-hour level cannot hold above 2540, it is expected to trigger a new round of retracement, with subsequent support levels as follows:
1. Primary support level: 2493
The dense convergence of short-term moving averages forms support, and is also an important psychological defense line that has been tested multiple times in the past. It can buffer the impact of bearish downward pressure to a certain extent and slow down the price decline.
2. Secondary support level: 2450
As a strong support level formed by the previous price low, if this level is breached, market panic may spread rapidly, triggering larger-scale sell-offs and leading to accelerated price declines, further testing the support below.
3. Strong support level: 2390
This point is located in the support area of multiple-cycle moving averages and is a key strategic position fiercely contested by both bulls and bears. Its gains and losses directly affect the subsequent medium to long-term trend direction. Once it breaks, it may trigger a deep pullback, changing the overall market pattern.
III. Summary
The battle between bulls and bears at the key price level of 2540 is the core of Ethereum's intraday trend. If the price can effectively stabilize above this level, bulls are likely to challenge the resistance in the range of 2585 - 2650; if it cannot stabilize, caution is needed for the risk of the price retracing to the 2493 - 2390 area, with volatility being severe and full of uncertainty. It is recommended to closely monitor the changes in the 1-hour candlestick patterns, strictly implement stop-loss and take-profit strategies, and manage positions reasonably.$ETH #ETH走势分析