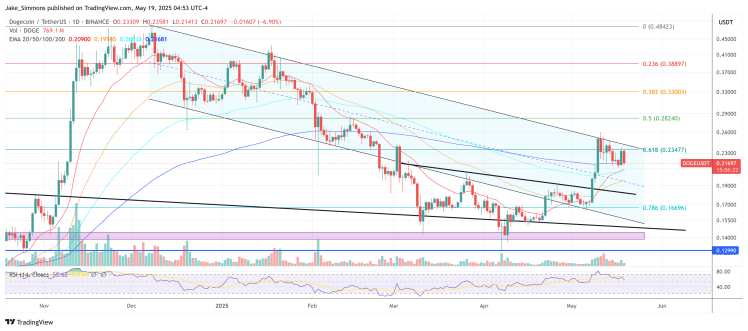
The price of Dogecoin may be at a critical moment for a breakout, but momentum needs to sustain.
On the four-hour chart shared by analyst Josh Olszewicz, since reaching a local high of $0.25941 on May 13, the price has been sliding within a clear descending wedge pattern. The upper and lower boundaries of this wedge continue to decline, forming successive peaks and troughs; the lower trendline currently provides support around $0.219, while the upper trendline limits the market around $0.219.

In this compression curve, Olszewicz overlaid an Ichimoku system set to short cycle parameters (20/60/120/30). The latest completed candlestick chart (marked on May 17 at 08:00 UTC) oscillated between $0.21187 and $0.21676 before ultimately closing at $0.21532. This closing price is just inside the cloud, a position that usually indicates equilibrium. Internally, Tenkan-sen is at $0.21427, Kijun-sen is at $0.22524, Senkou Span A is at $0.22102, and Senkou Span B is at $0.21184, forming an unusually tight short-term reference level band.
The area between the wedge bottom and Span B forms a high-confluence support zone around $0.212-$0.214, which has produced two intraday bounces. Conversely, the baseline and descending wedge resistance intersect around $0.225, forming a similarly clear upper ceiling. As long as the price remains trapped between these two lines, momentum traders may see low-volatility pullbacks; the first decisive breakout—especially a four-hour close above the upper line—would meet all textbook standards for a bullish descending wedge pattern and mechanically predict a price recovery to the high of May 13.
Dogecoin still looks strong.
The weekly chart of Guangdong cats reflects a larger cycle. In his chart, Dogecoin has just completed its first weekly close above the bull market support band since early February—essentially a 20-week simple moving average, wrapped by a 2 sigma envelope. The current price range of this support band is $0.21617 (lower bound) to $0.22378 (upper bound); last week's candlestick chart closed at $0.22387, slightly above the support line, turning the entire spring resistance level into a temporary support level.

At the time of this breakout, the upper Bollinger Band is still retracing from a high of around $0.35 in February, indicating that volatility within the weekly timeframe has only just begun to contract after months of bear market liquidation. Therefore, the midpoint of the Bollinger Band structure coincides with the 20-week simple moving average (SMA) and the top of the bull market support band, making it the most important pivot for the coming week.
If it closes above $0.22378 for the second consecutive week, it will confirm that the first round of gains was not a one-time spike and may encourage trend followers to set mid-term upward expectations at the midpoint of $0.30, which is the current curvature position of the upper band.
Overall, these two timeframes outline a clear roadmap. Short-term traders will look for a breakout from the descending wedge; if it breaks above $0.219, attention will immediately shift to the previous supply levels of $0.24-$0.26, while failure to hold $0.205 could accelerate declines towards the pivot of $0.185 from April.
As of the time of writing, DOGE is trading at $0.217.