Bitcoin price has strengthened again, successfully breaking through the important level of $105,500, and is currently in a consolidation phase, still expected to continue to rise above $108,000 in the short term. Since the price stabilized around $102,500, BTC has initiated a new upward trend. Bullish forces are gradually strengthening, pushing the price above the resistance level of $103,500, and once even rising above $104,200.
As buying pressure continues to strengthen, Bitcoin's price further broke through $105,000, creating a phase high near $107,042 in the short term. The market is currently undergoing a certain degree of technical pullback, with Bitcoin's price briefly falling below the short-term support of $105,500, and once dipping below the 50% Fibonacci retracement level of the increase from the low of $103,346 to the high of $107,042.
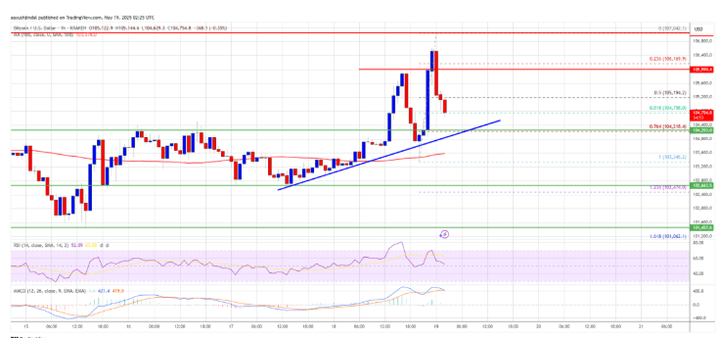
Despite the pullback, the overall structure remains bullish. Currently, Bitcoin's price is steadily trading above $104,000, while a key ascending trend line is being constructed on the hourly chart of BTC/USD, with the support level of this trend line located around $104,200. Meanwhile, BTC price remains above $104,500 and the 100-hour simple moving average, indicating that the market structure is still favorable to bulls.
From an upward perspective, the first direct resistance level is located in the $105,500 area, followed by the key resistance at $106,000. If buying pressure continues to strengthen and successfully breaks through the $106,000 mark, the next target will point to $107,500. Once the price stabilizes and closes at this level, Bitcoin may further test the technical resistance of $108,800, and if bullish sentiment continues, there may even be a chance to challenge the $110,000 mark, refreshing the phase high.
The risk of a pullback still exists; pay attention to the performance of key support levels.
Although the overall trend is currently strong, if Bitcoin fails to break through the short-term resistance of $105,500, it may trigger a new round of pullback. The initial support level below is at $104,500, followed closely by the trend line support around $104,200. If this area is lost, the market may further test the support region of $103,500.
With expectations of a larger correction, the price may retest the key support at $102,200. If bearish momentum continues to strengthen, it may even fall towards the important defense line of $100,500; breaking below this level would open up further downside space for Bitcoin.
Technical Indicator Analysis
MACD Indicator: The hourly MACD is still in the bullish zone, but momentum is gradually weakening, so caution is needed regarding short-term reversal risks.
RSI Indicator: The hourly RSI of BTC/USD remains above 50, reflecting that market sentiment is still inclined towards optimism. Key support levels: $104,200, $103,500.
Key resistance levels: $105,500, $106,000, with extended targets of $107,500 and $108,800.
Overall, BTC price is in a critical decision range in the short term. If bulls can hold the support and break through the $106,000 mark, there is a high probability of continuing to push the market higher; conversely, if bears effectively suppress, caution should be taken against the downside risk brought by a pullback.