Earlier this week, Bitcoin failed to hold above $105,000, and the current price has retreated to around $103,400, fluctuating in consolidation. Despite a strong rebound from $100,762, the recent candlestick structure shows that the Bollinger Bands are clearly narrowing, and the RSI is moving sideways, reflecting a weakening market momentum with a cautious trend. After several weeks of upward movement, Bitcoin reached a high of $105,787, then faced resistance in a key Fibonacci level area, leading to a continued price correction and entering a consolidation pattern.
What is the price of Bitcoin?

From a macro perspective, Bitcoin's daily trend remains bullish, with the current price stabilizing above the breakout point of the downward trend line from March to April, maintaining structural strength. However, the latest weekly close has formed a long upper shadow below the 0.786 Fibonacci retracement level ($104,929), indicating significant selling pressure in that area. The vicinity of $105,000 remains a key resistance zone, and if a breakout cannot occur, this level will continue to suppress upward movement.
In the 4-hour chart, Bitcoin's price is still operating within a converging triangle structure, with the highs consistently moving downwards and the lows slightly rising, indicating that the market is in a stalemate. The current structure has stabilized above the 50-day Exponential Moving Average (EMA), which is at $102,533, a key dynamic support that the bulls must hold. If the price falls below this level and closes underneath, it could trigger a larger correction, targeting the lower support areas of $101,500 or even $100,800.
Indicators suggest the possibility of a breakout or a collapse.

Shorter time frames show conflicting momentum. On the 30-minute chart, the RSI is at a neutral level of 48.86, while the MACD has broken above the signal line, showing early signs of bullish intent, although the histogram remains moderate. Meanwhile, the Ichimoku chart reflects consolidation, with the price hovering within the cloud, and the conversion line and baseline flat—this is a typical pause stage before a trend resumes.

On the 4-hour chart, the Bollinger Bands have clearly narrowed to between $102,321 and $104,574, indicating that the market is about to experience directional volatility. Meanwhile, the 20-day and 50-day moving averages converge around $103,500, forming a critical compression zone that adds extra pressure to the price movement. If trading volume increases and there is an effective breakout above $104,300, it could trigger a strong upward movement, targeting $105,700 and even the weekly resistance level of $109,396.
Why has the price of Bitcoin dropped today?

The answer lies in the weakening buying pressure at major resistance levels and repeated rejections around $104,500 during intraday trading. Despite multiple tests, the price has not been able to close above this level, indicating that sellers are in control. Additionally, the upper Bollinger Band on the 4-hour chart has limited the price rise for the third consecutive trading day. Without a significant breakout, buyers may continue to wait and see, especially since the RSI indicator has failed to recover above the bullish area of 50.
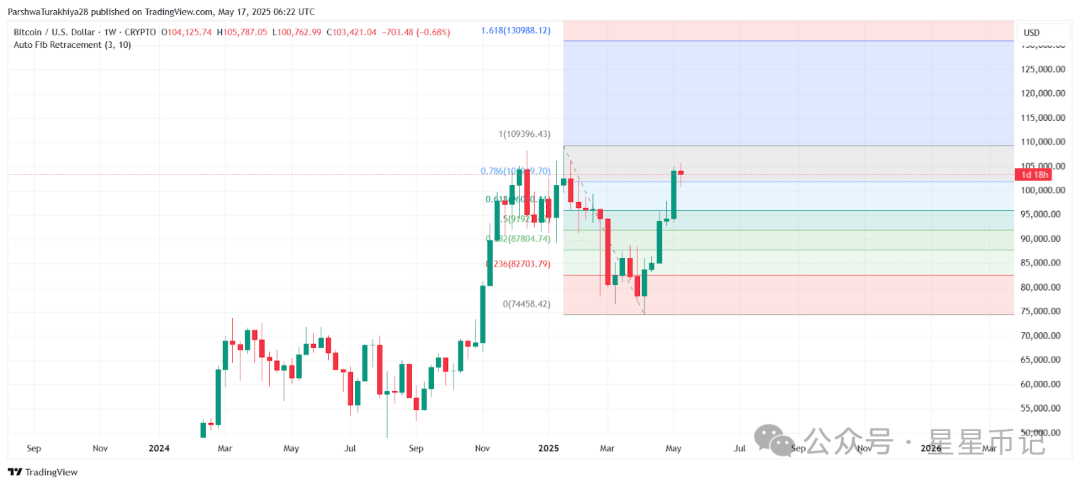
Furthermore, from the weekly chart perspective, Bitcoin has reached the 0.786 Fibonacci retracement level, which is typically seen as a potential sign of weakness after a parabolic move. This position corresponds with the continuously rising low structure on the daily chart—if the current key support area cannot be maintained, it may indicate a greater level of correction risk for Bitcoin.
Short-term outlook for May 18

On May 18, Bitcoin is expected to fluctuate in consolidation between the support of $103,000 and the resistance of $104,500, unless significant trading volume drives a breakout.
If the bulls can leverage the resonance signals of the RSI and MACD to achieve an effective closing breakthrough above $104,300 in the 4-hour timeframe, the short-term target could look towards the $105,700 or even $107,000 area. Conversely, if the support at $102,800 fails, Bitcoin may face the risk of another downward test, probing the key areas of $101,500 and $100,800 below.
Prior to this, the trend remained cautiously bullish, with strong support below, but clear breakout signals are needed to continue moving upward.
Bitcoin price prediction table

