BTC
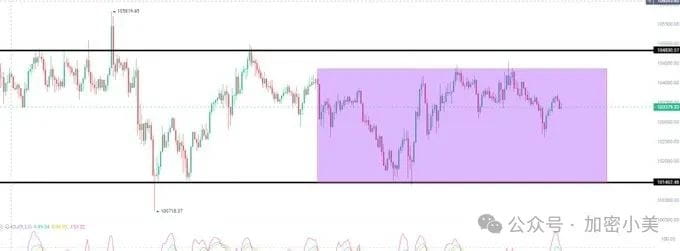
Bitcoin reached a high of 104,500 yesterday, followed by a drop to retest, with short-term sustained high-level fluctuations. It has regained the support level of 101,500 three times. Historical trends show that after each rise, Bitcoin usually enters a consolidation period of about 2 weeks, providing good opportunities for swing trading. The current key resistance level is at 104,500, while the support below remains at 101,500.
Bitcoin's demand rebound formed at the bottom of the range, creating a small double bottom structure, with momentum still strong. As long as it hasn't broken below the previous range bottom, it remains an ideal position for bullish arrangements. If it tests the range top for the third time and consolidates strongly, the probability of a breakout is high. However, if the market falls below 100,000 again, it may not hold. But based on the current trend, there seems to be a higher likelihood of an upward breakout.
ETH
Recently, ETH's price entered an adjustment phase after a rapid increase. Although the moving average system shows a bullish arrangement, the short-term moving averages are flattening or slightly declining, indicating weakened upward momentum. The high levels have formed a stagnation pattern, and potential reversal patterns like head and shoulders or descending triangles need close observation.
In the short term, prices show downward pressure, especially as the EMA indicator indicates a possibility of further testing support levels. Combined with the BOLL indicator's oscillating downward trend and the short-term MA indicator's pullback, the market may continue to face adjustments.
Technical Analysis
K-line patterns: Head and Shoulders, Descending Triangle, Doji. Indicates possible trend reversal or decline.
EMA: EMA12 and EMA26 show a downward trend, indicating bearish momentum in the short term, with prices near the EMA60 resistance level.
BOLL: The upper band is slowly moving down, consistent with the lower band, indicating reduced volatility, with prices approaching or breaking through the middle band, showing a downward oscillation trend.
MA: The short-term moving averages (MA5 and MA15) are converging with the medium-term moving average (MA30), indicating increased short-term selling pressure. Being above the long-term moving averages (MA60 and MA90) suggests a short-term adjustment within an upward trend.
Pattern: The trend line triangle consolidation area has been broken, and the current pattern appears bearish.
Signal: The 4-hour signal is bullish, with a support level around 2380.
Support: 2425, 2380
Resistance: 2520

Today's hot coins
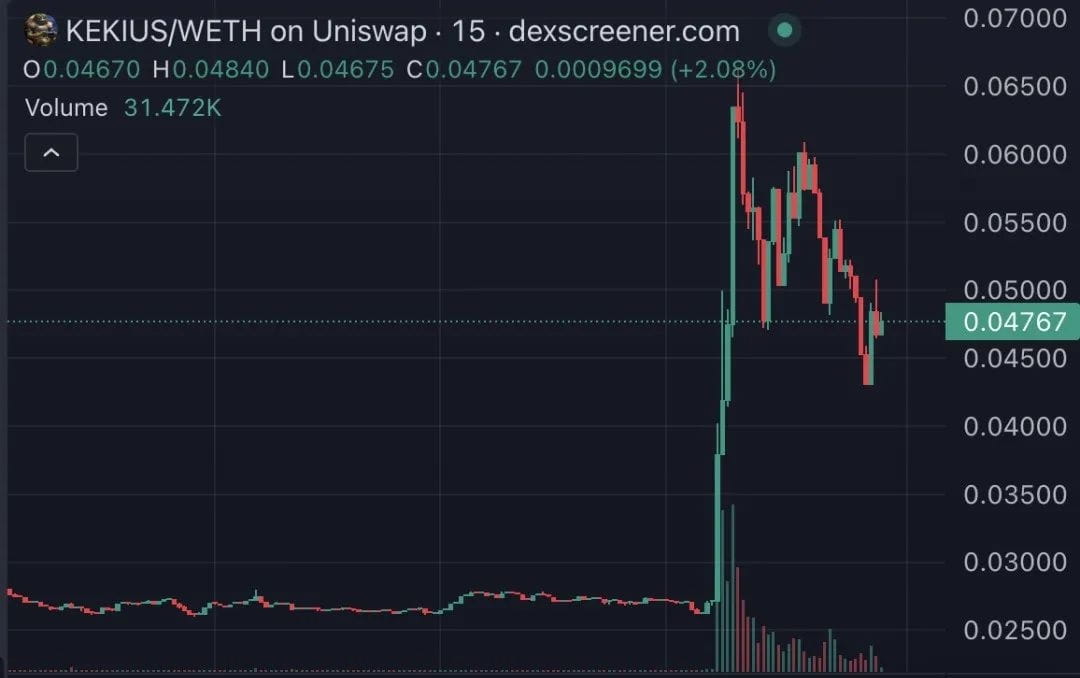
Early this morning, Musk changed his nickname to 'Kekius Maximus', which immediately drove up another meme coin $KEKIUS, while the original star coin gork plummeted.

$KEKIUS skyrocketed past $66 million
According to Dexscreener data, the eponymous meme coin $KEKIUS deployed on Ethereum (address: 0x26e550ac11b26f78a04489d5f20f24e3559f7dd9) surged from $0.0027 to $0.06638 in less than 2 hours, an increase of 146%, with a market cap exceeding $66.38 million.
Before the deadline, there was a slight pullback, with the price currently at $0.0478, up 79.69% in the last 24 hours.
'Air coin' B skyrocketed to $20 million, can it still be bought at the bottom?
Token B rapidly rose to a market cap of $20 million on the BNB Chain, without a white paper, audit, or clear team, relying on AI narrative and the support of the $USD1 liquidity pool.

The market cap of $B 'rushed to 20 million', relying on the operational strategy of BUILDonBsc_AI, which focuses on leveraging, marketing, and incentivizing efforts. The underlying project BUILDonBsc_AI aims to combine AI and DeFi, but the lack of transparency raises risk concerns.

Token B and BUILON's market value surged, highlighting the AI boom in the crypto market of 2025. Behind its 'three no's', there may be a grand plan for AI-DeFi, or it could just be a bubble. What has been missed is not just the price surge, but also the pulse of the market.
The future of Token B is uncertain; technological realization could turn it into a star, while speculation could lead to downfall. Investors need to see beyond appearances and recognize inherent risks. On the BNB Chain, the frenzy hides both opportunities and traps, with success depending on clarity amidst enthusiasm.
SUI
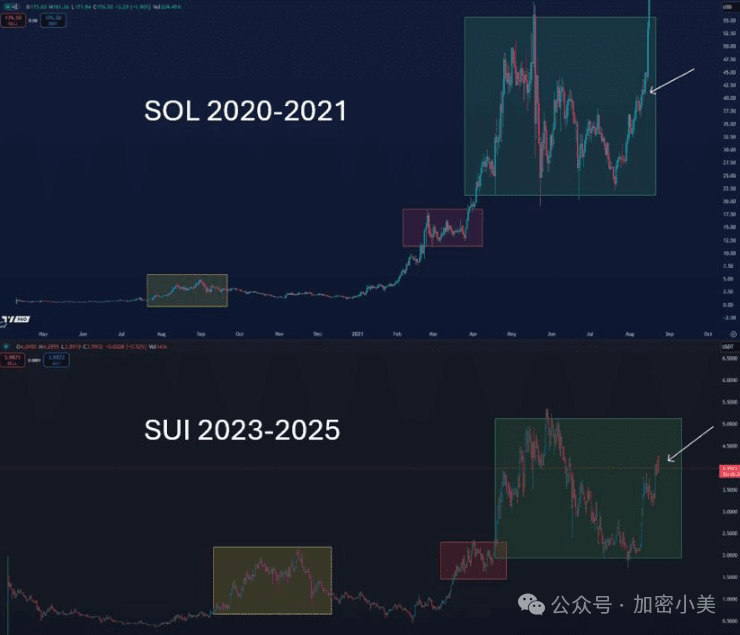
The current trend of SUI is almost identical to the trend before SOL's surge in 2021. SUI has become the undisputed leader among new public chains in this bull market cycle. If SUI replicates SOL's 2021 trend, then everything is just beginning. Once you experience Sui, you will know how smooth it is; SOL chain transactions often fail, but I haven't encountered that on Sui—it's very smooth. Once used, one can't go back.
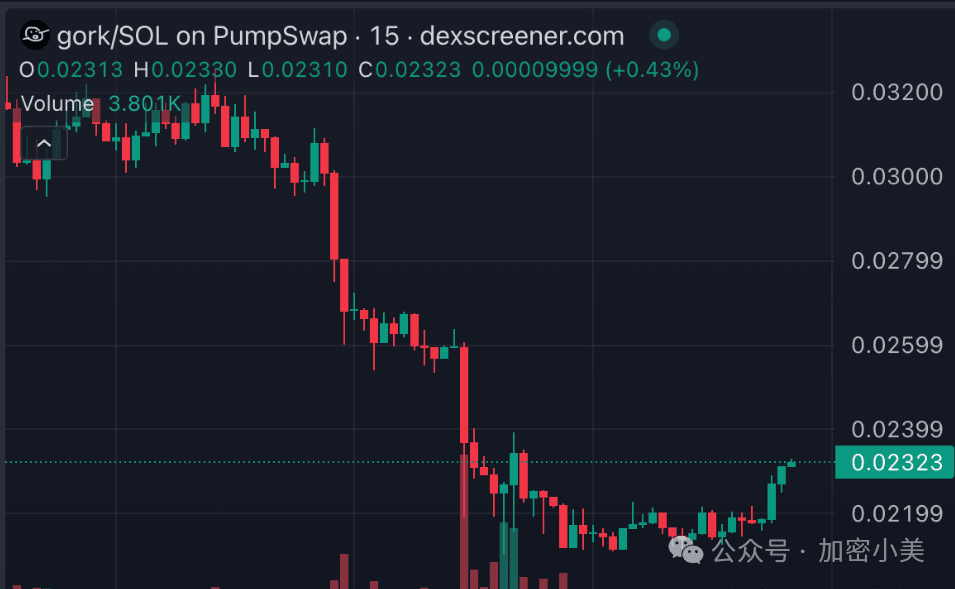
gork has cooled off and is now adjusting.
In contrast, the previously popular meme coin $gork once dipped to $0.02116, dropping 26.46% in nearly 24 hours, as funds quickly shifted to new favorites.