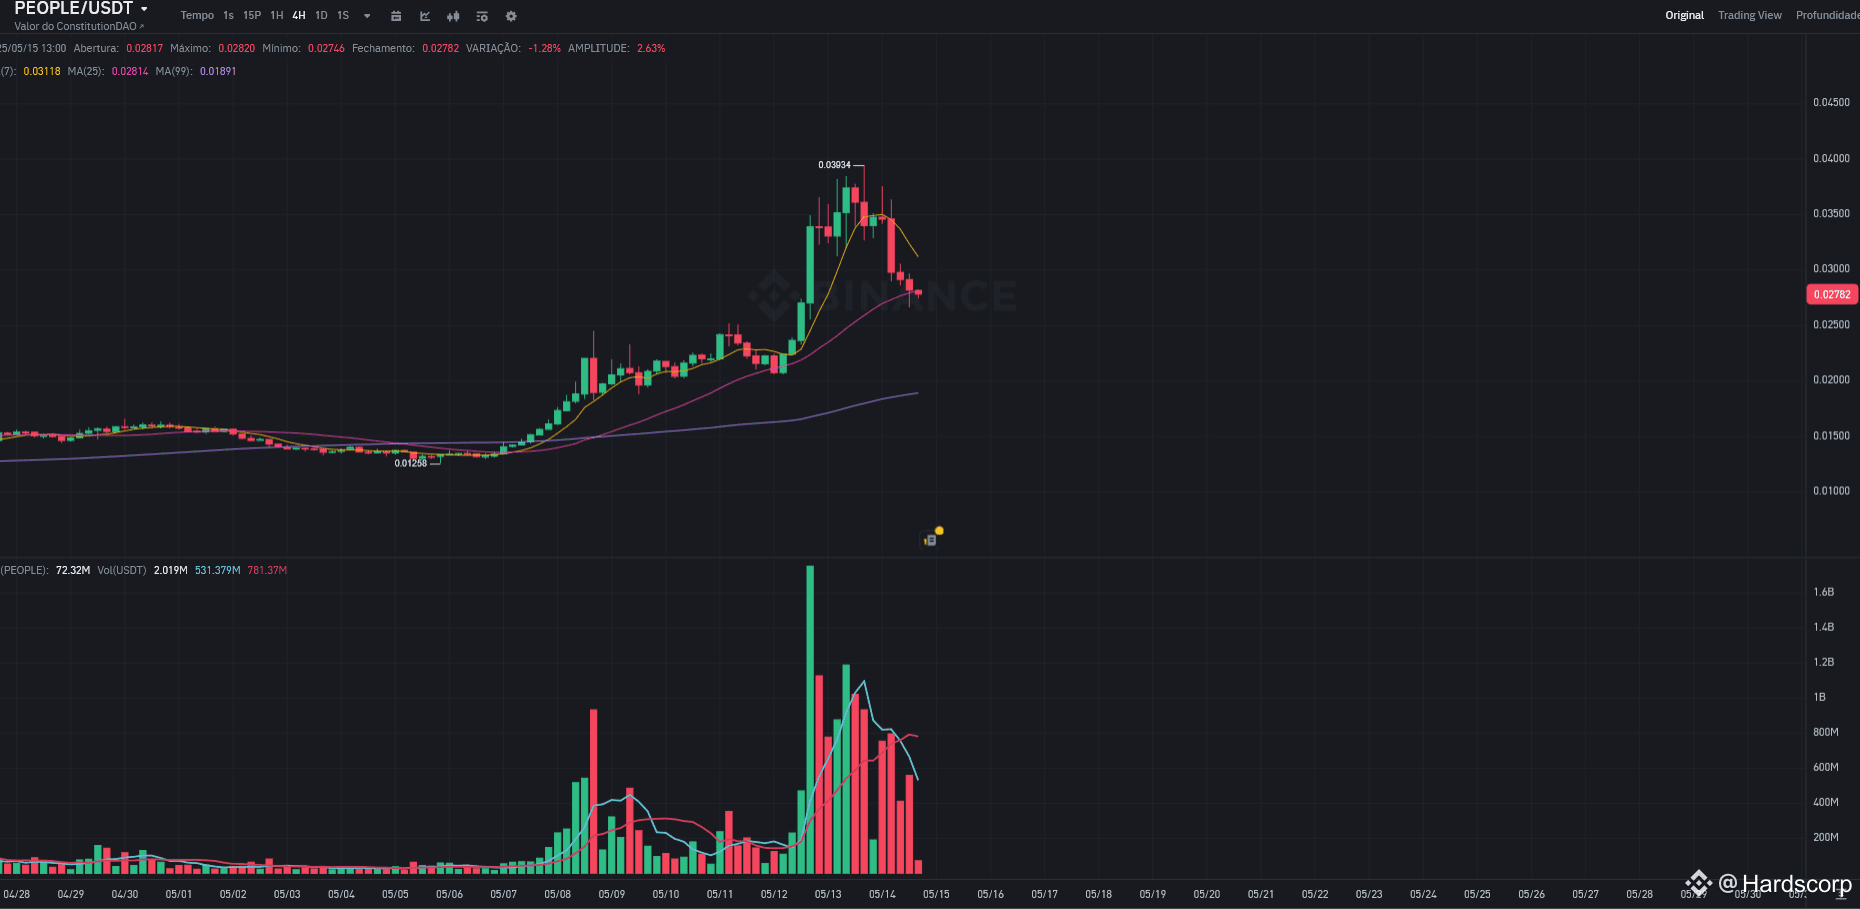
Recent Price Action: The chart clearly shows a significant pump in price starting around early to mid-May. PEOPLE experienced a strong upward move, peaking around the 0.045 USDT level. This was followed by a sharp and rapid decline, bringing the price back down considerably from its highs.
Moving Averages: There are two moving averages plotted on the price chart (a faster purple line and a slower darker purple/blue line). During the pump, the price was trading well above both moving averages, indicating strong bullish momentum. However, the recent sharp decline has pushed the price decisively below both moving averages. Furthermore, the faster purple moving average has crossed below the slower darker moving average. This is typically considered a bearish signal (often referred to as a 'death cross' if using longer-term averages) and suggests that the short-to-medium term trend has shifted downwards.
Volume: The volume panel tells a crucial part of the story. We see massive spikes in trading volume coinciding with the major price pump and the subsequent sharp dump. This indicates significant market activity and strong participation during this volatile period, much higher than in the preceding period of stable price. High volume on the down move after the peak confirms strong selling pressure.
Current State: As of the end of the chart's data, the price has fallen significantly from the peak and is trading below both key moving averages. The volume has decreased from the peak levels but is still relatively higher than before the pump.
Analysis and Potential Outlook:
The chart shows a classic pump-and-dump pattern characterized by a rapid price increase on high volume, followed by a swift decline also accompanied by high volume.
The price breaking below both moving averages and the faster moving average crossing below the slower one are strong bearish signals according to technical analysis principles. This suggests that the upward momentum has completely reversed, and the trend is now bearish in the short to medium term.
The high selling volume during the decline reinforces the strength of the bearish move.
Without further context or additional support levels marked, the immediate outlook based purely on this chart suggests potential for further downside or a period of consolidation as the market digests the rapid price swing.
Areas where the price consolidated before the pump might act as potential support levels on the way down. Conversely, the moving averages, which were previously support, could now act as resistance if the price attempts to recover.
In summary, the chart for PEOPLE/USDT shows a recent period of high volatility driven by significant volume, culminating in a sharp pump and subsequent dump. Key technical indicators like moving averages and volume currently suggest a bearish trend in the short term following this volatile event.