

Ethereum moved up from $1,365 and is now building support above $2,600 in a new wave formation.
The chart outlines two paths with both showing possible movement above $2,878 toward $4,637 next.
Volume strength and key support levels show that the trend may continue if no strong pullback follows.
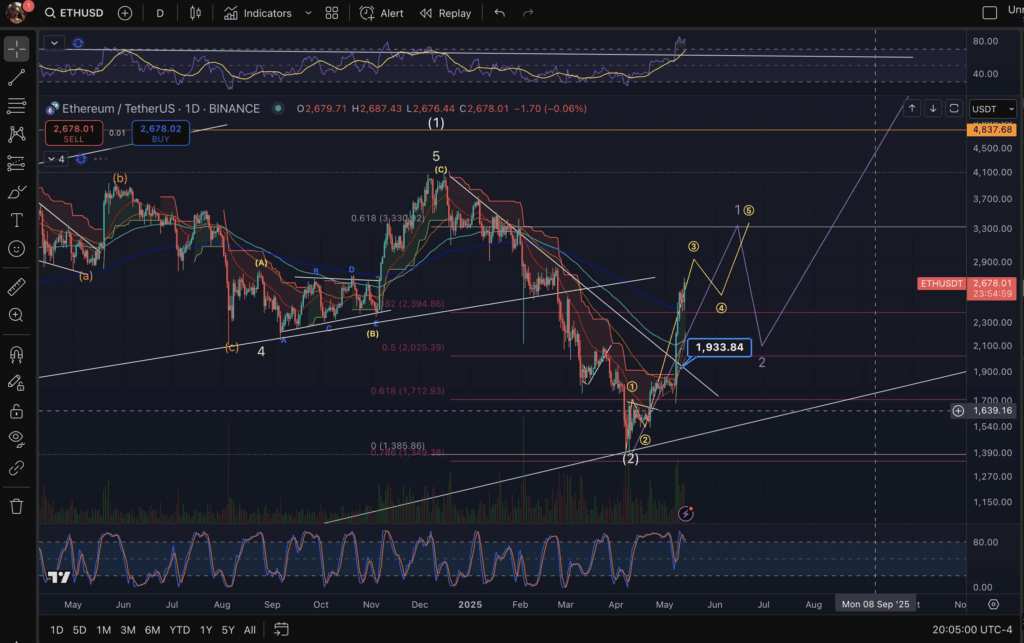
Ethereum is currently trading around $2,678 and has entered a projected wave formation that may push it above $4,600. The chart shared by @Michael_EWpro on May 14, 2025, outlines a detailed Elliott Wave analysis, suggesting a potential move toward higher highs. The wave structure implies a developing bullish leg that could signal wave 3 acceleration.
 Source: X
Based on the visual data, Ethereum has recently recovered from a local bottom near $1,365 and broken above $1,933 support. The next wave projection now places key milestones between $2,800 and $2,878, which the market is closely approaching. As ETH hovers near these resistance zones, traders monitor whether it can continue toward the broader upside targets.
A long-term trendline has supported the latest bounce, aligning with previous Fibonacci levels from prior retracements. If the current wave completes successfully, ETH could be on course to reach $4,637 within the projected timeframe.
Wave Structure and Key Levels in Focus
The Elliott Wave pattern in this Ethereum analysis displays a classic five-wave cycle, with the first major leg already completed. The correction phase marked as wave (2) bottomed around $1,365, from where Ethereum began its next upward sequence. The recent breakout above $1,933 now sets the stage for wave 3 continuation.
The yellow and purple paths on the chart show two possible outcomes. The yellow wave projects a near-term move through $2,878 into a mid-wave retrace before continuing higher. The purple path indicates a more extended structure, with deeper retracements before reaching new highs by September 2025.
Currently, ETH is trading above key moving averages and has broken through resistance areas that once served as sell zones. Volume support appears to increase as Ethereum pushes toward $2,878, reinforcing the short-term bullish case.
Fibonacci and Trendlines Signal Continuation Potential
The Fibonacci retracement levels play a central role in confirming this wave progression. The 0.618 level at $2,394 has already acted as a pivot during previous corrections, while the 0.5 retracement near $2,025 marked a launch zone. Ethereum’s price behavior above these metrics supports the forecast for continued trend strength.
The white ascending trendline beneath price action has guided multiple rallies, acting as a baseline for long-term bullish momentum. Ethereum has respected this trendline through the cycles outlined in the chart, validating its technical relevance. Breakouts from recent formations suggest the market remains aligned with this structure.
Projected target zones extend as far as $4,637 if the wave completes. Analysts are watching how Ethereum behaves around $2,878 and whether price can hold higher lows after minor pullbacks. Successive waves could lead toward major expansion by the end of the year.
Can Ethereum Complete Wave 3 and Reach $4,637 Before 2026?
Ethereum has entered a rising wave structure with bullish momentum now building above $2,600. The next few moves will test if this structure holds or breaks. A failure near $2,878 may delay progress while a confirmed push could lead directly into the $4,637 zone.
