

Bitcoin completed a clear head and shoulders pattern and now trades close to the ninety five thousand level.
The next strong price target sits at one hundred thousand and may hit soon if momentum continues building.
Chart patterns and support zones are matching previous breakout cycles and suggest higher moves are possible.
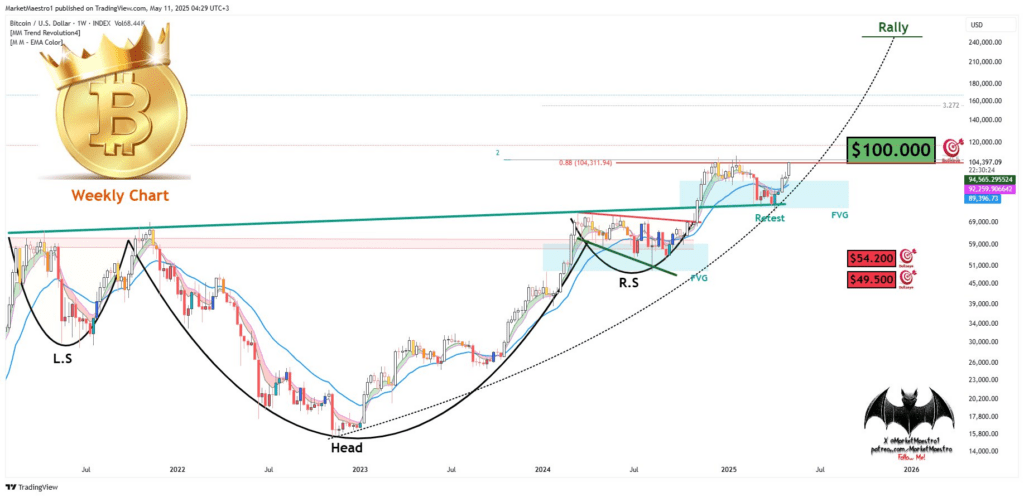
Bitcoin is preparing for a major move as the weekly chart shows a confirmed breakout and retest, targeting $100,000 in the near term. A visual analysis shared on May 11, 2025, highlights a large inverse head and shoulders structure. The pattern suggests a technical rally may be underway, supported by strong price behavior and historical alignment.
 Source: X Classic Chart Pattern Confirms Major Structural Breakout
The chart shows a textbook inverse head and shoulders with three key zones labeled as L.S. (left shoulder), Head, and R.S. (right shoulder). This structure has developed over the course of nearly two years and is now breaking above neckline resistance. The successful retest of this neckline signals potential continuation to much higher levels.
Bitcoin currently trades near $95,000, following a breakout above a multi-month resistance band between $89,396 and $94,256. The neckline break has been followed by a retest, confirming support in this zone. Traders often view this confirmation as a high-probability launch point in bullish setups.
According to the chart, the rally target remains around $100,000, with higher projections above $140,000 on a full Fibonacci extension. If momentum continues, BTC could reach those extended targets by mid-2026. Volume and moving average behavior further support the current structure's reliability.
Fibonacci Targets and Fair Value Gaps Add Confidence
The weekly chart also includes multiple Fibonacci extension levels to validate the $100,000 target. A key 0.88 extension level shows alignment with $101,514, providing convergence with the structural target. Beyond this level, projected extensions aim as high as $180,000 and $210,000 under extended rally conditions.
Two fair value gaps (FVG) are identified in the analysis, located between the $89,000 to $94,000 range and just above $100,000. These gaps often act as magnets in price discovery phases, drawing the asset toward key liquidity levels. Bitcoin’s current movement shows it closing one gap and approaching another.
Support levels have also been plotted below the structure, with key defense zones marked at $54,200 and $49,500. Should the breakout fail, these ranges may serve as important areas for recovery attempts. However, current structure and price action remain strongly bullish on the weekly timeframe.
Is Bitcoin Ready for a Sustained Rally Above $100K?
The key question now is whether Bitcoin can maintain momentum and break above the psychological $100,000 barrier. A successful move beyond this point would confirm the multi-year breakout and extend the long-term uptrend. Traders are monitoring price behavior closely near this resistance to assess confirmation.
Social sentiment and on-chain metrics are increasingly pointing toward accumulation zones and lower exchange supply, adding to the bullish view. Market participants also reference historical rally patterns where similar technical setups led to multi-month climbs. The clean structure and measured target continue to drive high conviction.
The current breakout has gained attention across crypto platforms. MarketMaestro labeled the setup as a launch phase and noted that “the rocket is ready to launch.” With price and chart structure aligned, Bitcoin’s next steps may define its 2025 cycle direction in the coming weeks.

