Trend analysis:
From the hourly, 4-hour, and daily charts you provided, the current price of ETH is around 2560, having pulled back slightly from the previous high of 2608. During this pullback, the K-line is still running above EMA5 and EMA10, and the short-term bullish structure has not been broken.

The 1-hour chart shows: Price rebounded after touching EMA20, and the short-term moving averages show signs of convergence, indicating an increased probability of short-term fluctuations, with direction waiting for a breakout.
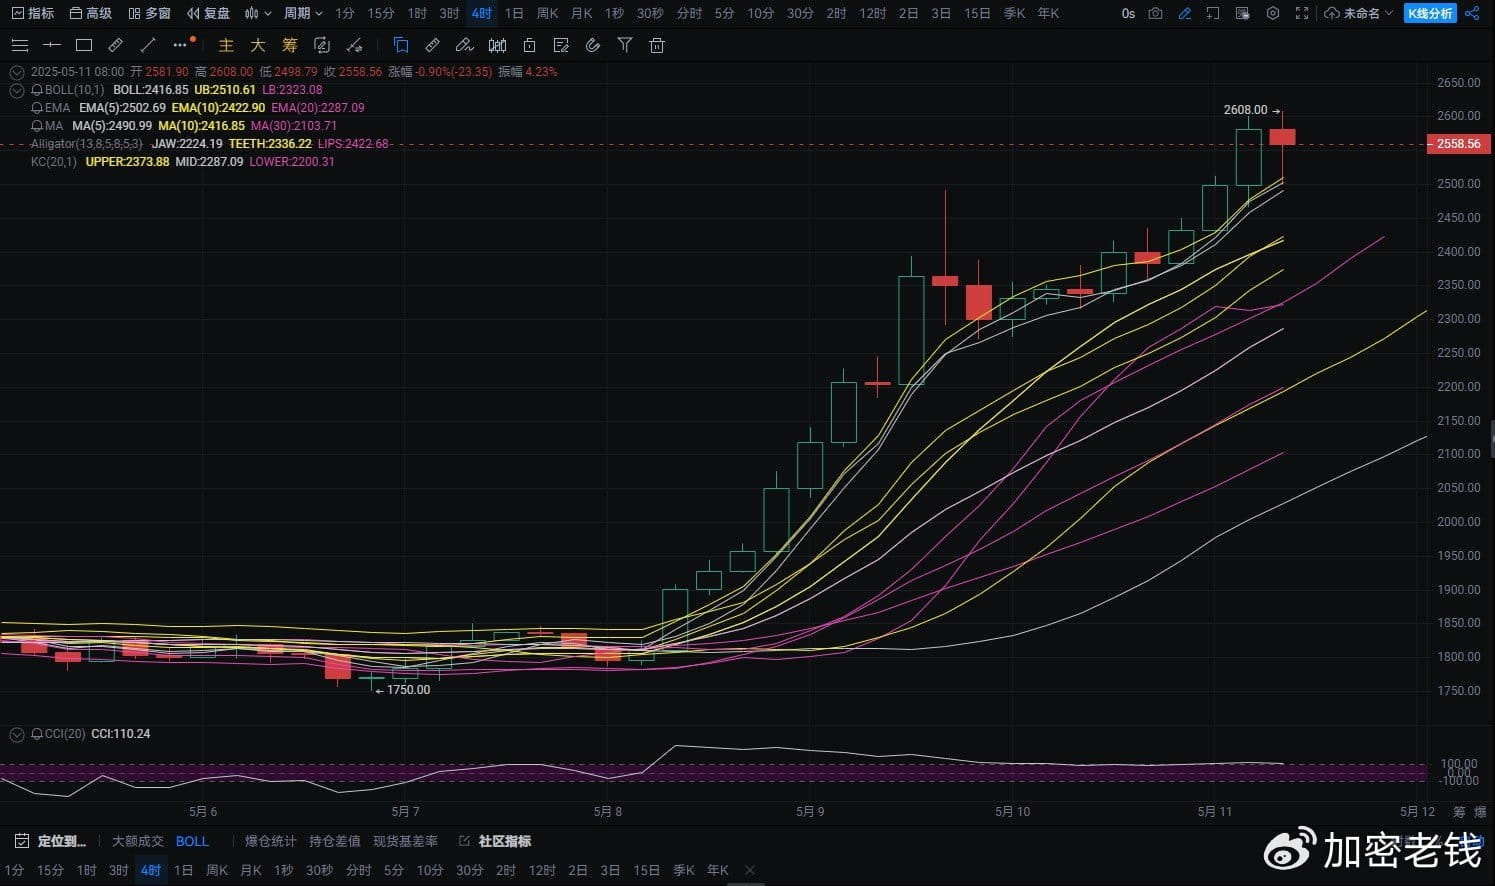
4-hour chart: After a large bullish candle, consecutive candles with upper and lower shadows show that there is some selling pressure in the high region. The MACD has not shown a death cross and is still in a bullish correction.

Daily chart: After a series of strong bullish candles, the first bearish candle appears, accompanied by volume convergence; although short-term sentiment has cooled, it does not indicate a reversal.
Forecast target:
The critical point for bulls and bears is about to be revealed; today is a watershed moment for whether ETH will continue to strengthen. Stay flexible, act when the opportunity arises, it's worth more than emotions.
Views are for reference only, treat them rationally, keep an eye on the charts, and don't hesitate when there is an opportunity.

