💡 Quick technical analysis:
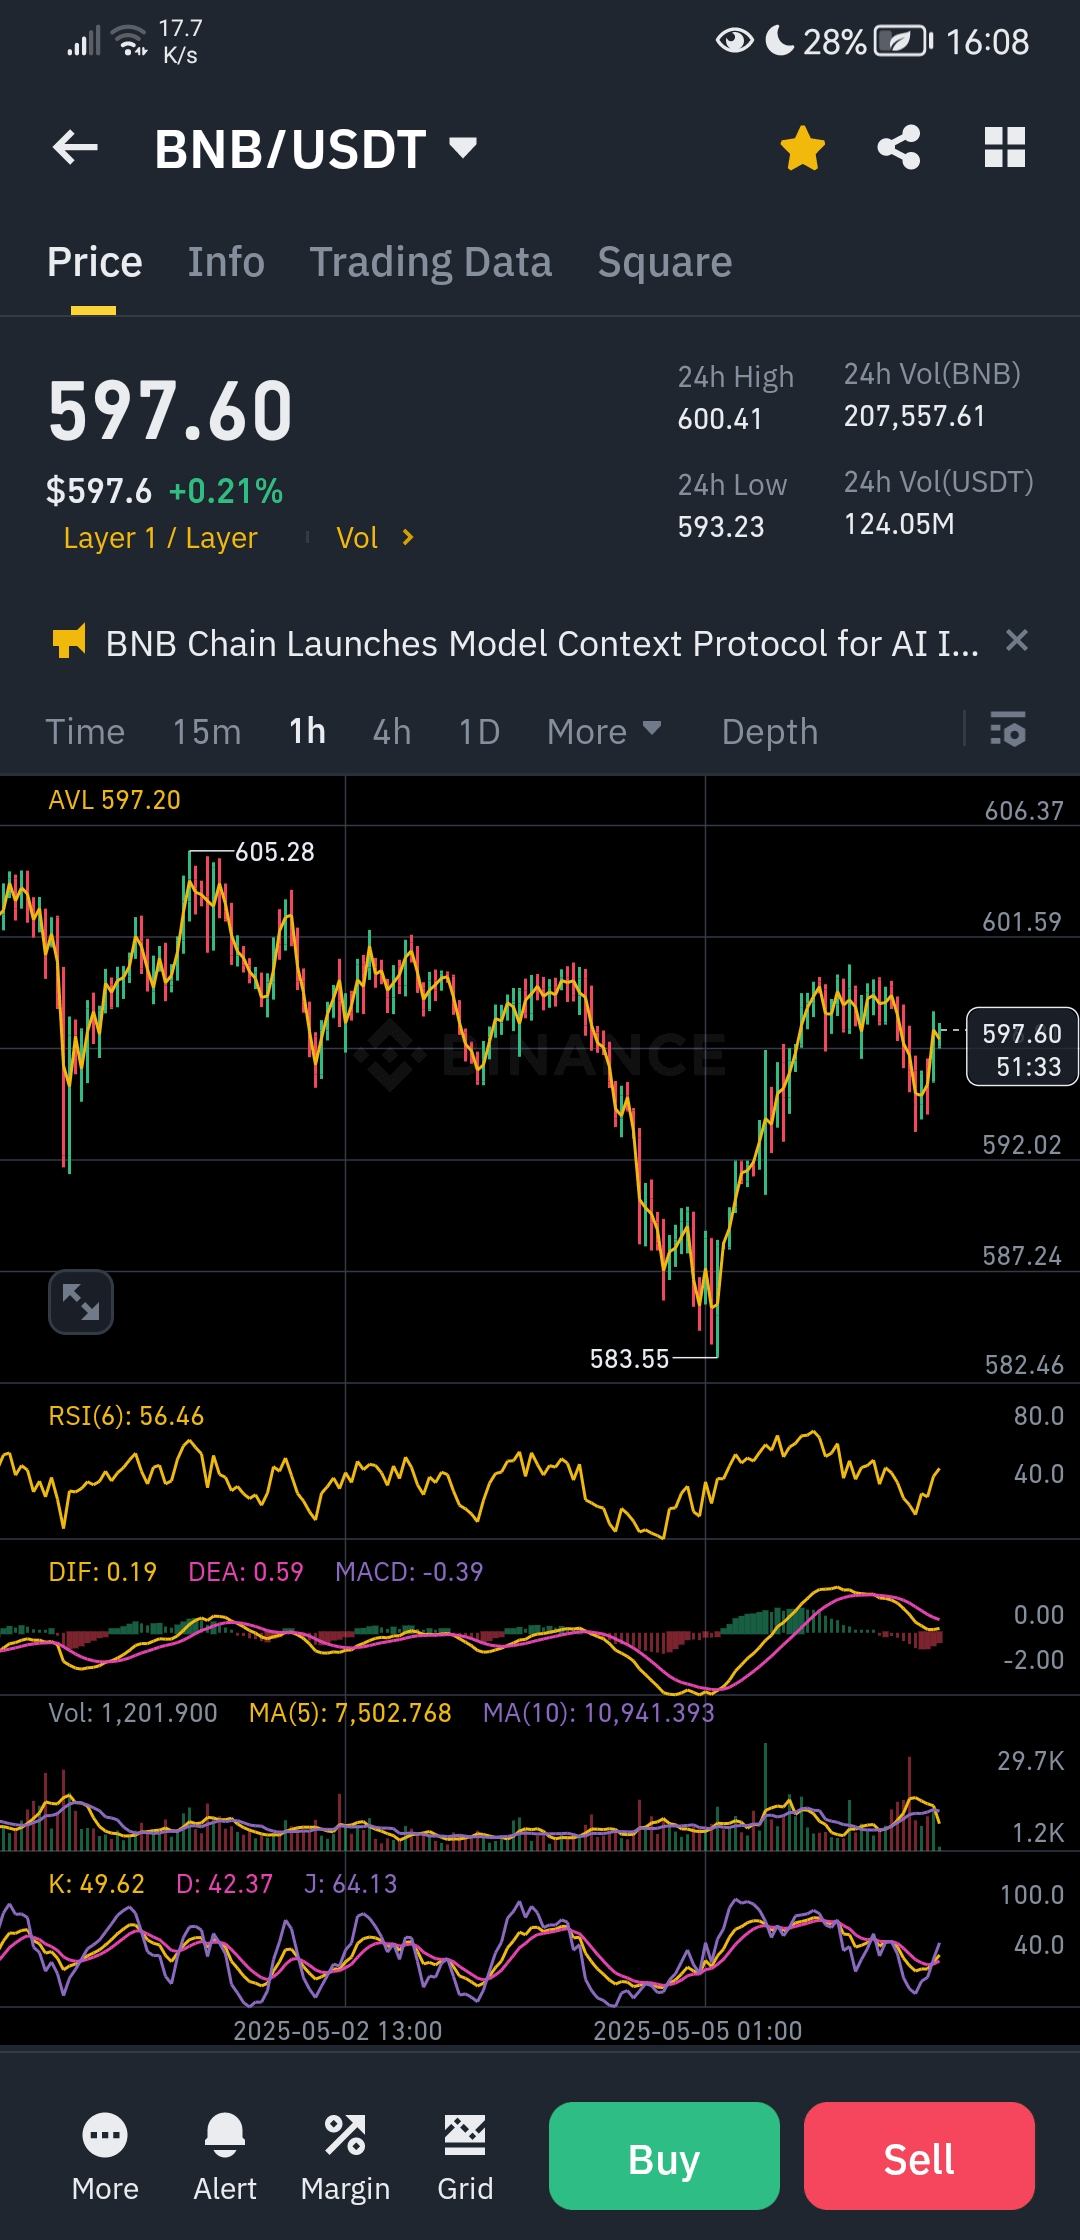
✅ Clear rebound! After a sharp drop to $583.55, BNB saw a strong rebound towards $597.60, indicating strong buying interest at these levels.
✅ RSI indicator at 56.46 → still in the neutral zone, allowing ample room for upward movement before reaching overbought conditions.
✅ MACD is in the process of a positive crossover → the momentum indicator is converging towards a bullish crossover, which could ignite a strong green candle in the coming hours.
✅ The moving averages (MA5 and MA10) show the beginning of convergence, which is a preparatory signal for an upcoming bullish move.
---
🚀 Expected scenario:
If the nearby resistance level at $600.41 (highest price in 24 hours) is broken, we might see a surge towards $610 and possibly $620 in the short term.
In case of a pullback, the $583 area forms strong support that could enhance any new rebound.
---
📊 Is there a visible technical pattern?
✅ A "V-Shape Recovery" pattern may form after the sharp decline and quick rebound, which often indicates a strong bullish reversal.
---
🚨 Supporting signals from indicators:
RSI still allows room for positive movement.
MACD is about to cross positively.
Trading volumes are stable with an upward trend – indicating the presence of buying accumulation.
---
🎯 Predictions for the upcoming movement:
Break of $600.41 → first target at $610 then $620.
Break below $583 → we may see a retest of the $575 level.
---
💬 My personal opinion:
BNB appears to be in a strong accumulation phase, and technical indicators support the likelihood of an upward move in the coming hours or days. An opportunity is present for those who monitor the movement closely – provided there is discipline.
---
✅ Final advice:
Do not enter the market without a stop loss – set a stop loss below $583.
Capital management is crucial – do not enter impulsively!
---
📢 What do you think? Is BNB ready to break the $600 mark and reach new highs? Share your prediction with us!