
Written by: Lawrence
Prologue: Gold’s Rhapsody and Bitcoin’s Undercurrent
In May 2025, financial elites in Manhattan, New York, are holding their breath and gazing at the "super month line" formed after the gold price broke through the $3,500 mark. This hard asset carnival, triggered by the resonance of the Fed's policy shift, geopolitical rifts and loosening of the US dollar's credit, has made Wall Street re-examine an old proposition: When gold breaks through the $5,000 skyline, how will Bitcoin, known as "digital gold", respond?
In the gold bull camp, the predictions of Ed Yardeni, head of Yardeni Research, and John Paulson, the godfather of hedge funds, are like two signal flares - they assert that gold will break through $5,000 and even aim for $6,000, and behind this process, the epic narrative of the devaluation of the US dollar and the "de-dollarization" of global central banks is accelerating. At the same time, Bitcoin supporters marked even crazier coordinates on the candlestick chart: $155,000, $285,000, and even $400,000. This war for the dominance of the value storage medium is essentially an ultimate experiment on the "scarcity pricing power."
Chapter 1: Reproduction and Variation of Historical Scripts
1.1 The “Six-fold Law” of Gold and Bitcoin

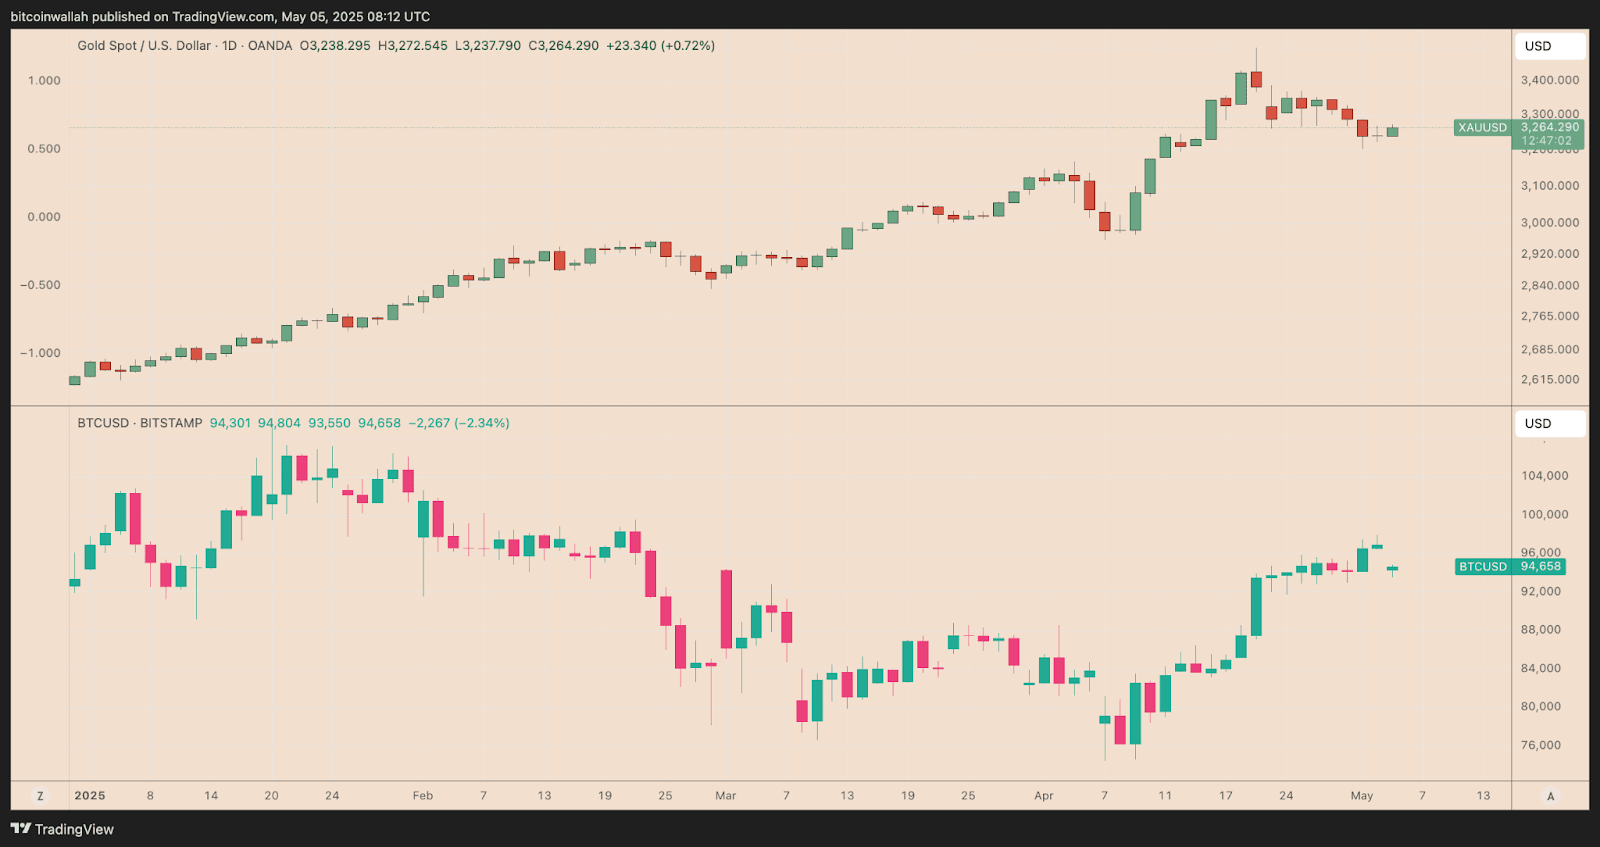
XAU/USD vs BTC/USD and global M2 supply weekly chart. Source: TradingView
Looking back at the period from March 2020 to March 2022, the Fed's "unlimited QE" policy pushed up the global M2 money supply by 23%. During this period, gold rose by 35.5%, while Bitcoin left precious metals far behind with a 1110% increase - the difference between the two increases was 31 times. In the more recent cycle from November 2022 to November 2023, gold's 25% increase was once again crushed by Bitcoin's 150% violent increase, forming a 6-fold increase difference.
The underlying logic of this "digital asset amplifier effect" is that the rigidity of Bitcoin's supply (a constant total of 21 million coins) and the elastic mining of gold (annual increase of about 3,000 tons) form a structural difference. When the global liquidity gate opens, funds tend to flow into assets with stronger deflationary properties. Based on the current gold price of $3,265, if it rises 50% to $5,000, based on the historical 6-fold increase, the theoretical target price of Bitcoin will be $285,000.
1.2 Power Law Curve: Critical Hit from Mathematical Model

Source: X/apsk32
The "Gold Market Value Standardization Model" by anonymous analyst apsk32 reveals an even more astonishing picture. As of April 2025, the total market value of gold in the world is approximately $22.59 trillion, while the circulating market value of Bitcoin is only $2 trillion. According to this power law model, the theoretical price of Bitcoin should rise to $150,000.
Frank Holmes, CEO of U.S. Global Investors, added: "The rise in gold is essentially a lagged reaction to the surge in global M2 money supply, and Bitcoin is absorbing the expectation gap of this currency depreciation." He regards the Trump administration's tariff policy as a key variable - if the dollar depreciates by 25% as a result, Bitcoin's "anti-sovereign risk premium" will push its price to break through $150,000 in the short term, and even reach $250,000 in the long term.
Chapter 2: The bright and dark lines of market competition
2.1 Institutional players double down
The capital battlefield in 2025 showed subtle differentiation: the management scale of BlackRock Bitcoin ETF (IBIT) exceeded US$53.7 billion, and the average daily trading volume accounted for 1.2% of Nasdaq. On the other hand, the net gold purchases of global central banks in 2024 reached 1,180 tons, setting a record since the collapse of the Bretton Woods system.
This "two-handed" strategy exposes the real considerations of institutions: gold is a shield to deal with short-term liquidity crises, while Bitcoin is a spear to capture the long-term monetary paradigm shift. The remarks of Michael Saylor, founder of MicroStrategy, are quite representative: "We buy Bitcoin not to fight inflation, but to escape the fiat currency system."
2.2 Correlation fission: from linkage to divergence
The market fluctuations at the beginning of 2025 have added suspense to this game: gold has risen 26.6% since the beginning of the year, but Bitcoin has fallen 9.5%. Fidelity Investments' macro data shows that the Sharpe ratio (risk-adjusted return indicator) between Bitcoin and gold has shown a "scissors gap" - Bitcoin is -0.40, and gold is 1.33. This divergence suggests that Bitcoin is moving away from the label of "safe haven assets" and instead forming a high-volatility linkage with technology stocks.

But historical experience still provides key clues: After gold rose 30% in 2017, Bitcoin hit a peak of $19,000 at the end of the year; after gold broke through $2,075 in 2020, Bitcoin soared to $69,000 in 2021.
Analyst Cryptollica pointed out: "The lag period of Bitcoin to gold trends is usually 100-150 days. The current pullback in gold prices after breaking through $3,500 may be brewing Bitcoin's sprint to $155,000."
Chapter 3: Macro variables and black swan traps
3.1 The domino effect of the loosening of US dollar hegemony
The Trump administration's "tariff bomb" is reshaping global capital flows. U.S. tariffs on Chinese goods have soared to 104%, causing import prices to rise by 2.5% and increasing household annual spending by $4,000. The Federal Reserve may be forced to restart QE to ease economic pressure, which will further weaken the credit of the U.S. dollar - every 1% depreciation of the U.S. dollar can theoretically drive Bitcoin up by 2.3%.
Gold bull Peter Schiff warned: "The rise of Bitcoin requires the collapse of the US dollar as fuel, but this will trigger catastrophic inflation." However, the data reveals a more complicated truth: during the decline of the US dollar index in 2023, gold and Bitcoin rose by 13.2% and 155.5% respectively, showing the synergy between the two in specific scenarios.
3.2 Halving cycle and liquidity trap
The Bitcoin halving event in April 2024 has triggered a "silent hoarding" of on-chain activities. The BTC balance on exchanges has fallen to the lowest level since 2018, and more than 63% of the circulating supply has been held for more than a year. This "liquidity exhaustion" contrasts with the continued redemption of gold ETFs: in Q1 2025, global gold ETFs had a net outflow of $8.3 billion, while Bitcoin ETFs had a net inflow of $4.7 billion during the same period.
Anonymous trader Titan of Crypto used technical analysis to describe the critical point: "Bitcoin's triangle consolidation pattern has lasted for 87 days. Breaking through the $85,000 resistance level will trigger a collective charge of algorithmic trading." And the "Minsky moment" argument for gold (referring to the unsustainable debt) is reinforcing this expectation - Galaxy Digital CEO Mike Novogratz asserted: "When the interest on $35 trillion in national debt devours the fiscal budget, code-backed scarcity will become a new belief."
Final Chapter: The Ultimate Experiment in Value Storage Medium
Standing at the hypothetical threshold of $5,000 gold, Bitcoin's pricing has long surpassed the traditional valuation framework. It is not only a flood outlet for excess global liquidity, but also an escape hatch for the collapse of sovereign credit, and it is also the first civilization-level experiment in which humans use mathematics to fight inflation.
The interim answer to this experiment may be hidden in two types of data:
$285,000: Power law model target based on gold market value comparison
400,000 US dollars: The extreme value of the resonance between the computing power growth curve and the halving cycle
But the deeper revelation is that while gold has built a "physical moat" with the consensus of thousands of years, Bitcoin is using blockchain technology to write the code of the "digital Babel Tower". There may be no loser in the ultimate showdown between the two - in the twilight of the legal currency system, they together form a "twin defense line" against currency depreciation.


