From the candlestick structure, XRP is on the eve of a critical turning point. The price has been consolidating around the 2.20 range without a clear trend breakthrough in the short term, but from a multi-timeframe analysis, potential momentum is already building up.
Technical structure breakdown:
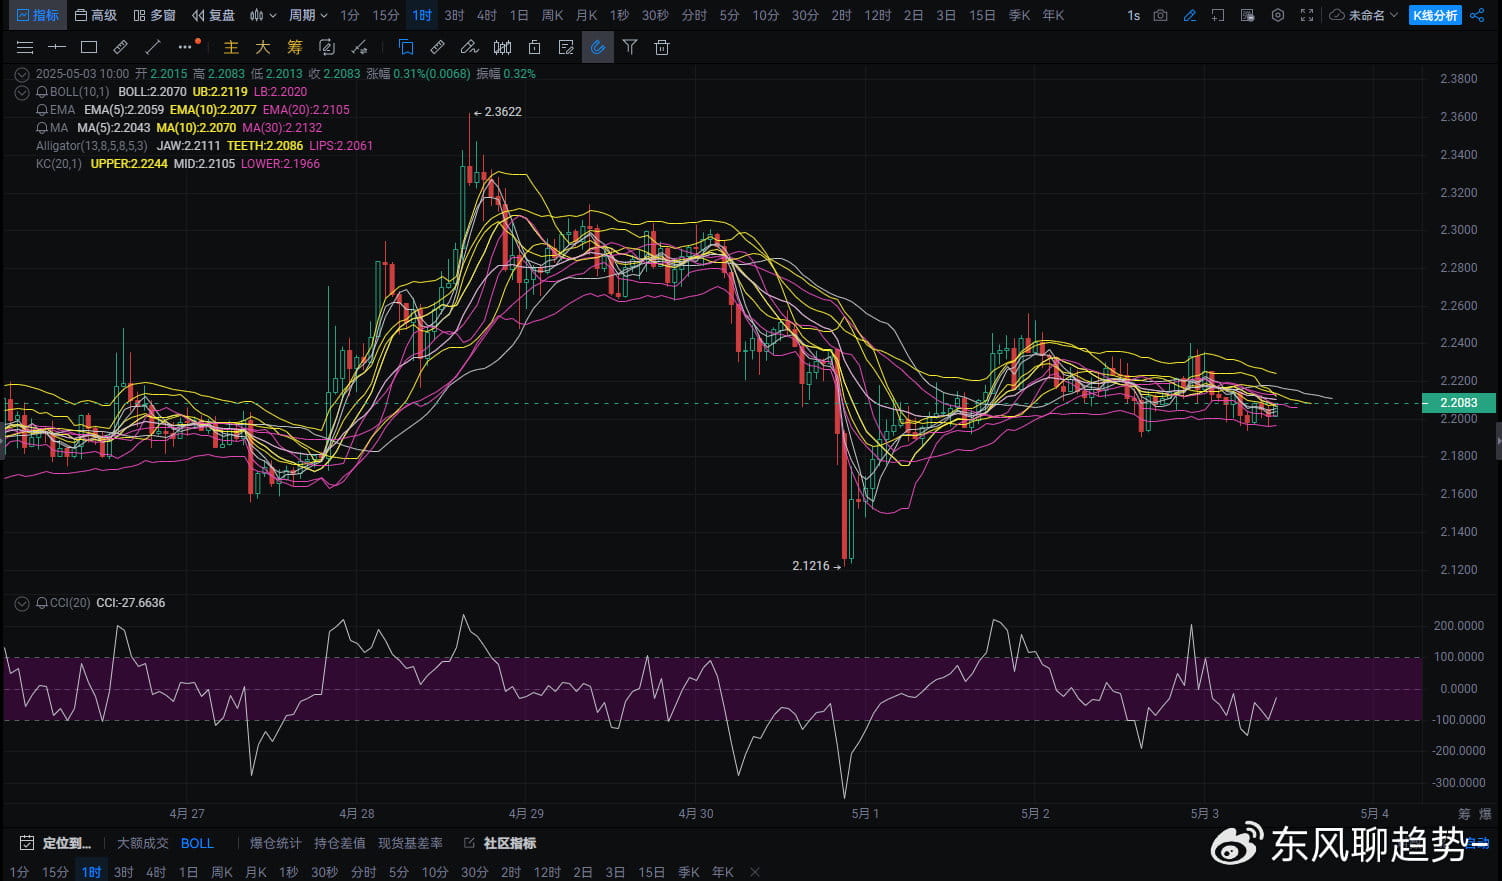
1-hour chart:
Pattern structure: Bollinger Bands are continuously constricting, price oscillating around the middle track;
Short-term resistance: MA20 and BOLL upper band overlap at 2.22, repeatedly suppressing;
Support reference: 2.18-2.19 range (multiple tests without breaking);
CCI Indicator: In a weak rebound structure, but has not yet left the oscillation range;
Conclusion: Hourly level is at the end of the oscillation range, facing directional choice at any time.

4-hour chart:
Pattern structure: Bearish trend, price operating below multiple moving averages, EMA system shows a bearish arrangement;
Support and resistance:
Strong resistance: 2.23-2.25 area (dense moving average resistance zone);
Effective support: Around 2.15;
CCI trend: After multiple dips below -100, the rebound is weak, and momentum has not yet recovered;
Conclusion: The 4-hour level remains weak; if unable to break the moving average resistance, a continuation of the pullback is likely.

Daily chart:
Overall trend: Rebound hampered, entering sideways adjustment, MA5 and MA10 are converging, and trading volume continues to shrink;
Historical high point: 3.4043 (long bearish engulfing retreat), currently in a repair period;
Short-term direction: Neutral to bearish, daily indicators have not shown obvious divergence or strength reversal;
Today's operational suggestions:
Stop-loss position: 2.122
Short-term target:
First target: 2.250
Second target: 2.290


