
Pi Network (PI) has decreased by more than 8.5% over the past seven days. It traded below $0.65 for six consecutive days but has dropped below $0.60 today. The trend remains weak, with price action stuck below the Ichimoku Cloud.
The RSI of this altcoin briefly rose above 50 but has since fallen back to 45, indicating that bullish momentum is fading. The EMA is still declining. It is hovering just above the key support level, and the next move could determine between deeper declines and the potential for recovery.
Pi Network faces bearish pressure below the Ichimoku cloud
Pi Network is still trading below the Ichimoku Cloud, indicating an overall bearish market structure. However, a potential shift may be developing, as the blue Tenkan-sen (conversion line) has recently crossed above the red Kijun-sen (base line).
This crossover is often seen as an early bullish signal, especially if confirmed by increased volume or a move into the cloud. However, the future cloud remains red, indicating continued resistance ahead and signaling that the overall trend is still under pressure.
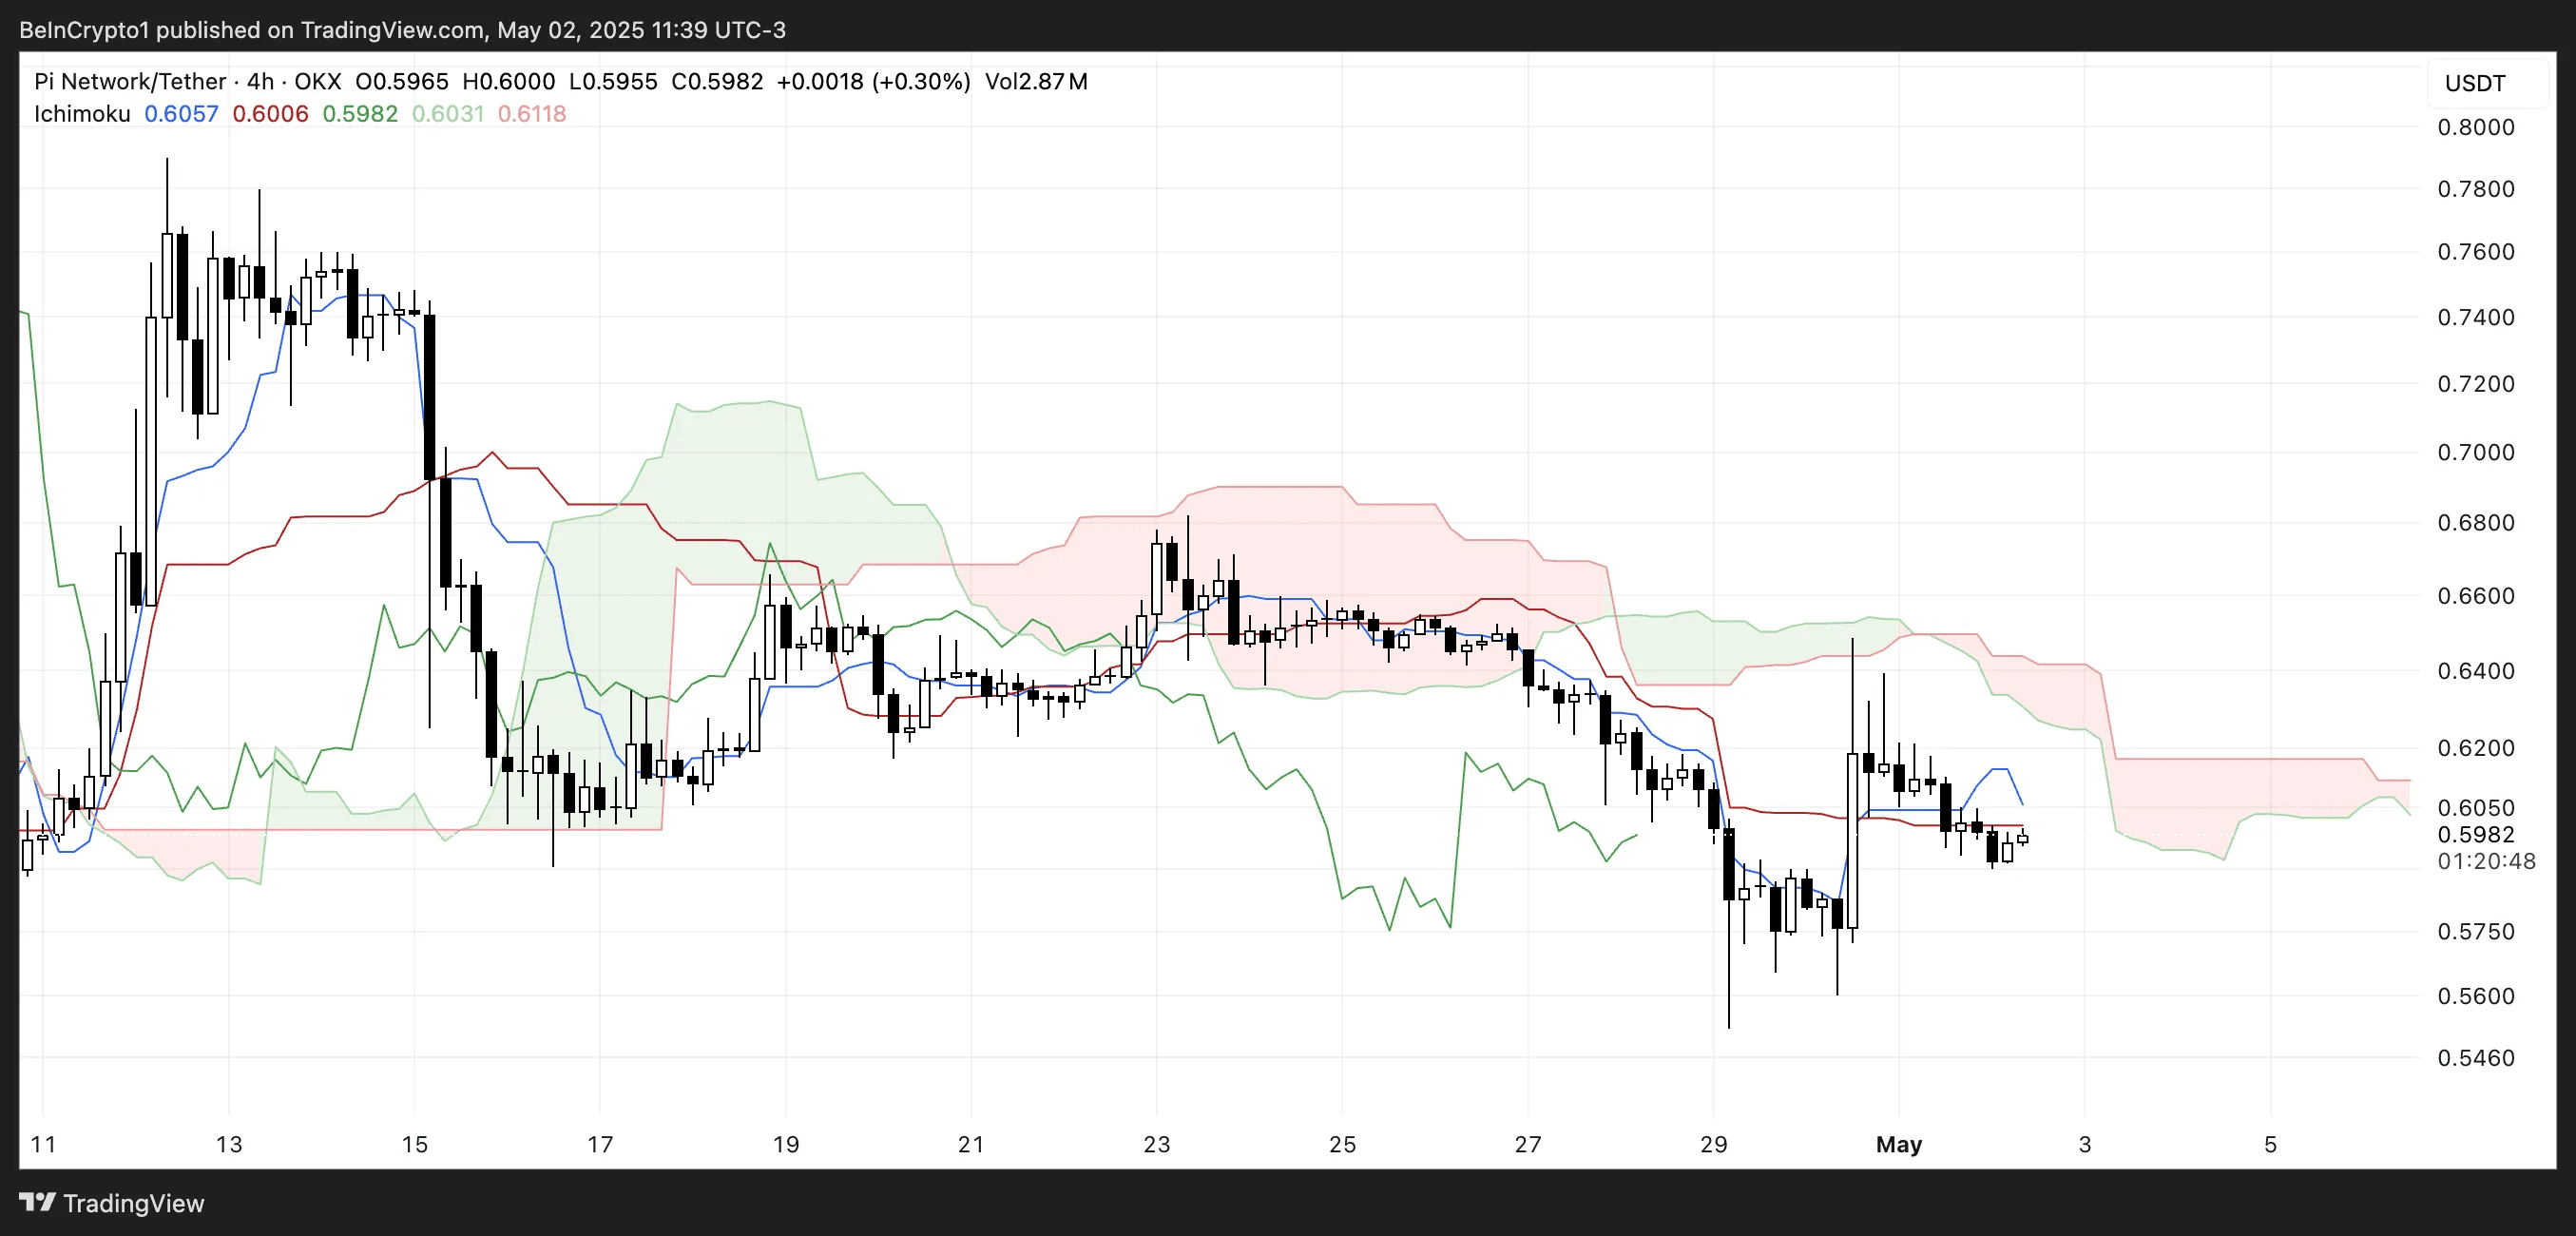
Chikou Span (lagging line) remains below both the price candles and the cloud. This means that any bullish move has yet to be confirmed.
To truly reverse the trend, PI must break and remain above the cloud. The future cloud must also turn green, with all Ichimoku signals being bullish.
Currently, the setup shows hesitation. There is a short-term bullish crossover, but the price remains below the cloud and the overall trend is still bearish.
The momentum of Pi Network is slowing down as the RSI drops below 50.
The RSI of Pi Network is currently at 45.41, slightly down after a strong increase from 28.49 to 54.40 just two days ago. This suggests that bullish momentum is slowing down after a brief recovery.
A retracement from above 50 indicates that buying pressure has weakened and PI is entering a more neutral zone, where neither buyers nor sellers have complete control.
This rapid reversal also reflects uncertainty in the current price trend.

The Relative Strength Index (RSI) is a momentum oscillator that ranges from 0 to 100, commonly used to identify overbought or oversold conditions.
Indicators above 70 indicate that an asset may be overbought and due for a correction, while indicators below 30 suggest oversold conditions and potential recovery. Values from 30 to 70 are considered neutral, with 50 being a key pivot point.
The current RSI of PI is at 45.41, below that threshold, implying a slight downtrend unless this metric turns back upward. If the RSI continues to drop, it could reflect increasing selling pressure and the risk of prices continuing to weaken.
Pi Network hovers near the key support level with a declining EMA.
The price of PI is trading just above the crucial support level of $0.59, with bearish pressure increasing.
If this level is challenged and broken, the next key support levels are at $0.547 and $0.40, potentially forcing the token to undergo a deeper correction.

The Exponential Moving Average (EMA) remains in a downtrend, with the short-term EMA below the long-term EMA. This structure typically signals that the overall trend remains bearish.
However, if the trend reverses and buyers enter, PI could rise to test the resistance level at $0.648, followed by $0.682.
A breakout above both of these levels—especially if supported by volume and the EMA crossover in an upward direction—could drive the price up to $0.789, signaling a shift towards a more sustainable upward trend.