
Bitcoin traded between $96,869 and $97,057 in the past hour, maintaining a narrow range near recent highs. With a 24-hour daily range from $95,925 to $97,341, this leading cryptocurrency boasts a market cap of $1.92 trillion and a 24-hour trading volume of $27.81 billion, signaling ongoing investor interest.
The daily BTC/USD chart reflects a strong bullish breakout from the previous consolidation zone of $74,000 to $84,000. This breakout, followed by a surge to $97,470, is supported by increased buying volume, indicating strong market backing. Price action suggests potential for a continuation pattern, possibly an ascending triangle before the breakout.
Current support is around $88,000 with immediate resistance close to $97,500. Technicians suggest that a pullback to the $90,000–$92,000 range could provide a lower-risk long-term entry, with a short-term target of $97,500 and a medium-term target of $100,000.

On the 4-hour BTC/USD chart, the trend remains bullish, supported by a series of higher highs and higher lows. A small support zone at $94,000–$95,000, previously resistance, has now turned into support. Volume spikes as prices rise combined with lighter pullbacks create a constructive pattern.
The small cup and handle pattern before moving to $97,470 continues to support the bullish outlook. A retest of the $95,000 region, if accompanied by selling on low volume, would provide a potential entry with a target around $97,500 or higher if the upward momentum is sustained.

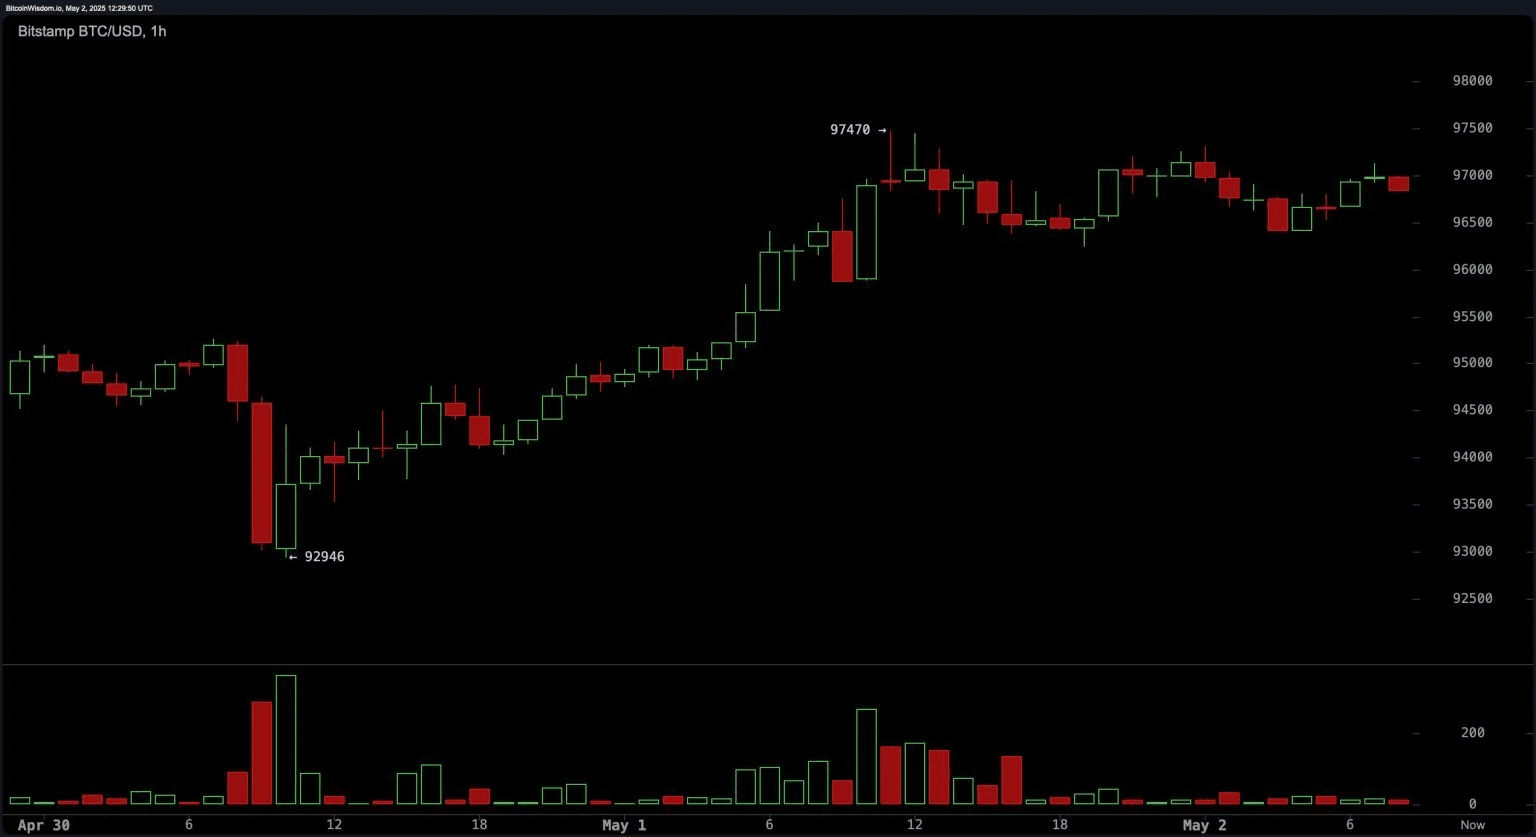
The 1-hour chart illustrates a strong V-shaped recovery from the recent low of $92,946, indicating a bearish trap and renewed upward strength. Bitcoin is currently consolidating in a tight range from $96,500 to $97,500. The decreasing volume during this consolidation hints at a potential breakout. An aggressive strategy includes buying a confirmed breakout above $97,500 with volume support, targeting $99,000 to $100,000. A cautious stop-loss may be placed just below $96,000.
Oscillation data is largely neutral, reflecting that the market is in a balanced state but trending bullish. The Relative Strength Index (RSI), Stochastic, Commodity Channel Index (CCI), and Average Directional Index (ADX) all report neutral figures. The Awesome Oscillator and Moving Average Convergence Divergence (MACD) signal buying, while the momentum indicator shows caution with a sell signal. This mixed setup highlights the need for volume confirmation before any significant entries.
All major moving averages (MA) from short-term to long-term—both the Exponential Moving Average (EMA) and Simple Moving Average (SMA)—are flashing buy signals. The EMA at cycles of 10, 20, 30, 50, 100, and 200, as well as the corresponding SMAs, are all trending upward. This reinforces the strong bullish structure in both the short-term and long-term outlooks. Traders are advised to monitor volume and resistance at $97,500 to confirm the next major move.
Bull's Commentary
The technical backdrop for Bitcoin remains decisively bullish. With consistent buy signals across all major moving averages, a strong breakout on the daily chart, and recovery volume patterns, the path towards the psychological level of $100,000 appears well-supported—provided that prices can confidently break through the resistance of $97,500.
Bear's Commentary
Despite the bullish setup, Bitcoin faces important resistance at $97,500, and mixed oscillation signals indicate potential exhaustion. Failing to surpass this level, especially with decreasing volume, could trigger a reversal towards the support zone of $94,000–$92,000, leading the market into a deeper correction phase.
