💡 Quick technical analysis:
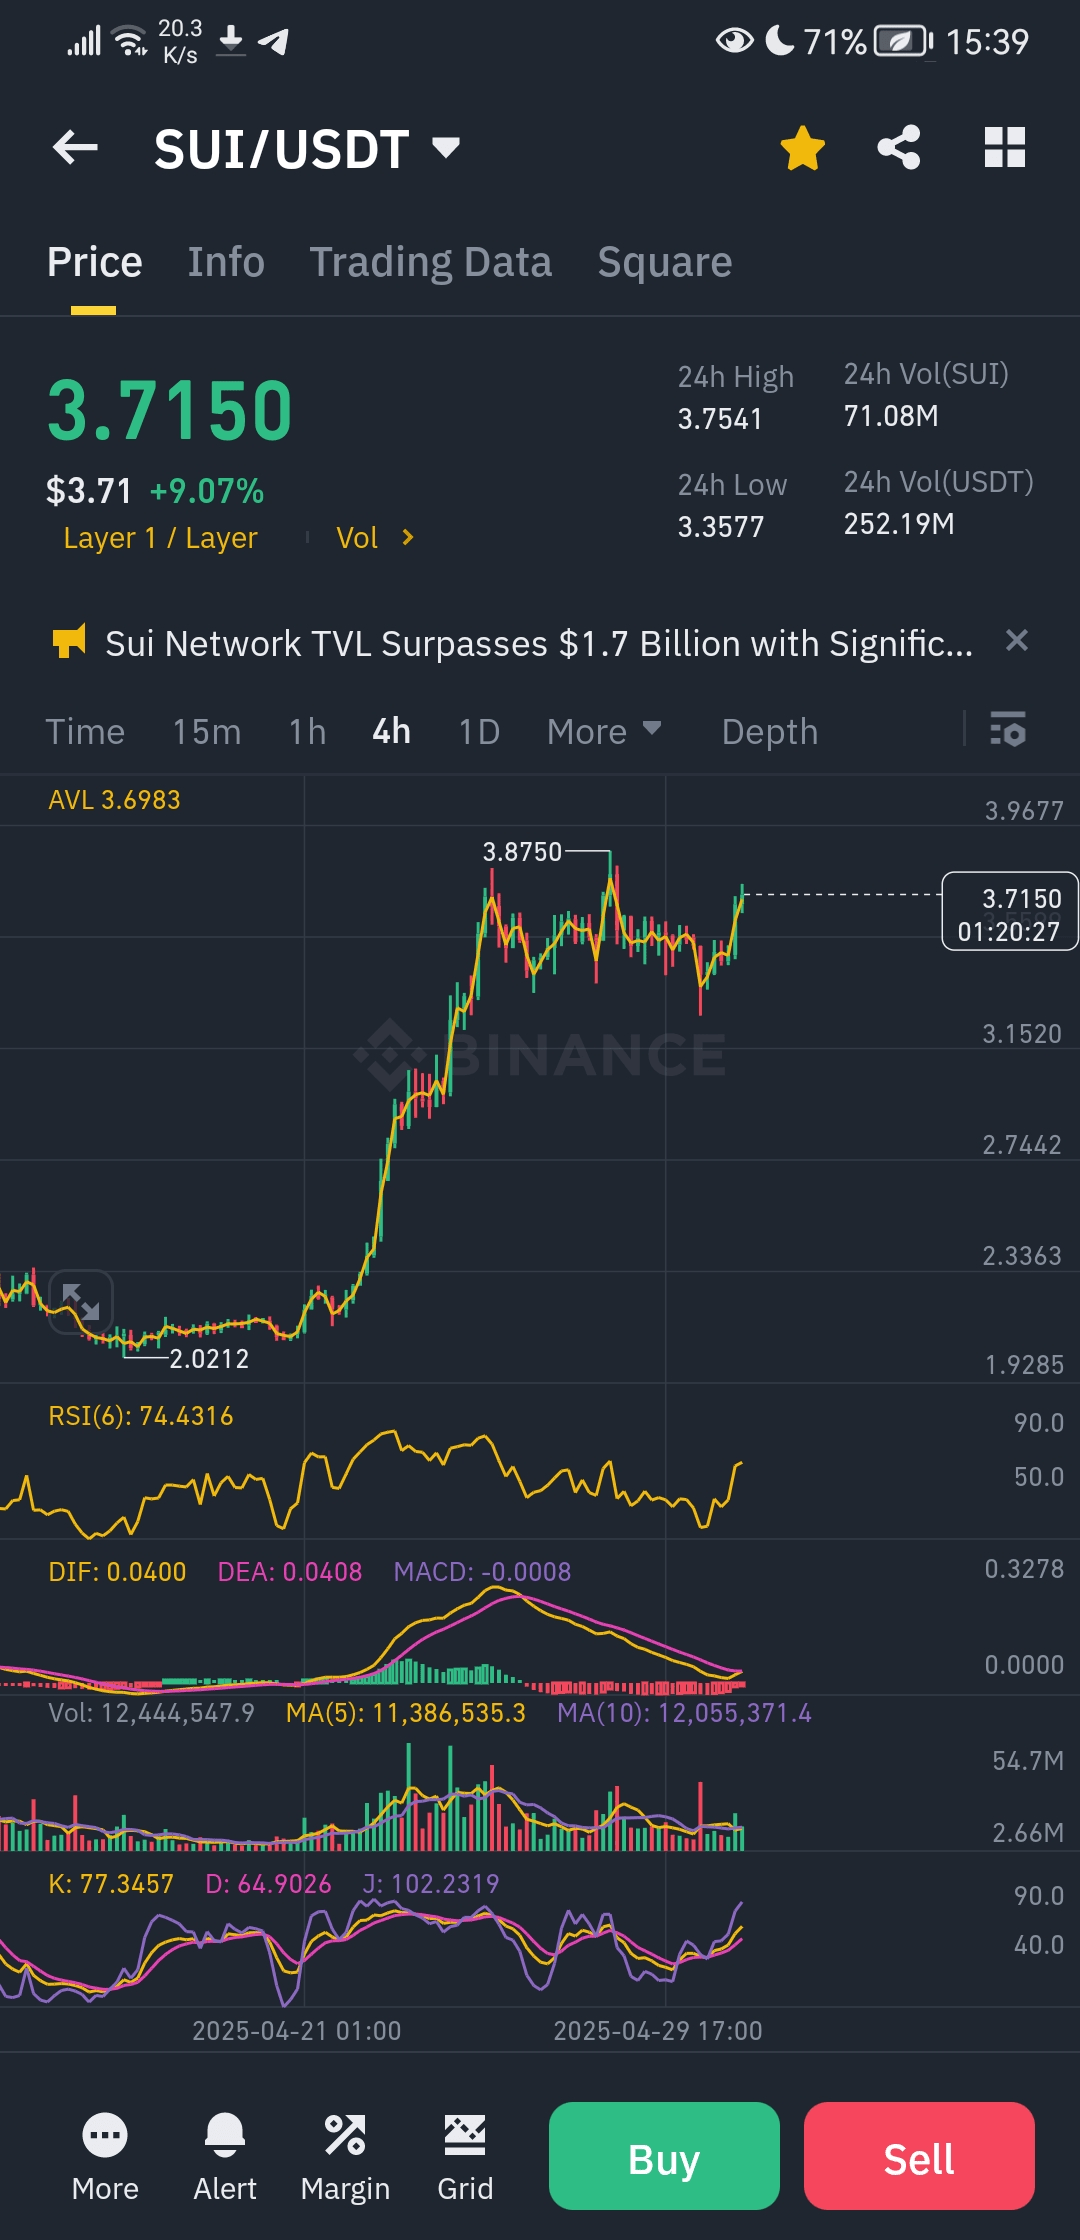
✅ Strong and sudden rise! SUI rebounded from $2.02 to $3.87 and is currently stabilizing at $3.71, showing significant buying interest and strong liquidity entry.
✅ RSI is high at 74.43! Indicating entry into the overbought zone – but this could be the beginning of additional upward momentum if buying pressure continues.
✅ MACD is close to a positive crossover! The difference between the DIF and DEA lines is diminishing, which could produce strong green candles soon.
---
📊 A look at the technical pattern:
🔍 Is an ascending triangle pattern forming?
The price is currently moving within a narrow sideways range after a strong upward wave, with higher lows and multiple bounces near $3.87.
Breaking this resistance will open the door to entirely new levels – perhaps towards $4.20 and then $5.00!
---
🚨 Support signals from indicators:
RSI > 70 → Strong momentum, but caution is required against corrections.
MACD is close to a positive crossover → a signal for the potential start of a new wave.
Trading volumes are stable → indicating potential accumulation before a new breakout.
---
🎯 Upcoming movement predictions:
If the resistance area at $3.87 is broken → we could see a quick breakout towards $4.20 - $4.50 and possibly more.
In case of a pullback → strong support levels between $3.35 and $3.15 may hold and provide new buying opportunities.
---
💬 My personal opinion:
SUI is experiencing a critical technical moment – all indicators point to strong momentum and the potential for a price explosion, especially if the previous peak at $3.87 is broken.
But caution is needed against quick corrections as RSI reaches overbought areas.
---
✅ Final advice:
Don't enter without a plan! Set a stop loss below $3.35 to avoid any sudden reversals.
Real-time monitoring is essential during this period, especially amid rapid market movements.
---
📢 Do you think SUI will shoot towards $5.00 soon? Or should we wait for a correction before the breakout? Share your predictions!