


Key Indicators: (April 21, 4 PM - April 28, 4 PM Hong Kong Time)
BTC rises 8.2% against USD (from 87,500 to 94,700 USD), ETH rises 13.2% against USD (from 1,590 to 1,800 USD)

Last week, we saw prices cleanly and quickly break through the key resistance level of 89,000-91,000 USD (in line with the 100-day moving average), faster than our initial expectations (and seemingly exceeding market expectations). Currently, we expect prices to take a slight breather and consolidate within the comfortable range of 92,000-99,000 USD, especially considering the upcoming May Day holiday and local Asian festivals.
In the coming weeks, we expect the market to begin attempting to break through the resistance level of 100,000 USD, but there are indeed many sell orders to penetrate first. If it falls below 89,000 USD, prices may retrace to the 82,000-89,000 USD range, but we anticipate strong buying support within the 91,000-89,000 USD range. We remain bullish in the medium term, expecting to reach new highs over the next few quarters, with target price levels between 115,000 and 125,000 USD. After breaking through the key resistance level, the current price trend appears clearer.
Market Theme
Risk assets performed well this week. Trump and Besant have softened their stance on the US-China tariff issue, suggesting they recognize their positions were too hardline (China refuses to comply with the 'astronomical treaty' proposed). Trump also denied reports of firing Fed Chairman Powell in the short term. Although the reasons for Trump's change in attitude are hard to determine, the timing of the shift coincides with his approval ratings falling to their lowest since taking office, which does not seem coincidental. This further confirms that Trump is still influenced by his voter base and does not want to push the US economy into recession, especially ahead of the midterm elections. Long-term Treasury yields have rapidly retreated from their highs, and the stock market has regained its footing, with the S&P index returning to 5,500, having only fallen 10% from historical highs despite a tumultuous period. The VIX fear index, after an unexpectedly long period above 30, has finally fallen below 25.
For cryptocurrencies, the correlation between Bitcoin and the S&P index continues to weaken, but it is still supported by risk assets, briefly breaking through 95,000 USD last weekend. Other smaller coins have finally joined the upward trend, showing a stronger correlation with risk assets. Ethereum briefly peaked at 1,800 USD but still lacks momentum for further increases. Overall, it seems that Bitcoin still faces considerable obstacles before reaching 100,000 USD, such as positions that were not sold in time before the last drop and those hoping to re-enter at lower points between 75,000 and 82,000 USD. Therefore, without new catalysts, we expect prices to remain stable within this range.
BTC ATM Implied Volatility
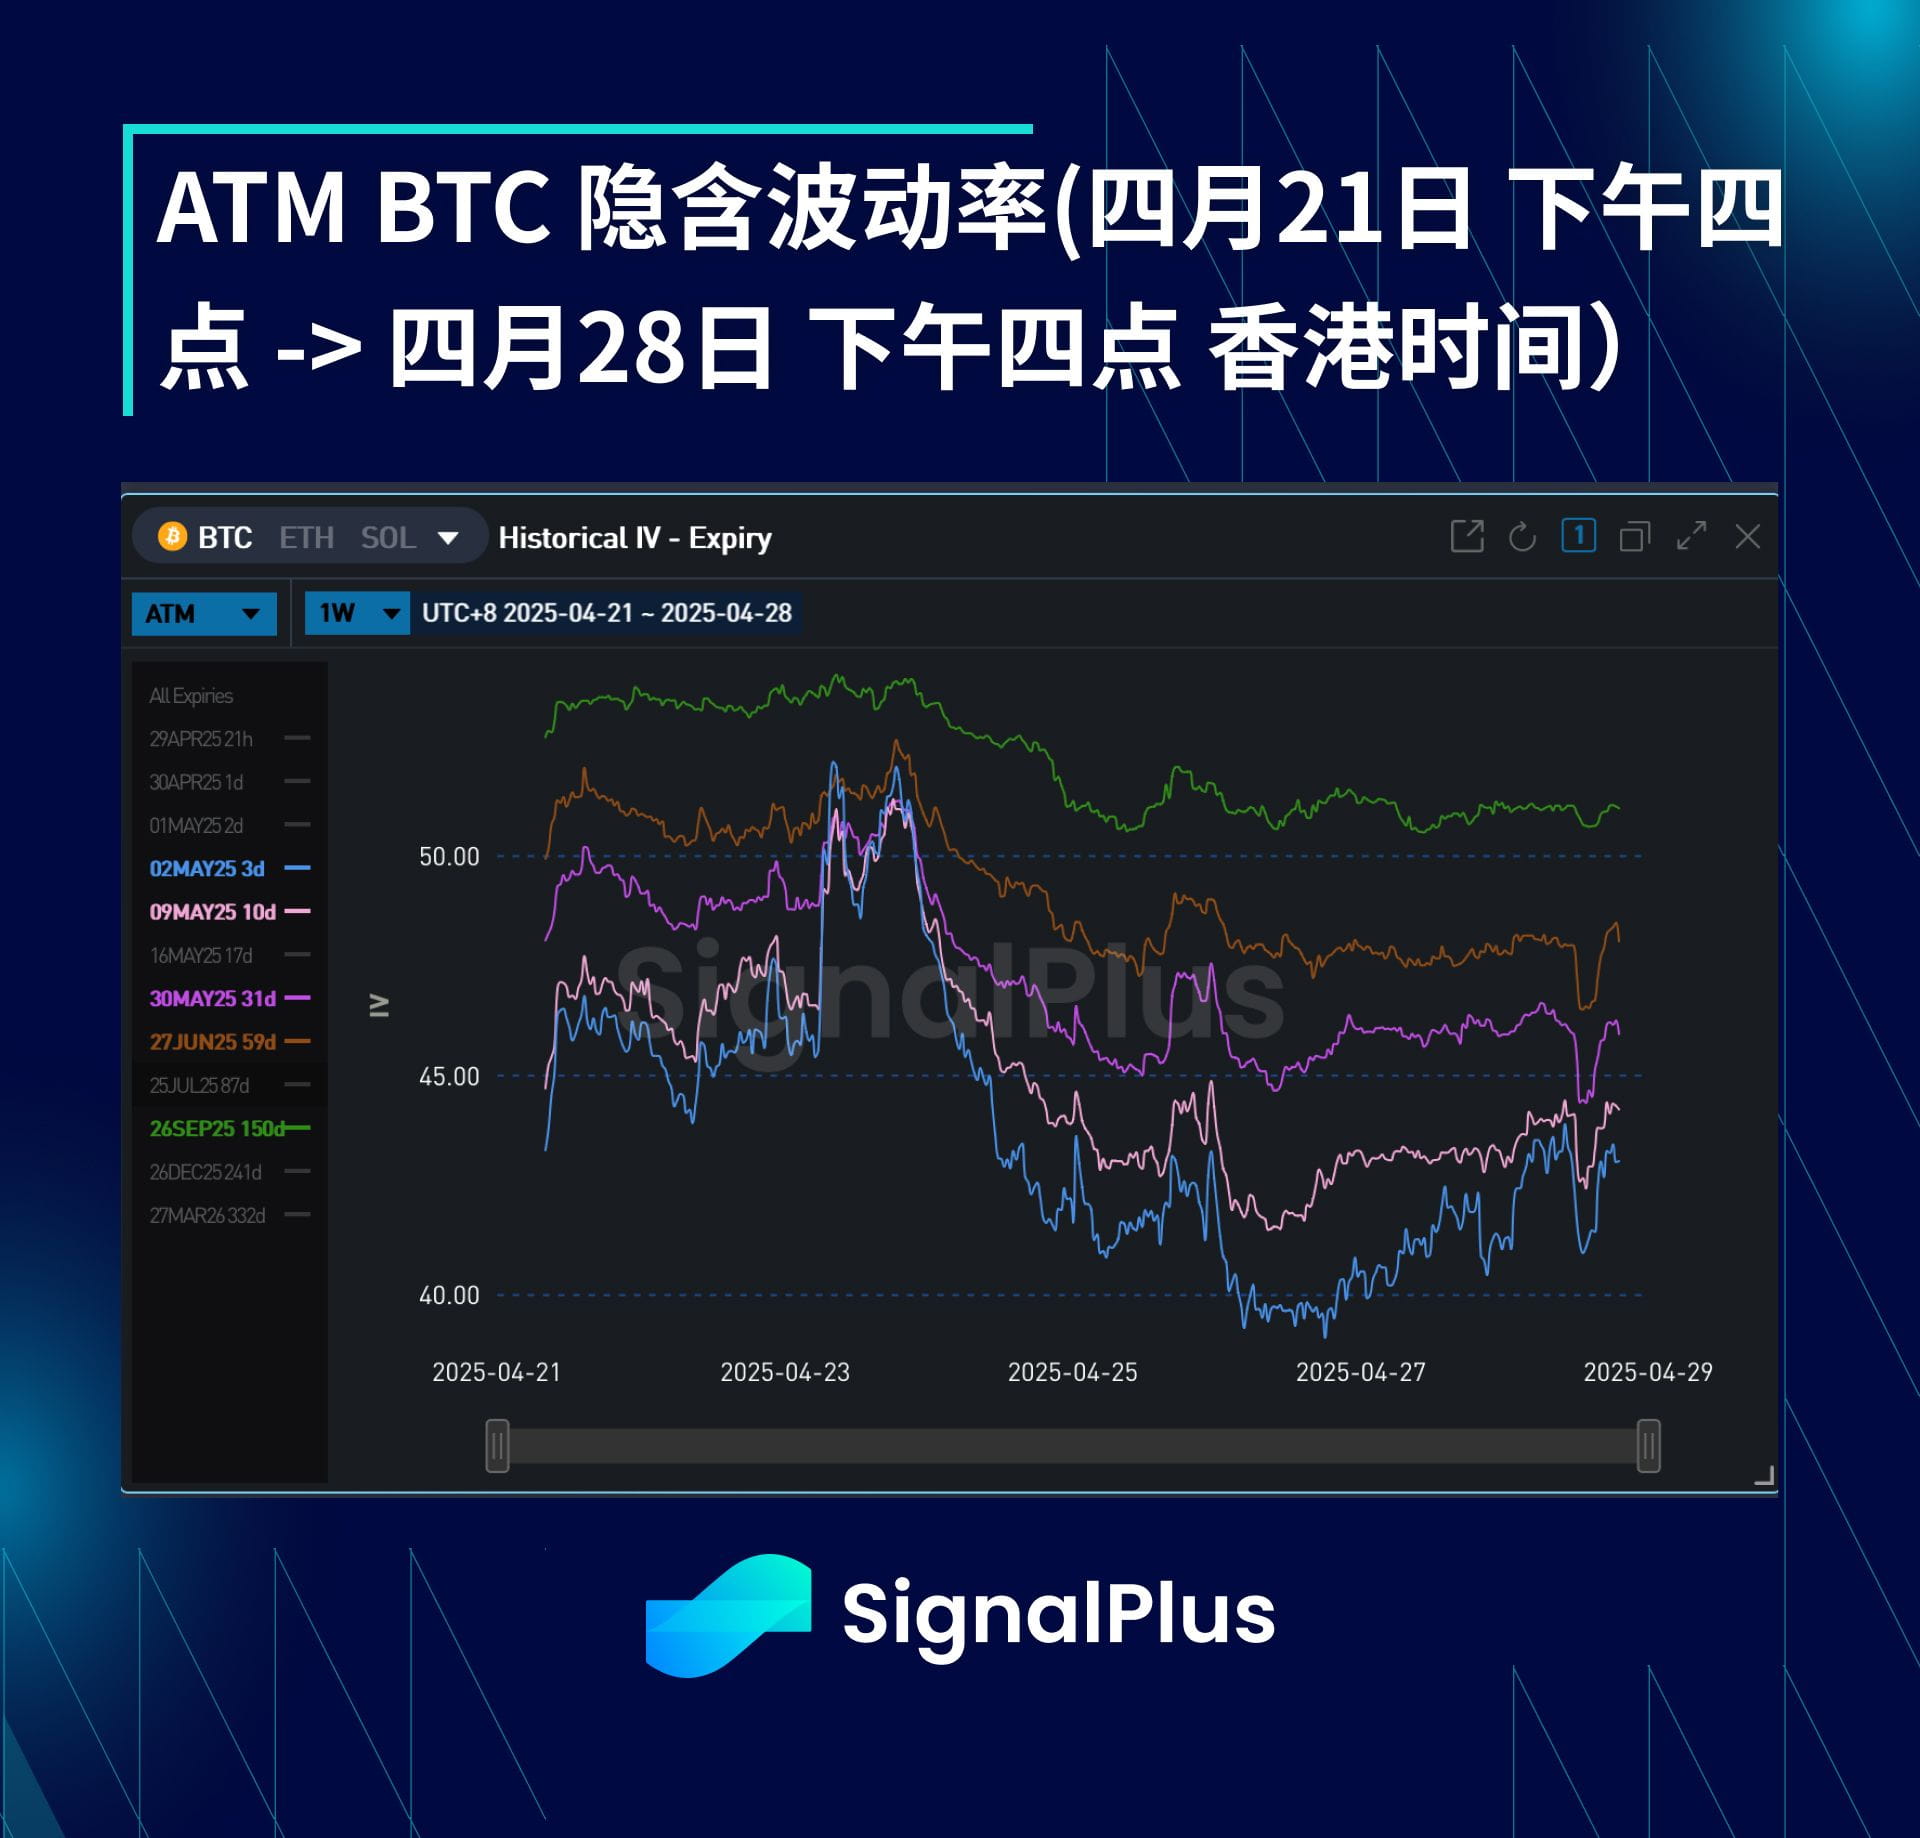
Despite last week's price breaking through 90,000 USD, implied volatility has been on a downward trend. This is because the market is accelerating the selling of both call and put options, especially coupled with a recovery in risk asset sentiment and the weakening correlation between Bitcoin and the S&P. On the other hand, the market expects to see a large number of sell orders before reaching 100,000 USD, thus willing to sell call options to hedge spot positions when prices are high. Meanwhile, actual volatility remains quite low; despite large fluctuations, price movements are very orderly, with high-frequency actual volatility averaging around 30 over the week.
The term structure remains very steep. The market is reluctant to price mid-term volatility lower. If the theory of Bitcoin as 'digital gold' holds true and breaks its correlation with the S&P, expectations for volatility should lean towards selling, as any pullback would trigger more buying. Currently, pricing for volatility rolling down 3-4 points within a month for the June expiration is still on the high side. We believe that in the absence of changes in market conditions, long-term volatility should continue to decline.
BTC Skew/Kurtosis

The skew for short-dated expirations tends to shift bullishly with each price increase, but it quickly reverts. This is mainly because actual volatility remains low when prices rise. The skew for longer-dated expirations has further reverted to normal levels over the past year, as the market is more confident that Bitcoin will not experience the same dramatic volatility spikes as in Q1, even if the S&P index or global stock prices decline.
Kurtosis has been mostly flat this week. Given the current price range of 92,000 to 99,000 USD, it is difficult for prices to rise due to low actual volatility. However, outside the 88,000 to 102,000 USD range, there is a possibility of a sharp increase in actual volatility considering both technical and psychological levels.
Wishing everyone successful trading this week!
