
Trend Structure & Key Technical Zones
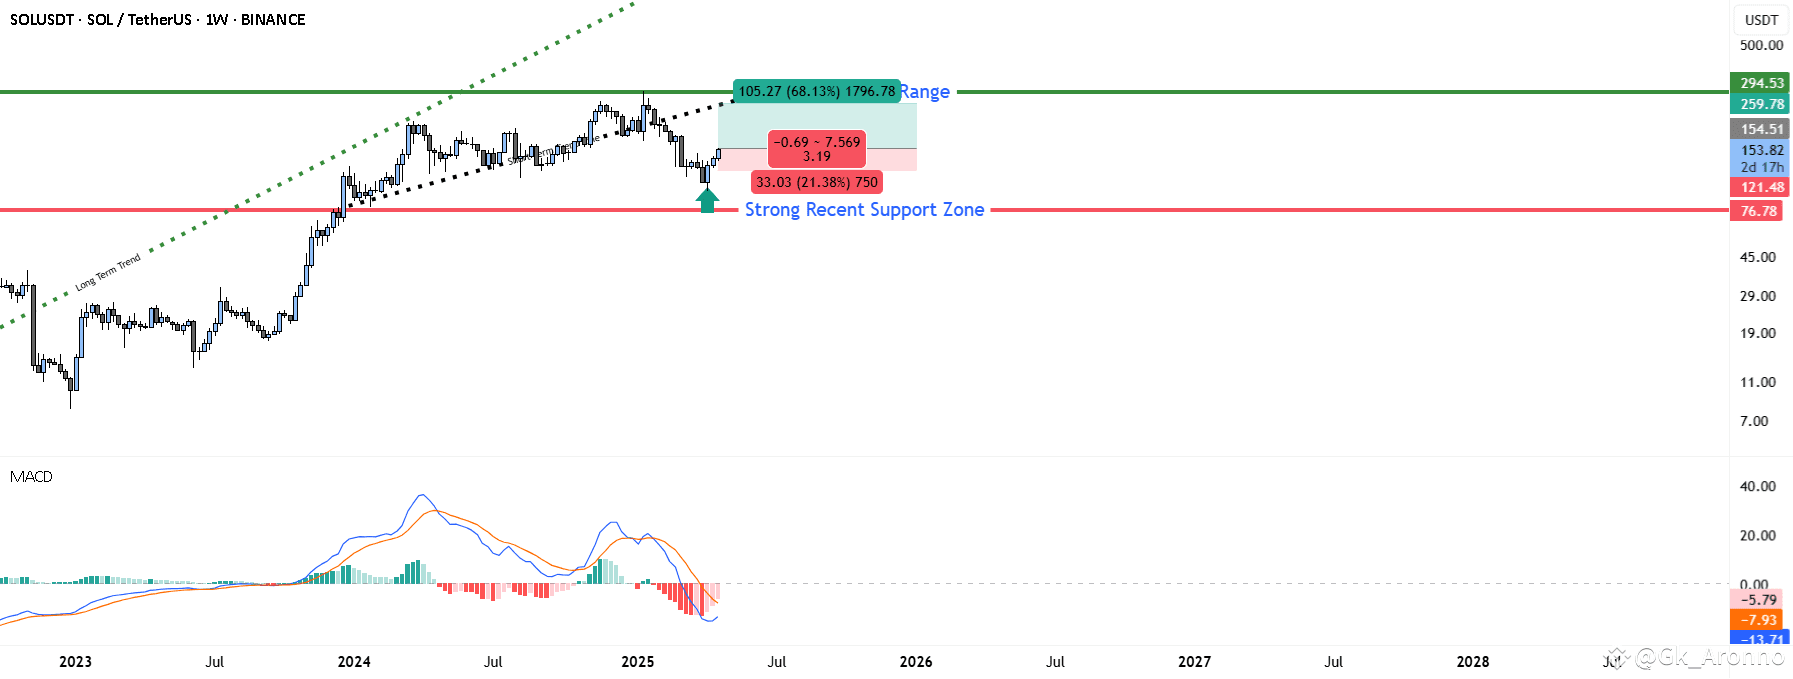
Solana (SOL) has been respecting a long-term uptrend line (green dotted) since its 2022 lows. This trendline served as a dynamic support throughout the bullish expansion in late 2023.
However, price action since Q1 2024 shifted into a broad sideways consolidation range, where SOL formed a well-defined horizontal range between $76.78 (support) and $294 (resistance).
Recently, SOL retested the lower bound of this range around $100, which aligns with a strong historical support zone, and bounced decisively, validating it once again. The bounce is marked with a green arrow in the image — signaling buyer dominance at this key structural area.
Range-Bound Market & Price Behavior
This chart clearly presents a multi-month horizontal consolidation where SOL has:
Rejected the $76.78 level multiple times (strong demand)
Struggled to break through the upper barrier at $294
Remained confined within this accumulation/distribution range, offering both trading and positional opportunities
The dotted black trendline within the range (slightly upward sloping) suggests a mild internal bullish bias, pointing to gradual accumulation from smart money.
MACD Indicator Analysis
Below the price chart, the MACD (Weekly) shows
Bullish crossover forming with the MACD line crossing above the signal line
Bearish momentum fading, as visible from the shrinking red histogram bars
A potential shift in medium-term trend direction, supporting the bullish bounce
This momentum shift aligns perfectly with the recent support zone rebound, increasing the probability of a move toward the top of the range.
Trade Idea (Position-Based)
The image outlines a position trade idea with a clear setup based on range-play strategy.
Entry Point: $154.51
Stop Loss: $121.48 (below key structure, protecting against breakdown)
Take Profit: $259.78
Risk-to-Reward Ratio: ~3.19
Potential Gain: +68.13%
Potential Risk: -21.38%
The trade aims to capture the move from mid-range to range-high, capitalizing on momentum reversal and strong technical confirmation from MACD and price structure.
Summary & Outlook
Long-term trend remains bullish, as evidenced by the major trendline and price structure.
Strong support at $76.78 continues to hold firm.
MACD confirms bullish reversal signs, supporting a possible rally toward the top of the range.
Risk is well-defined and positioned below structure.
Next resistance levels to watch: $259.78 and extended zone at $294.53 (top green line)
SOL shows a high-probability bounce from a strategic support zone, supported by momentum reversal and trend structure. Traders can look for range-to-range swing plays while longer-term investors may also monitor for breakout above $260+ for trend continuation.
