On 25/04/23, BTC broke through 94000, with a beautiful valley second probe rebound. Can it complete the shark pattern?
Bitcoin has rebounded for 3 consecutive days after dropping below and has already rebounded 20,000 points, a 27% increase. It is now below 95000, which is also the first pressure point for a pin rebound. Currently, the price is between 0.5—0.618. If it can break through decisively, there is potential to reach 100000—106000 to complete a shark pattern. If it cannot break through directly, it will likely retest 88000—89000, which still presents an opportunity to add positions.
The beautiful valley second probe rebound has seen the Nasdaq rebound 3.95%, the Dow Jones 2.55%, and the S&P 500 3%, indicating a strong rebound. The US stock market rebound is looking to see if it can break through the high point of the 10th. If it breaks through, there is a chance to complete a bat pattern and return to the upper formation; however, if it still cannot break through the previous high platform, it will continue to decline.
Bitcoin
Bitcoin's daily chart has shown an upward wave structure. After a correction, it remains to be seen if it can execute a 5-wave structure. In the short term, it faces pressure around 95000. Watch for support at 88000—89000 during a pullback. There is divergence on the 1-hour chart, but slight signs are present on the 4-hour chart.
The daily chart has broken through a descending wedge and returned to a converging triangle, re-establishing above MA120, which is also above multiple MAs, indicating relative strength. However, do not chase the rise; wait for a pullback. Whether it can reach a new high remains to be seen, but if it rebounds back to the previous high around 103000—106000, I will consider reducing positions.
Support: 89000—91500
Resistance: 95000—100000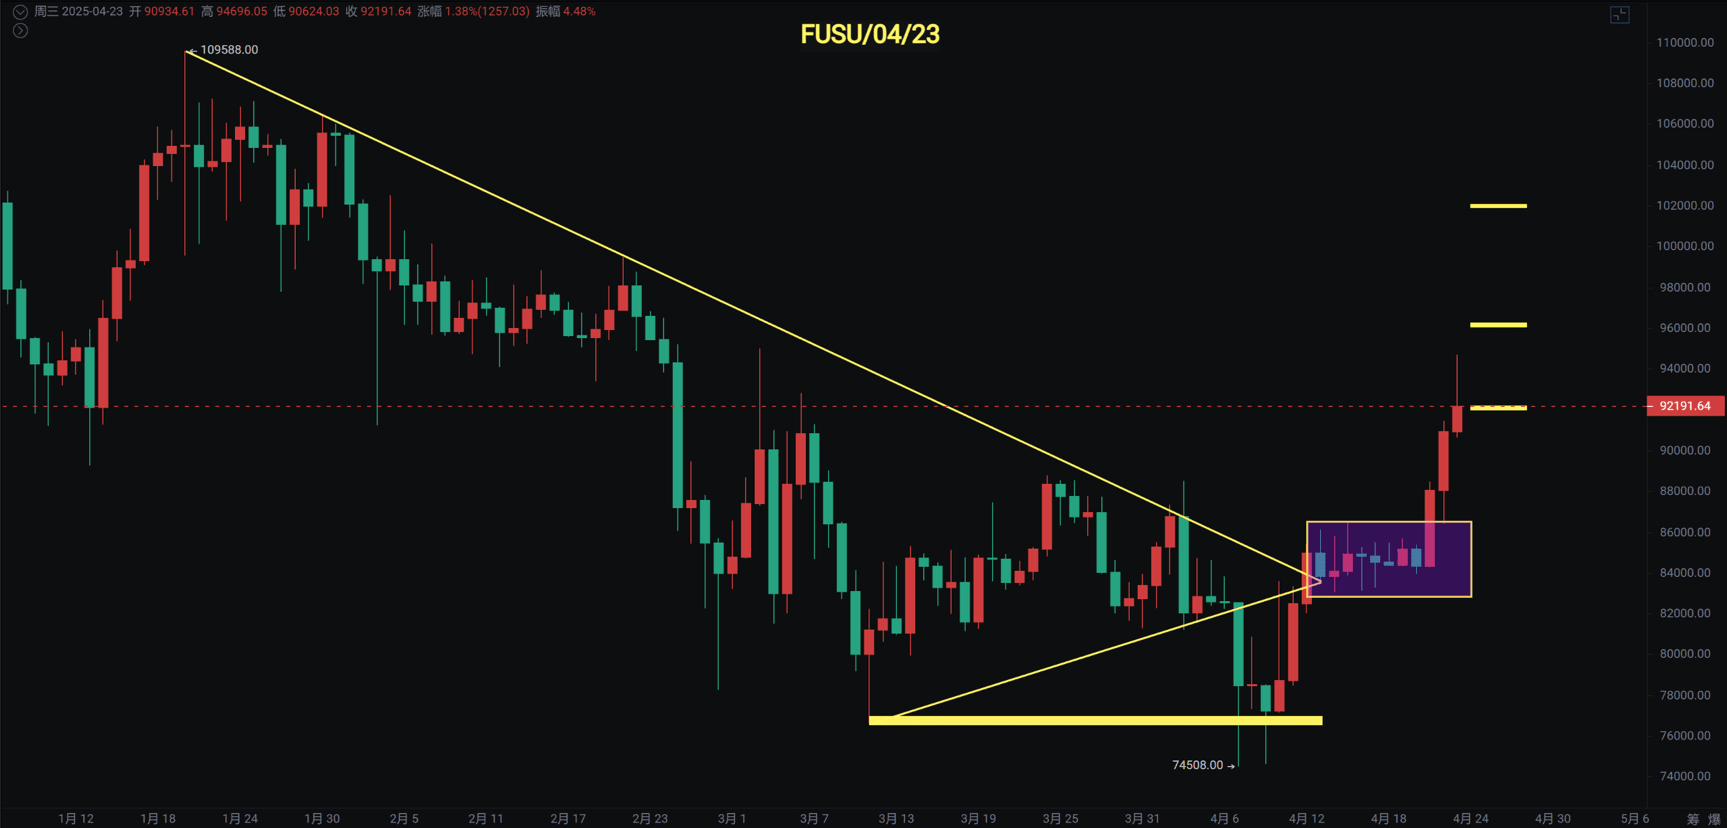
Ethereum
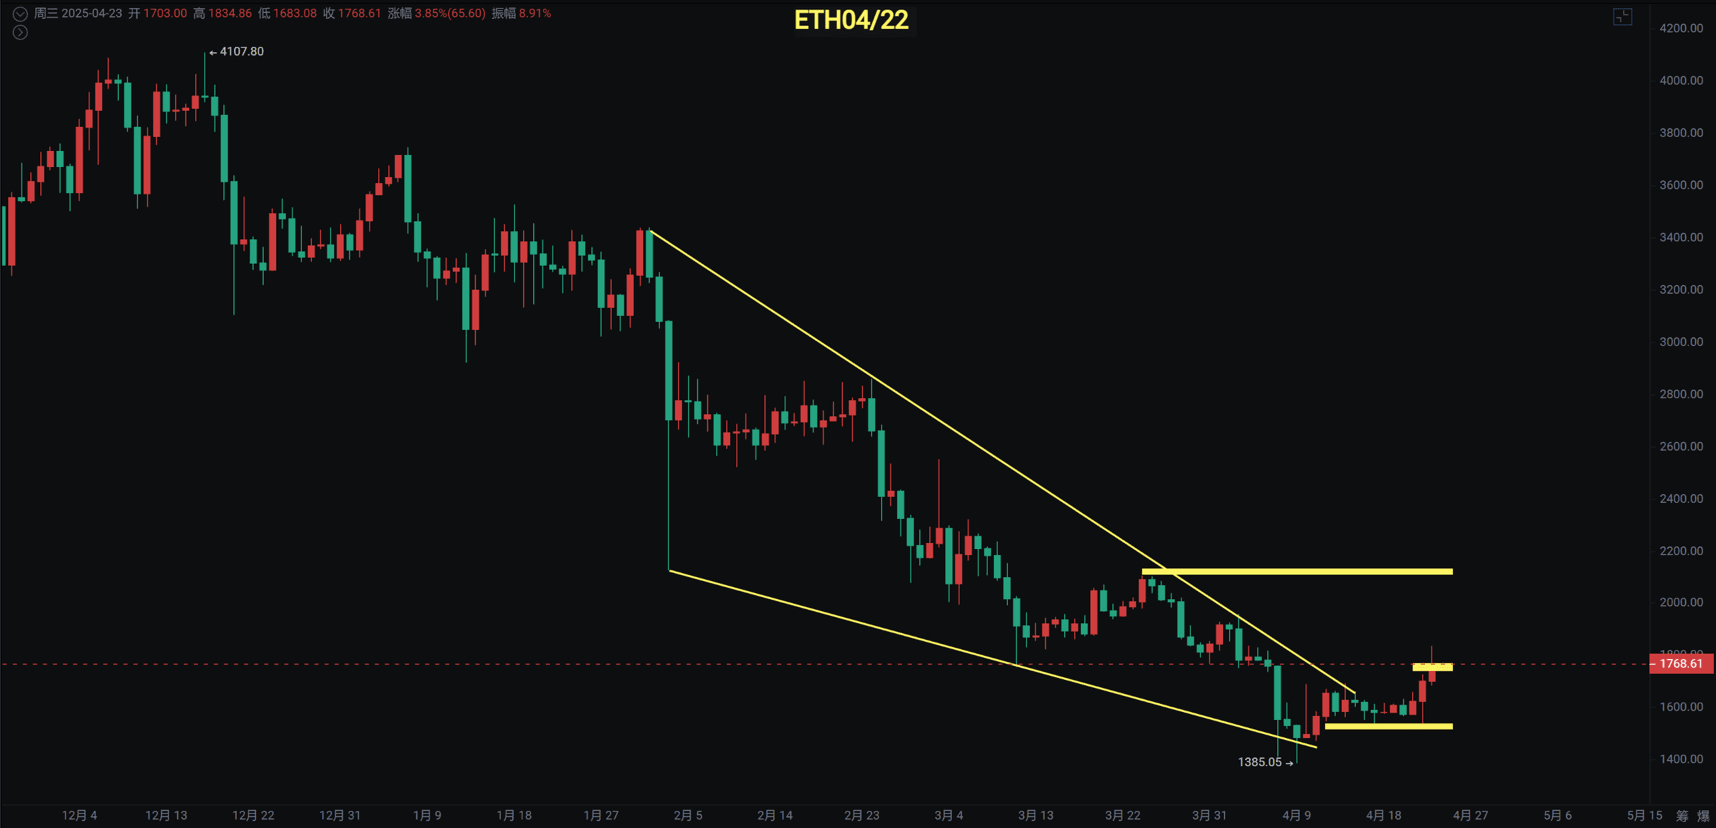
The daily chart broke through 1754, with a maximum pin reaching 1834, also breaking through the previous large bearish candle on the 7th. The daily descending wedge breakout has a chance to reach 2000—2100.
Only if it returns to 2100 without falling can it be considered relatively optimistic. Currently, it can only be viewed as a super-dip rebound. ETH/BTC is rebounding near historical lows, and it is temporarily uncertain whether the exchange rate has bottomed out.
Support: 1600—1690
Resistance: 1957—2100