 Based on the available data, here is the analysis of SUI/USDT movement:
### 1. Price & Trend
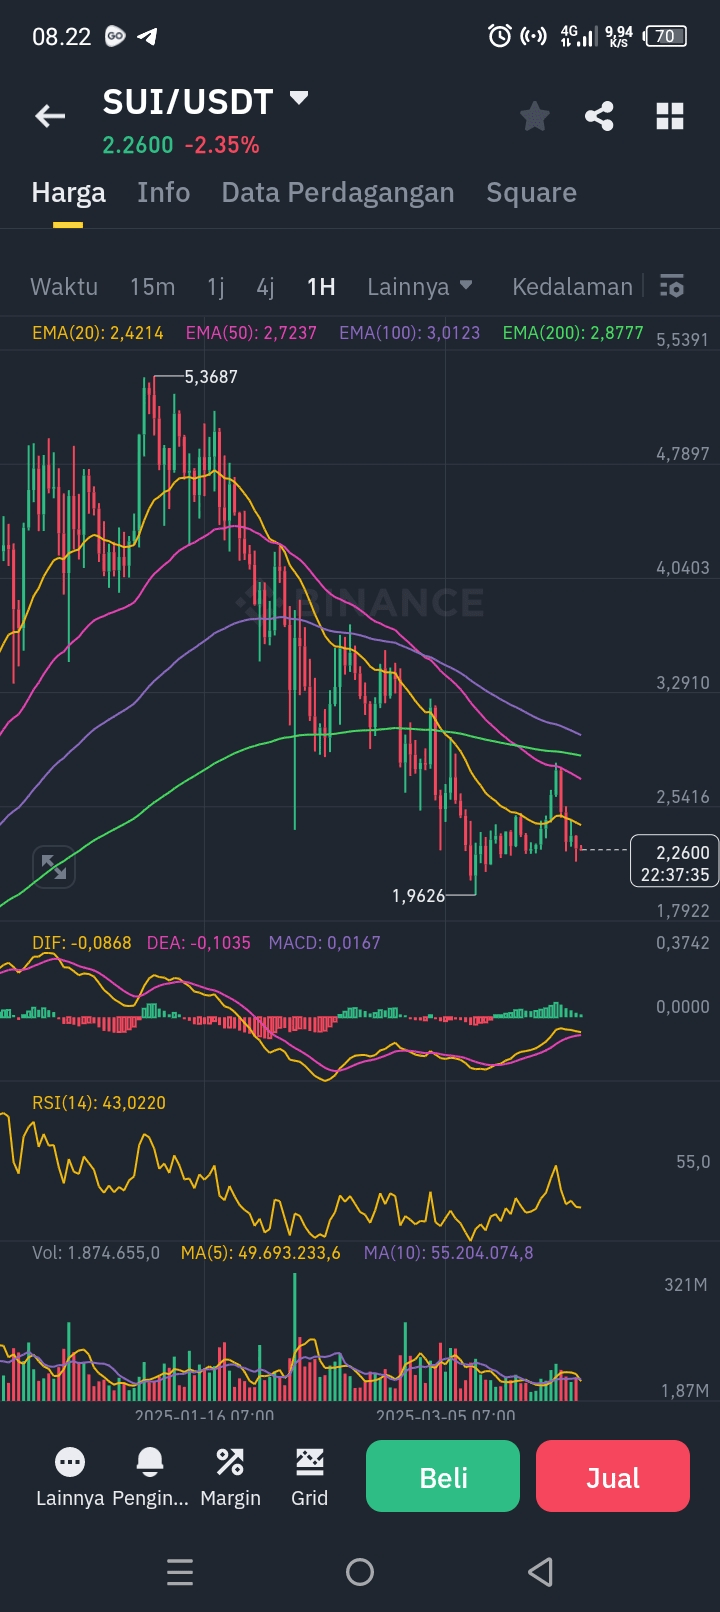
- Current price: 2.2600 (-2.35%), indicating a short-term decline.
- EMA (Exponential Moving Average):
- EMA 20 (2.4214) > EMA 50 (2.7237) > EMA 100 (3.0123): Indication of a medium-term bearish trend because the price is below all EMA levels.
- EMA 200 (2.8777) as strong resistance.
### 2. Technical Indicators
- MACD:
- DIF (0.0868) above DEA (-0.1035), but the MACD value (0.0167) is very small. Neutral signal, potential trend change if DIF crosses DEA upwards/downwards.
- RSI(14): 43.0220 (neutral, slightly weak). Not oversold or overbought, but approaching the weak area (<50).
### 3. Volume & Liquidity
- Trading volume: 1,874,655.0 (relatively low compared to MA5 and MA10 volume).
- MA Volume (5): 49.6M vs MA10: 55.2M → Trading activity has decreased, lack of buying interest.
### 4. SUI Token Unlock

- If there is a token unlock today, it usually causes:
- Temporary price decline due to increased supply in the market.
- High volatility, especially if buying volume is not enough to absorb the selling from the unlock.
### 5. Important Levels
- Support: 1.874 (previous low).
- Resistance: EMA 20 (2.4214) and EMA 200 (2.8777).
### Recommendations:
- Be cautious with token unlock: Potential short-term sell-off.
- Signal confirmation: Wait for MACD to be clearer (DIF > DEA with divergence) or RSI <30 (oversold) for buy entry.
- Risk Management: If the price fails to rebound from 2.2600, the risk is to drop to 1.874.
### Conclusion:
SUI is in a bearish trend with selling pressure from the EMA and potential token unlock. Monitor price reaction at the nearest support and volume for reversal confirmation.