A quick breakdown of the ZRO/USDT pair
Preliminary note: The information below is provided for educational purposes only and does not constitute financial advice. All trading decisions involve risks.
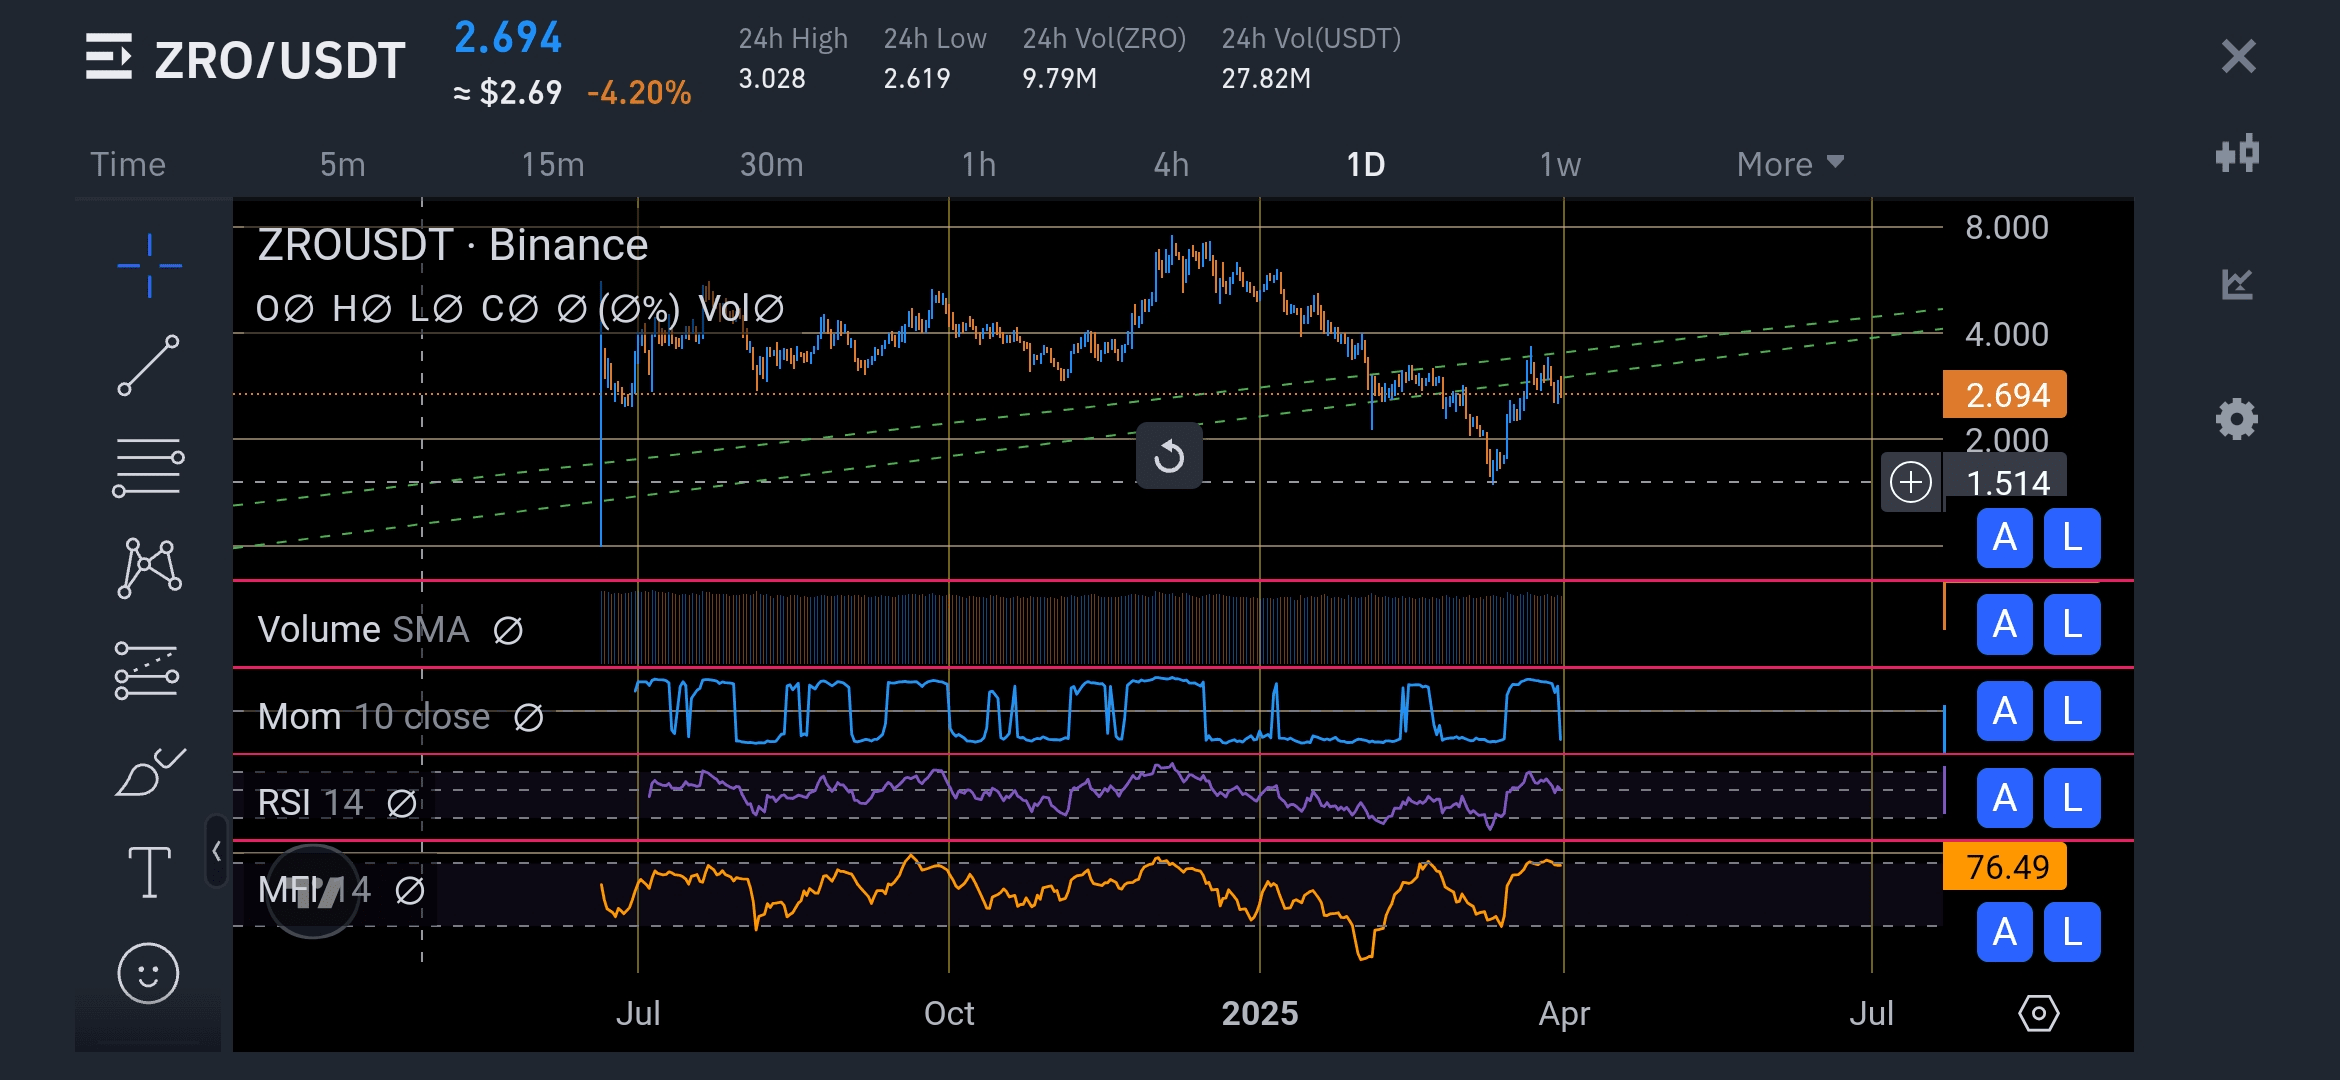
The asset (ZRO/USDT on Binance, according to the chart) is currently around 2.69 USDT.
We have observed an underlying bullish trend (ascending channel or ascending trendlines) since at least last summer (July), with several contact points on the lower and upper diagonal.
The price has experienced significant fluctuations, testing the 3.0-3.2 USDT area as resistance several times. Major support is also seen around 1.50-1.60 USDT.
--
The chart shows several important horizontal lines. Here is a possible interpretation of these levels:
1-Major support around 1.50 - 1.60 USDT
This is the lowest area on the visible chart, previously tested. If the market corrects sharply, this area could act as a long-term floor.
2-Intermediate zone towards 2.00 - 2.20 USDT
It does not appear explicitly on the chart, but we can guess a previous consolidation zone. In case of a correction from the current levels (2.69), this level could serve as support.
3-Support/resistance zone around 2.60 - 2.70 USDT
The price is oscillating precisely in this region, which makes it an important pivot: the clear crossing of 2.70 (with volume) could validate the continuation of the rise, while a rejection below 2.60 could restart a correction.
4-Upper resistances: 3.0 - 3.2 USDT, 4.0 USDT, then 5.0 USDT
Historically, round levels (3, 4, 5, etc.) often play a role of psychological resistance.
According to the chart, the 3.0-3.2 USDT area has already acted as resistance on several occasions. A clear breakout, supported by volume, would validate a new bullish leg in the medium to long term.
5-Potential higher price zone (6.0 - 8.0 USDT)
Visible on the chart as distant resistance lines. It can be assumed that if the market begins a solid uptrend (e.g., a general crypto market recovery), these targets would become relevant over a long-term horizon (several months).
---
Volume SMA
At the bottom of the graph we see volume bars (not detailed in the screenshot), with a moving average volume line (Volume SMA).
A notable increase in volumes upon crossing resistance (2.70 – 3.0 USDT) would be a confirmation signal of a bullish continuation.
Conversely, low volumes on a breakout could signal a false breakout.
Mom (Momentum)
The “Momentum” probably oscillates around 0 (midline).
When Momentum is positive and rising, it indicates bullish acceleration.
When it crosses below 0, it is a sign of a slowdown or potential trend reversal.
RSI 14 (Relative Strength Index)
From the image, the RSI appears to be hovering in a zone that is neither too high nor too low (probably around 50, maybe slightly below 50).
An RSI close to 70 indicates overbought, close to 30 indicates oversold.
If the RSI rises above 50 with conviction, this could confirm a bullish recovery.
If the RSI stops at around 60-70, watch out for a short-term correction.
MFI 14 (Money Flow Index)
The MFI indicator, similar to the RSI but integrating volumes, appears around 76.49 on the screenshot.
Above 70-80, the market is often considered to be in an “overbought” situation. This does not necessarily imply an immediate correction, but it does call for caution regarding large-scale entries.
A high MFI can signal an inflow of capital, but also a risk of short-term profit taking.
-- Long Term Trading Strategy --
To build a long-term strategy, several approaches can be combined:
Approche d’Accumulation Progressive (DCA – Dollar Cost Averaging)
Objective: to smooth out its entry price over the long term.
Implementation:
Rather than entering at a single price, we invest regularly (example: each month, or at each technical level).
This helps reduce the impact of volatility and avoid “timing” the market.
Entries on Retreats and Support Confirmation
Objective: take advantage of corrections to accumulate.
Target levels:
Around 2.20 - 2.30 USDT if price corrects, as this potentially corresponds to an intermediate support zone.
If the market surges above 3.0 USDT with large volumes, consider a “confirmation” entry (breakout).
Risk management:
Place a stop-loss (or mental) below a key support (e.g. 2.0 USDT or 1.5 USDT depending on risk tolerance and time horizon).
Breakout and Pullback Strategy
Breakout of the 3.0 – 3.2 USDT zone
Monitor a possible “pullback” after the break (return to test the former resistance which has become support).
If the volume is there and the indicators (RSI, Momentum) confirm an upward trend, this can be a good entry point for a continuation trade.
Price targets:
First 4.0 USDT, then 5.0 USDT, then potentially 6.0 USDT or higher depending on the dynamics of the overall crypto market.
Monitoring of Key Indicators
1. RSI :
Wait for it to rise sustainably above 50-55 to validate bullish momentum.
Monitor bullish or bearish divergences (if the price rises but the RSI falls, watch out for a loss of momentum).
2. MFI :
Too high an MFI (80+) may signal a short-term spike.
On an underlying upward trend, it can remain high for a long time, so observe it in conjunction with other indicators.
3. Volumes :
Increasing volumes on resistance breakouts (3.0 USDT) are a positive sign.
Breakouts without volume are often fakeouts.
--- Risk and Position Management ---
Capital Allocation
Avoid overweighting any single asset, even if it looks promising.
Never risk more than you can afford to lose.
Stop-Loss and/or Hedging
For a long-term investor, a wide stop-loss (below major support at 1.50 USDT, for example) can protect against an extreme decline.
Some people prefer not to set a tight stop-loss if they have a time horizon of several years and a strong conviction.
Partial Profit Taking
When a significant level is reached (e.g. 3.0 - 3.2 USDT, then 4.0 USDT), part of the gains can be secured to reduce exposure.
Let the balance run if the trend remains upward.
---
Summary of the Proposed Strategy
Accumulation :
implementation of a DCA plan + entries on withdrawals.
Surveillance :
Break and hold above 2.70 - 3.0 USDT (with volume) to target higher targets.
RSI/Momentum to confirm the strength of the trend.
Risk Management:
Do not overinvest, diversify, use wide or mental stops depending on the risk profile.
Consider the overall environment (macro, crypto market sentiment).
#ZROUSDT #ZROTrading #ZROUSDTBreakdown $ZRO