CONSTRUCTION AND DRAWING OF THE CANDLE STICK LINES :
Candlesticks are like the X-ray vision of a market. You can see what's happening under the surface, like changes in a market’s strength and direction and how emotions shape the trends.
Each candlestick represents price information in a specific unit of time, such as one trading day in a daily chart, one hour in an hourly chart, and so on. By changing the time frame on a chart, the candlesticks will also change accordingly. Let’s look into the components of candlesticks next to understand how they form and what they represent.
Candlestick Components
The four components of a candlestick are the open, close, high, and low prices for a specific time period. Let’s look at an example of a daily candle:
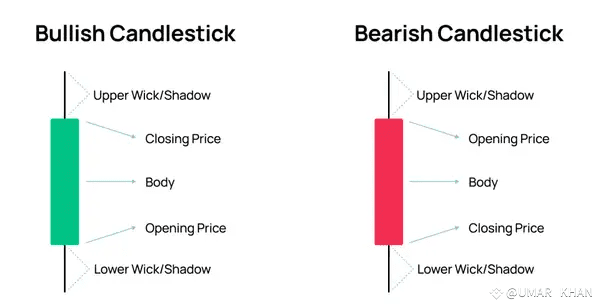
The Anatomy of a Candlestick
The open price is the first price at which the asset trades in one specific day.
The close price is the last price at which the asset trades in one specific day.
The high price is the highest price the asset reaches during the day.
The low price is the lowest price reached during the day.
The Candlestick Body
The area between the opening and closing prices is called the body. The color of a candlestick body indicates a bullish or bearish price movement. If the opening price is lower than the closing price, the body color is green. Conversely, if the opening price is lower than the closing price, the body color is red. Different platforms display different colors, but these are the most common.
The size of the candlestick body itself offers valuable information to traders. The longer the body, the more bullish or bearish the candlestick is. A very long red body indicates aggressive selling (fear), and a long green body indicates strong adoption (optimism) in a market.
Upper Shadow and Lower Shadow
Almost every candle has so-called shadows (or wicks). The thin line between the top of the body and the high of the trading period is called the upper shadow. And the line between the bottom of the body and the low is called the lower shadow.
The length and positioning of the shadows provide key indications of market behavior. When the upper shadow is relatively long, it suggests that prices were driven higher during the session but encountered selling pressure or profit-taking near the peak. This could signify potential resistance levels or bearish sentiment coming into play. Conversely, a short upper shadow may imply that buyers remained dominant throughout the session, indicating a strong bullish sentiment.
That’s all regarding the anatomy of candlesticks. Understanding how candlesticks form and what information they hold is essential in mastering candlestick patterns. Now that we covered this part, let’s continue exploring the most common bullish and bearish patterns.