
Key Takeaways
BTC slides to $103,869, registering a 24h decline of nearly 4%
Liquidations in the derivatives markets exacerbate the downside pressure
However, BTC dominance remains high at 60.1% as altcoins fall even further
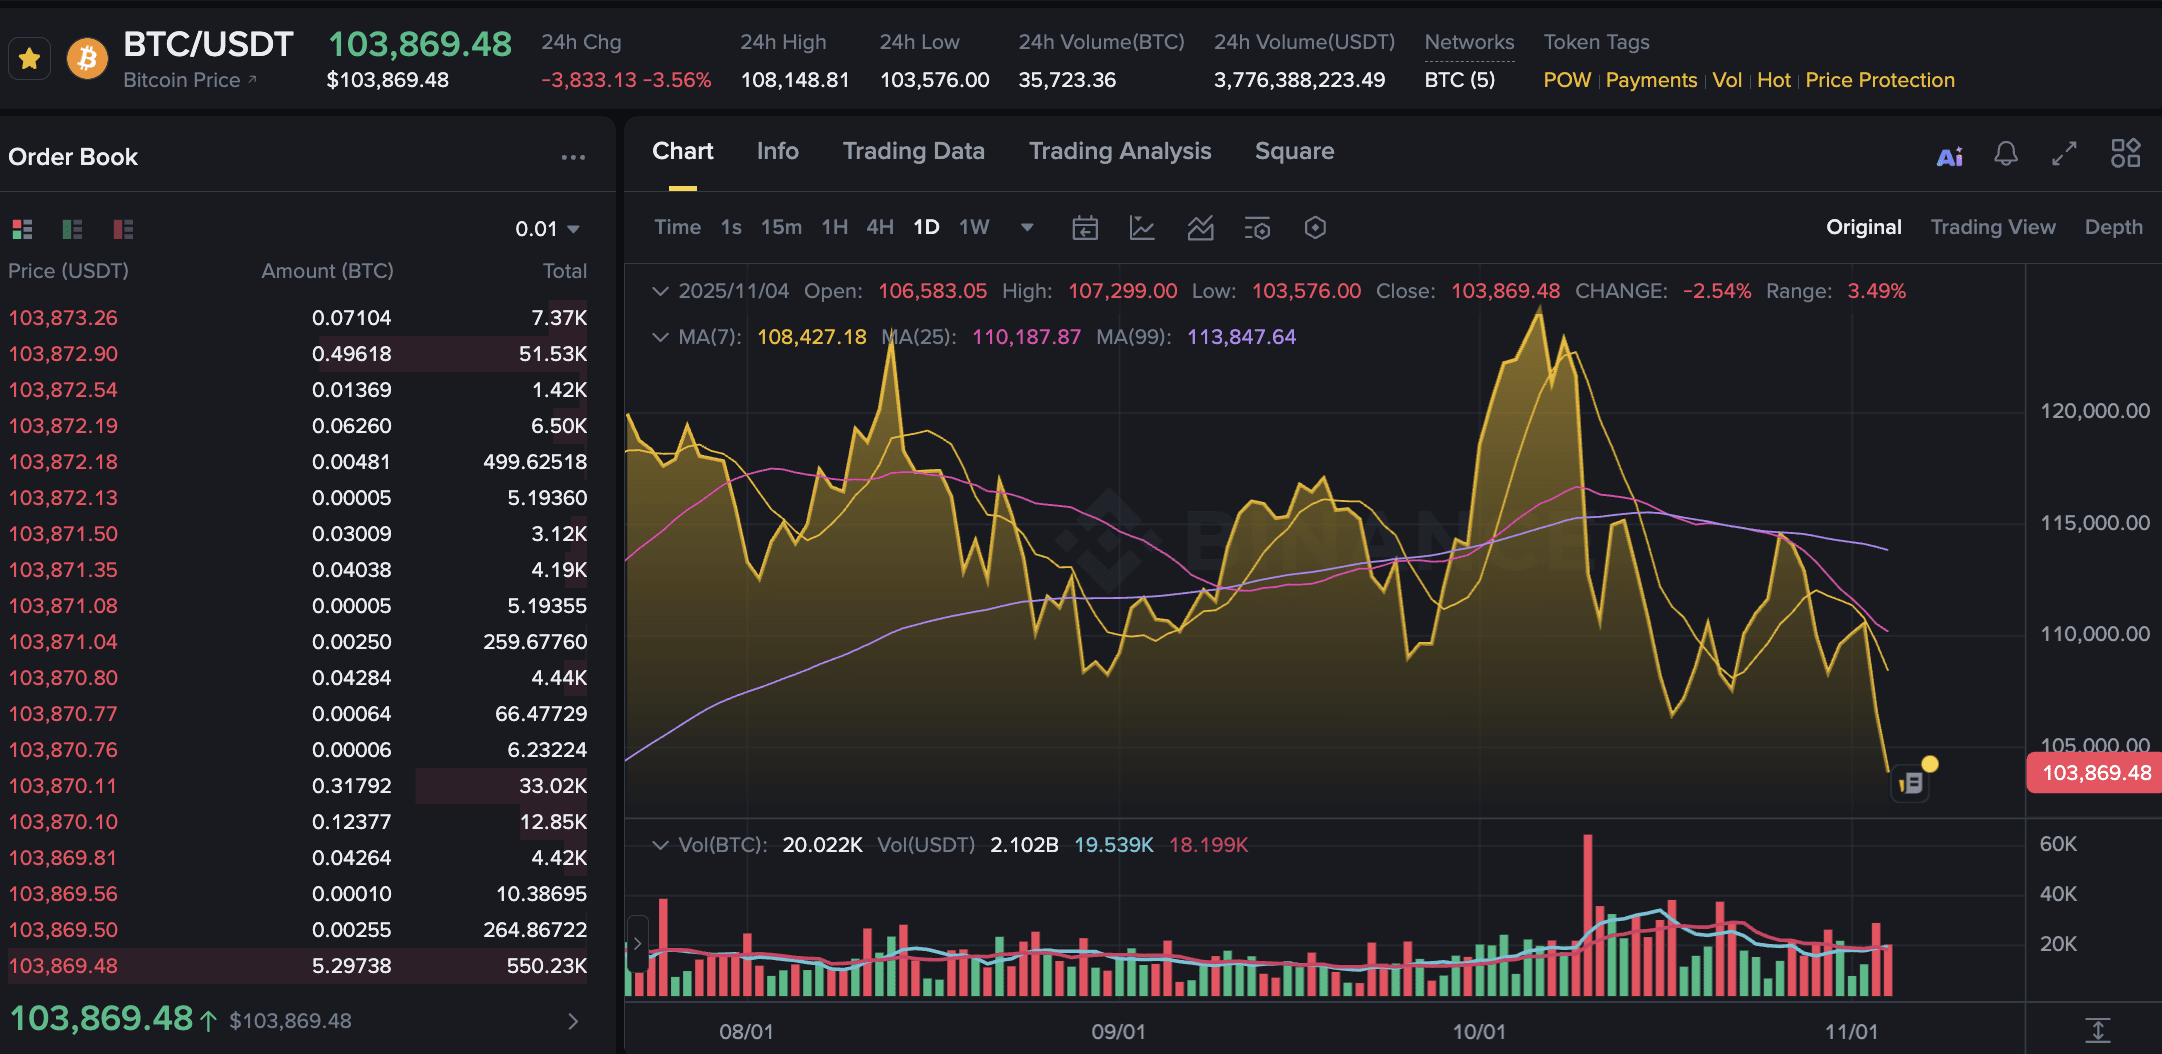
Bitcoin (BTC) is under heavy pressure this week, with its price sliding to $103,849, marking a 3.2% decline in 24 hours and extending its fall to 17.5% from the record highs reached in early October.
The broader cryptocurrency market has followed suit, losing over $1.3 billion in liquidations during the past day as macro headwinds, technical breakdowns, and derivatives market stress weigh on sentiment.
Federal Reserve’s Cautious Tone Sparks Market Risk-Off
The latest downturn began after the Federal Reserve’s recent rate cut failed to inspire risk appetite. Despite easing by 25 basis points, Chair Jerome Powell’s comments suggested that further cuts in 2025 may be paused, prompting investors to scale back expectations of near-term monetary support.
This hawkish undertone hit crypto ETFs hard, triggering $800 million in outflows last week—the largest since March—and pushing institutional demand for Bitcoin below its daily mined supply for the first time in seven months.
The impact has been stark across markets: the Fear & Greed Index plunged to 27, its lowest reading since March 2025, signaling low confidence and rising risk aversion across digital assets.
Technical Breakdown: Key Levels Under Pressure
From a technical standpoint, Bitcoin is currently battling to hold above the $103,500–$100,000 support zone, following a decisive break below its 30-day simple moving average (SMA).
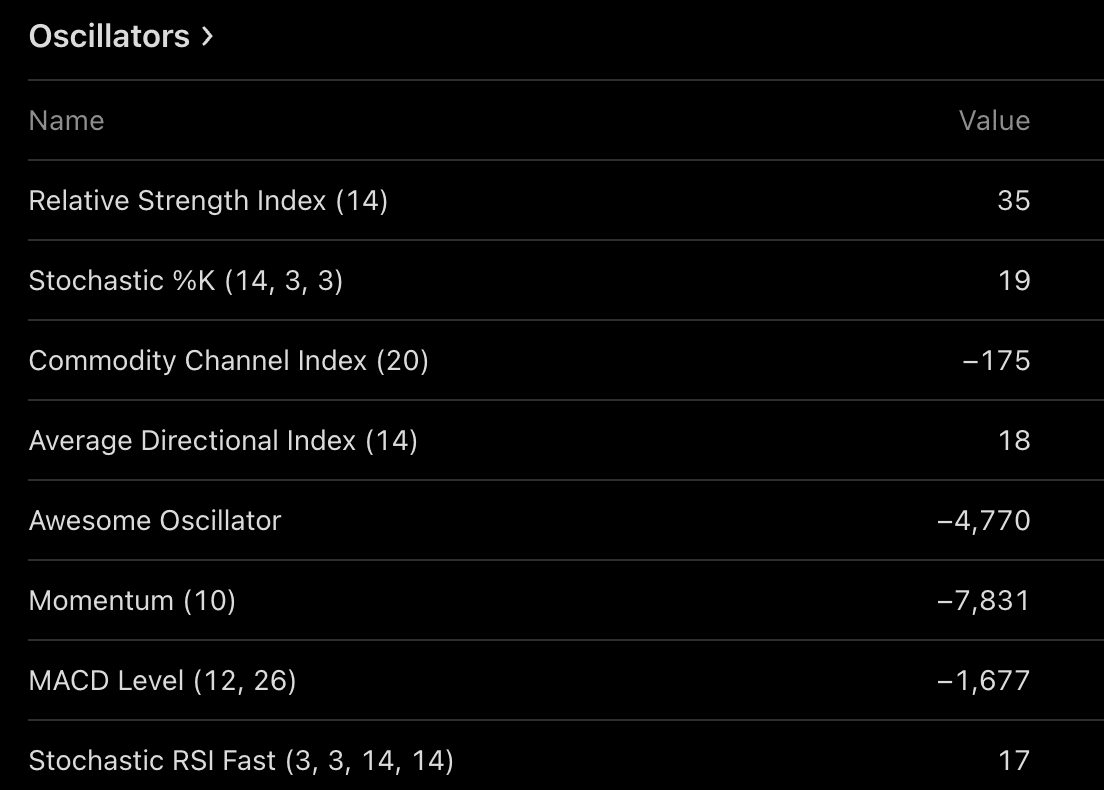
The latest technical indicators show a market struggling to regain bullish momentum:
Relative Strength Index (RSI 14): 35, near oversold territory, indicating fading short-term strength.
Momentum (10): –7,831, confirms a weakening drive from buyers.
MACD Level (12, 26): –1,677, reflects a persistent negative momentum shift.
On the moving average side, short-term averages have fallen below key thresholds, hinting at sustained downside pressure:
Exponential Moving Average (10): 108,766
Simple Moving Average (10): 110,043
Exponential Moving Average (50): 112,143
Simple Moving Average (50): 113,429
Exponential Moving Average (200): 108,351
Simple Moving Average (200): 109,966
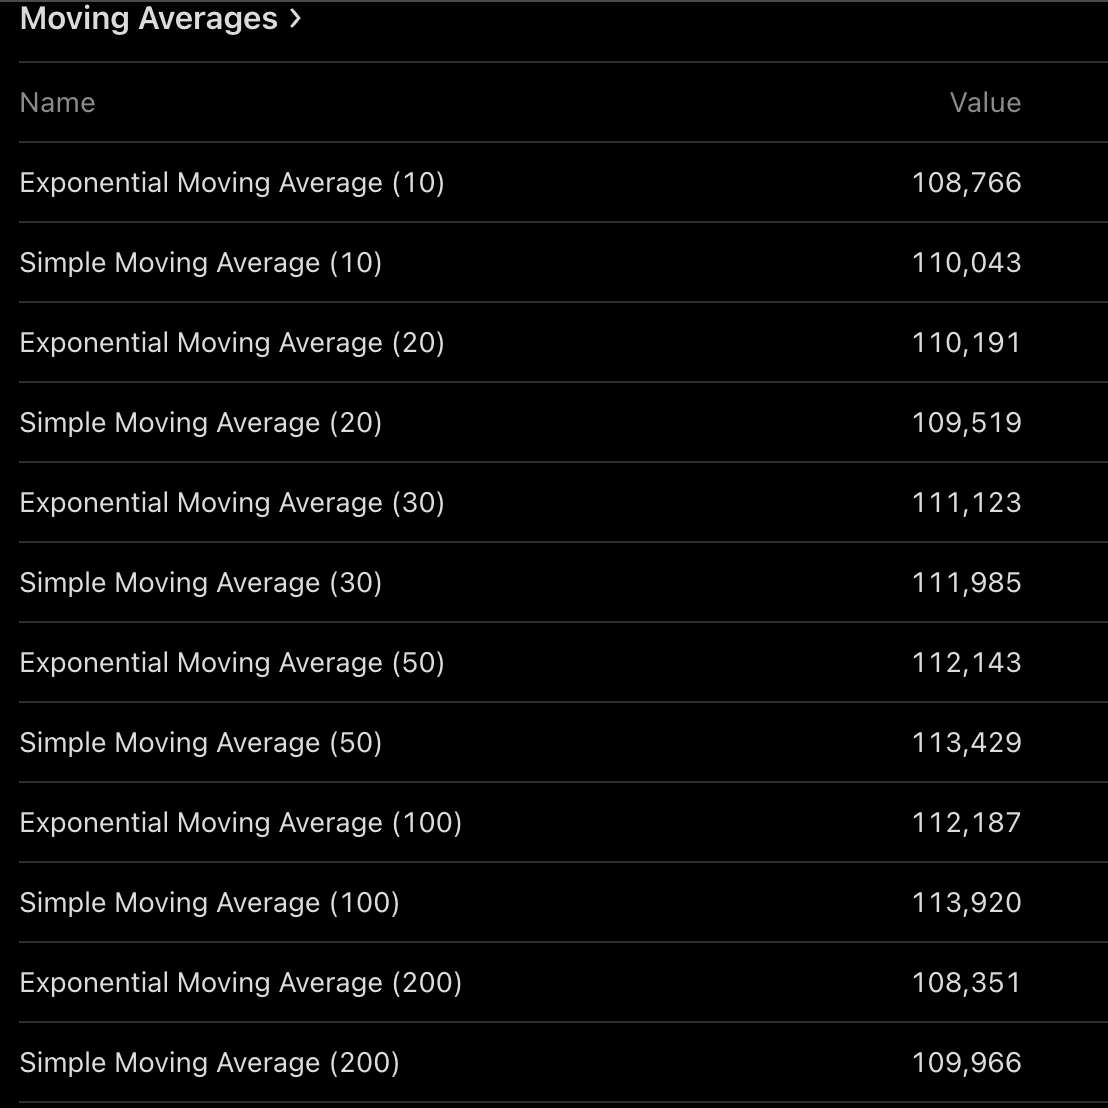
With the price now trading below all major EMAs and SMAs, the market appears entrenched in a technical correction phase.
Derivatives Liquidations Deepen the Drop
The derivatives market has amplified the sell-off, with over $1 billion in leveraged long positions liquidated in just 24 hours. Open interest across major exchanges fell 8.4%, signaling a broad deleveraging cycle. Meanwhile, funding rates turned negative (–0.0036% for top altcoins vs. BTC), reinforcing a bearish sentiment among traders.
Trading volume in derivatives soared to $1.95 trillion, up 142% in a day, as market participants rushed to unwind leveraged positions. This spike in volatility has further pressured Bitcoin and high-beta altcoins, with Ethereum, Solana, XRP, and BNB each dropping between 5% and 9% over the same period.
Bitcoin Dominance Still High: Impact on Altcoins
Bitcoin dominance has surged as investors rotate out of altcoins, mirroring patterns seen in late 2019. Analysts say this rotation typically continues until liquidity conditions improve.
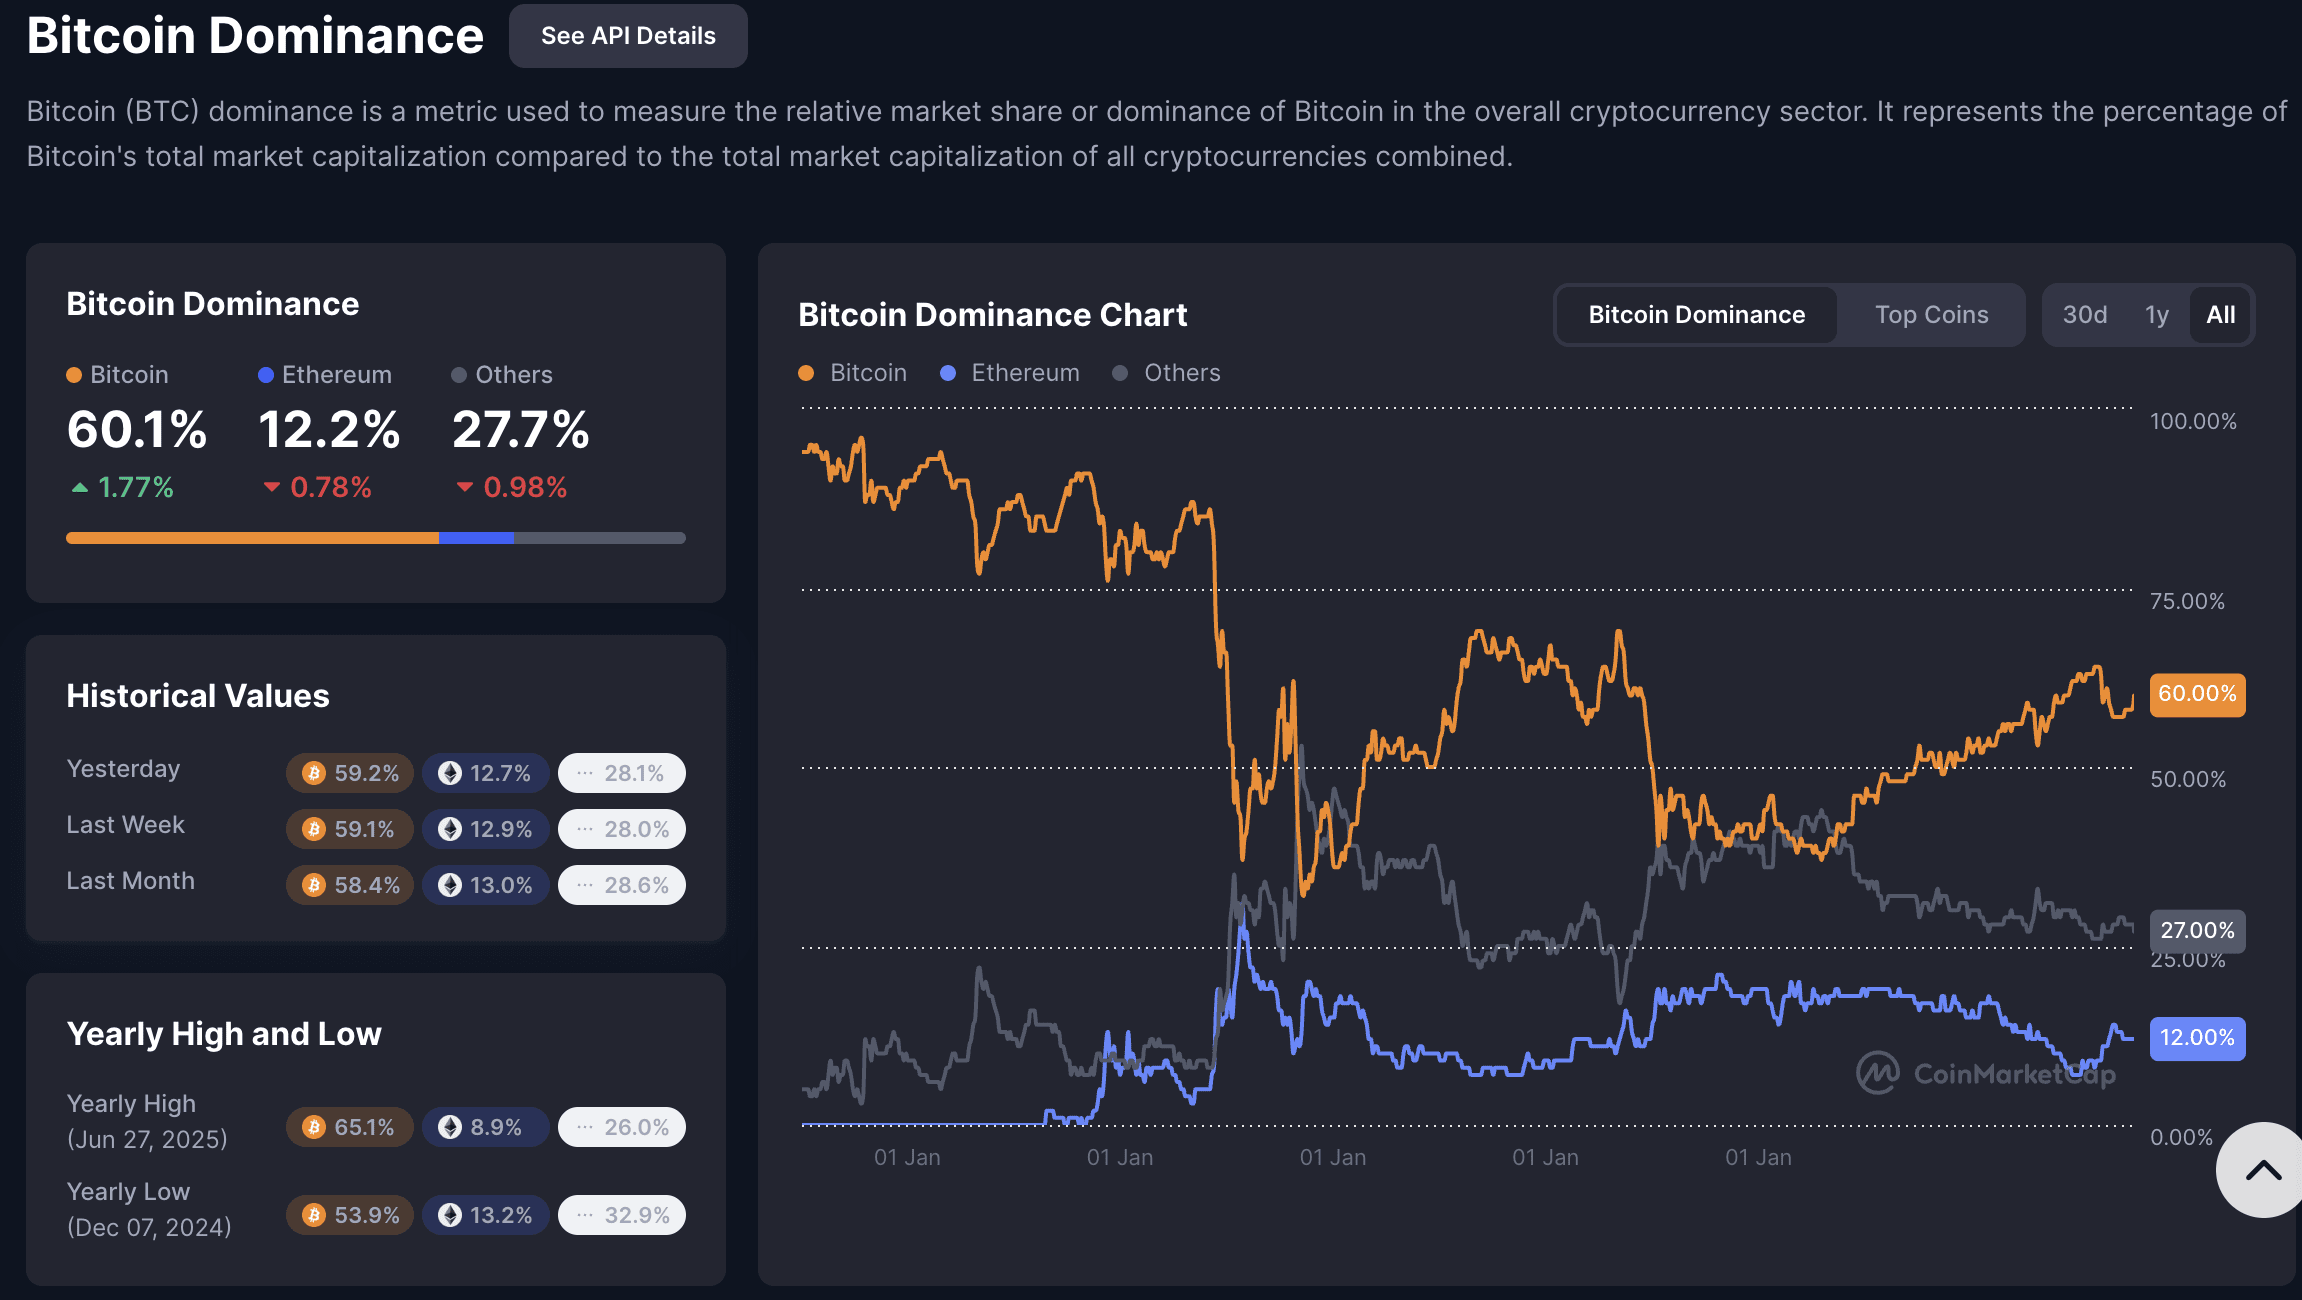
If Bitcoin dominance falls back below 60.5%, altcoins like Ethereum and Solana may start to recover. Until then, their high volatility and thin order books make them more susceptible to sharp downward moves.
Bitcoin Outlook: What are the Levels to Watch?
With the RSI at 35 and momentum indicators deep in negative territory, short-term relief rallies are possible—but the macro backdrop remains challenging. For sustained recovery, analysts are watching for:
A rebound above $108,800, which could indicate renewed bullish confidence.
Stabilization above $103,500, confirming that the local bottom is intact.
Improved ETF inflows and liquidity metrics could also signal a return of institutional participation.


