

Bit _Tycoon 786
15.1k Posts

Bit _Tycoon 786
 Square Verified+
Report
Block User
Building wealth, one sat at a time | Sharing my crypto journey...
Open Trade
Frequent Trader
1.3 Years
19 Following
39.3K+ Followers
38.5K+ Liked
Posts
Portfolio
All
Quotes
Live
·
--
Bullish
🚨 HISTORY'S BIGGEST CRYPTO THEFT! $6.36 BILLION GONE IN JUST 20 MINUTES!
North Korean hackers linked to TraderTraitor, associated with the Lazarus Group, reportedly drained Binance across 10 blockchains.
Reported losses:
- ETH: $3.79B
- BTC: $1.47B
- TRON: $628M
- XRP Ledger: $296M
The attack was reportedly linked to a compromised engineer's laptop and 50 signed authorizations on Ethereum.
Even more shocking: access reportedly remained active for nearly 4 hours!
Binance says SAFU funds and company reserves will cover losses. Around $3B has reportedly been frozen, but billions remain at risk.
This is nearly 4x the $1.5B Bybit hack!
Crypto security just faced a historic test.
Source: TRM Labs, Binance
$BTC
{spot}(BTCUSDT)
$ETH
{spot}(ETHUSDT)
$HYPE
{spot}(HYPEUSDT)
🚨 HISTORY'S BIGGEST CRYPTO THEFT! $6.36 BILLION GONE IN JUST 20 MINUTES!
North Korean hackers linked to TraderTraitor, associated with the Lazarus Group, reportedly drained Binance across 10 blockchains.
Reported losses:
- ETH: $3.79B
- BTC: $1.47B
- TRON: $628M
- XRP Ledger: $296M
The attack was reportedly linked to a compromised engineer's laptop and 50 signed authorizations on Ethereum.
Even more shocking: access reportedly remained active for nearly 4 hours!
Binance says SAFU funds and company reserves will cover losses. Around $3B has reportedly been frozen, but billions remain at risk.
This is nearly 4x the $1.5B Bybit hack!
Crypto security just faced a historic test.
Source: TRM Labs, Binance
$BTC
$ETH
$HYPE


97
·
--
Bullish
🚨 $HYPE IS FIGHTING BACK! BUYERS ARE STEPPING IN!
Hyperliquid is showing signs of a strong recovery after falling to $88.58. The price has climbed back to $92.59, gaining 6.22% in 24 hours.
Here’s what makes this move interesting:
📊 HYPE MARKET UPDATE
- Current Price: $92.59
- 24H Gain: +6.22%
- 24H High: $97.74
- 24H Low: $86.98
- 24H Trading Volume: $186.49M
- HYPE Volume: 2.03M
- Price in PKR: Rs25,613.17
KEY LEVELS TO WATCH
- $94.17 – First major resistance
- $97.74 – 24H high and breakout level
- $92.15 – Immediate support zone
- $90.14 – Important support
- $88.58 – Recent swing low
WHAT'S NEXT?
HYPE has recovered from its recent low and is now trying to hold above the $92 zone.
If buyers push through $94.17 with strong volume, the next important test will be $97.74. A clean breakout above that level could strengthen bullish momentum.
However, losing $92.15 could bring sellers back into control, with $90.14 and $88.58 worth watching.
The recovery looks promising, but confirmation is still needed.
$HYPE is heating up again. Watch the resistance levels closely because the next move could set the tone for the short-term trend!
{spot}(HYPEUSDT)
#KOSPIFalls3.53%BackBelow6000 #USMidtermElections #BinanceWillListPredictPREDICT #TwoAddressesHoldingAbout1.28BUSDTFrozen
#HYPE
🚨 $HYPE IS FIGHTING BACK! BUYERS ARE STEPPING IN!
Hyperliquid is showing signs of a strong recovery after falling to $88.58. The price has climbed back to $92.59, gaining 6.22% in 24 hours.
Here’s what makes this move interesting:
📊 HYPE MARKET UPDATE
- Current Price: $92.59
- 24H Gain: +6.22%
- 24H High: $97.74
- 24H Low: $86.98
- 24H Trading Volume: $186.49M
- HYPE Volume: 2.03M
- Price in PKR: Rs25,613.17
KEY LEVELS TO WATCH
- $94.17 – First major resistance
- $97.74 – 24H high and breakout level
- $92.15 – Immediate support zone
- $90.14 – Important support
- $88.58 – Recent swing low
WHAT'S NEXT?
HYPE has recovered from its recent low and is now trying to hold above the $92 zone.
If buyers push through $94.17 with strong volume, the next important test will be $97.74. A clean breakout above that level could strengthen bullish momentum.
However, losing $92.15 could bring sellers back into control, with $90.14 and $88.58 worth watching.
The recovery looks promising, but confirmation is still needed.
$HYPE is heating up again. Watch the resistance levels closely because the next move could set the tone for the short-term trend!
#KOSPIFalls3.53%BackBelow6000 #USMidtermElections #BinanceWillListPredictPREDICT #TwoAddressesHoldingAbout1.28BUSDTFrozen
#HYPE


1
53
·
--
Bullish
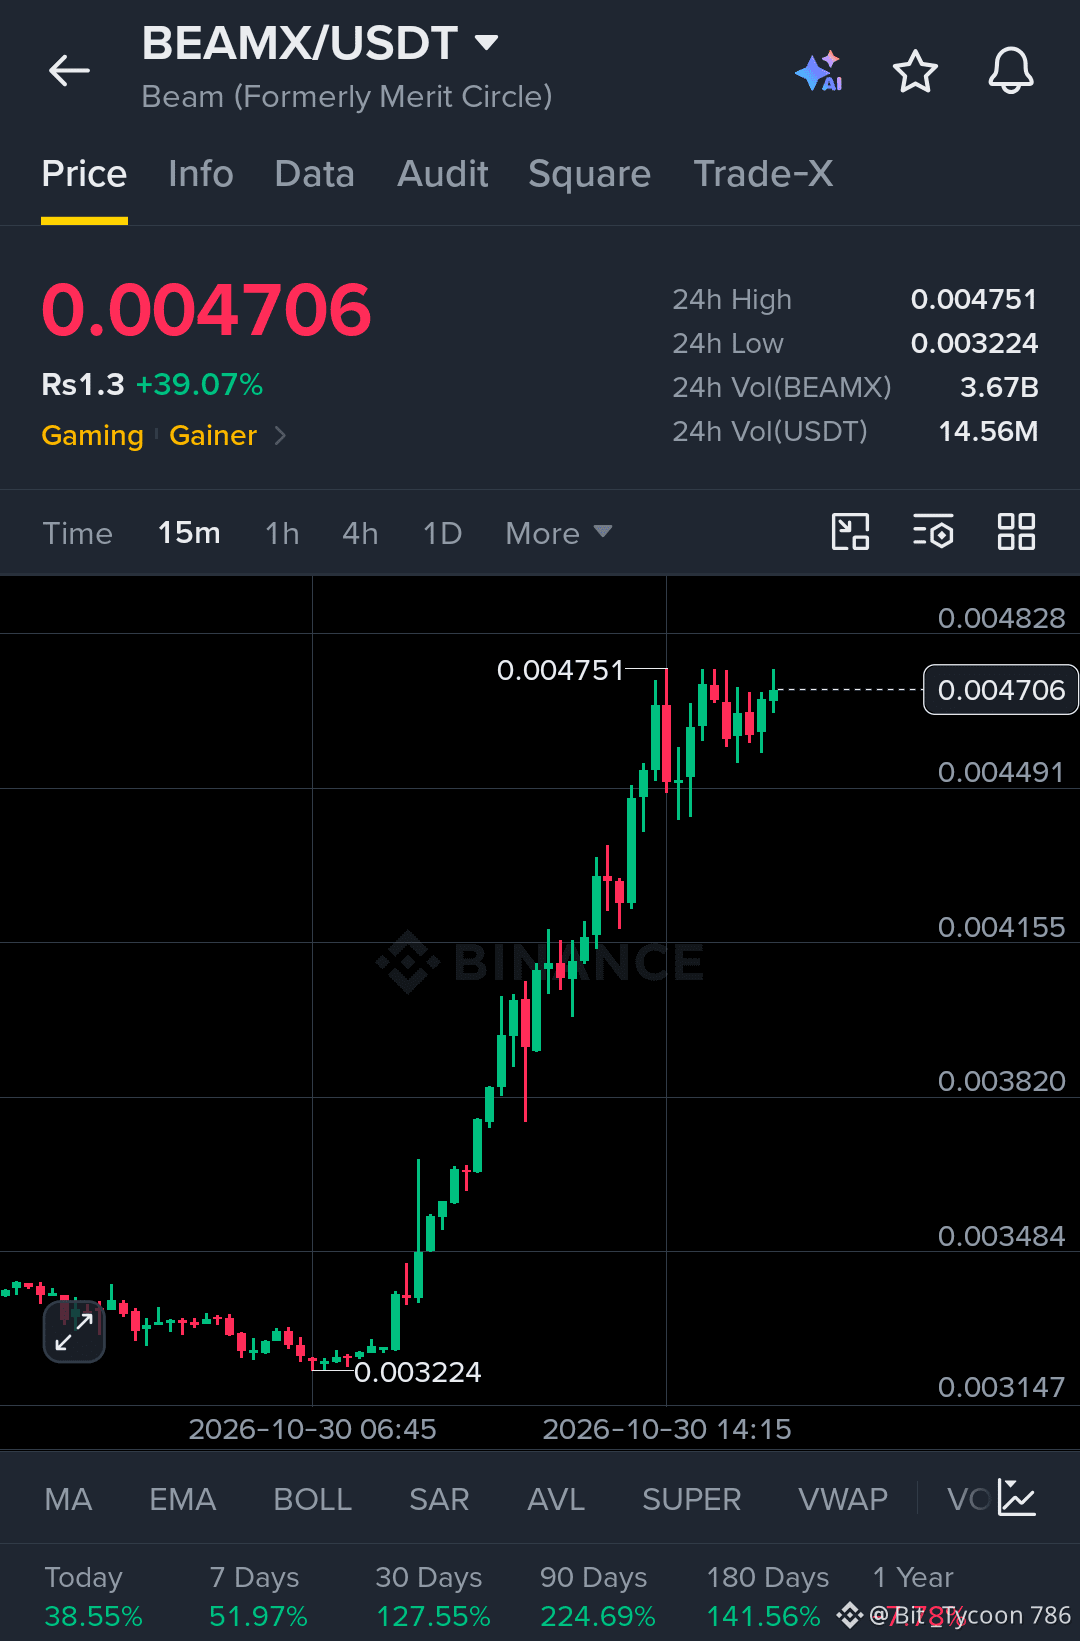
$BEAMX IS RALLYING HARD! BUYERS ARE IN CONTROL.
BEAMX/USDT is trading at $0.004706, up 39.07%, following a powerful move from its 24-hour low of $0.003224.
The chart shows a strong upward trend, with buyers pushing price toward the daily high of $0.004751. After this sharp rally, BEAMX is consolidating near its highs, suggesting buyers are still defending the move.
Trading volume has reached 3.67 billion BEAMX, with 14.56 million USDT in turnover.
Key levels to watch:
- Current price: $0.004706
- Immediate resistance: $0.004751
- Next resistance: $0.004828
- Immediate support: $0.004491
- Lower support: $0.004155
A confirmed breakout above $0.004751 could open the door to another upward move. However, losing $0.004491 may trigger short-term profit-taking.
BEAMX has delivered a strong move today. The key question now is whether buyers have enough strength to push through the daily high.
Watch the resistance. The next breakout attempt matters.
{spot}(BEAMXUSDT)
#KOSPIFalls3.53%BackBelow6000 #AmazonSharesFallAbout7%InPremarketTrading #USMidtermElections #BinanceWillListPredictPREDICT #TwoAddressesHoldingAbout1.28BUSDTFrozen
$BEAMX IS RALLYING HARD! BUYERS ARE IN CONTROL.
BEAMX/USDT is trading at $0.004706, up 39.07%, following a powerful move from its 24-hour low of $0.003224.
The chart shows a strong upward trend, with buyers pushing price toward the daily high of $0.004751. After this sharp rally, BEAMX is consolidating near its highs, suggesting buyers are still defending the move.
Trading volume has reached 3.67 billion BEAMX, with 14.56 million USDT in turnover.
Key levels to watch:
- Current price: $0.004706
- Immediate resistance: $0.004751
- Next resistance: $0.004828
- Immediate support: $0.004491
- Lower support: $0.004155
A confirmed breakout above $0.004751 could open the door to another upward move. However, losing $0.004491 may trigger short-term profit-taking.
BEAMX has delivered a strong move today. The key question now is whether buyers have enough strength to push through the daily high.
Watch the resistance. The next breakout attempt matters.
#KOSPIFalls3.53%BackBelow6000 #AmazonSharesFallAbout7%InPremarketTrading #USMidtermElections #BinanceWillListPredictPREDICT #TwoAddressesHoldingAbout1.28BUSDTFrozen
47
·
--
Bullish
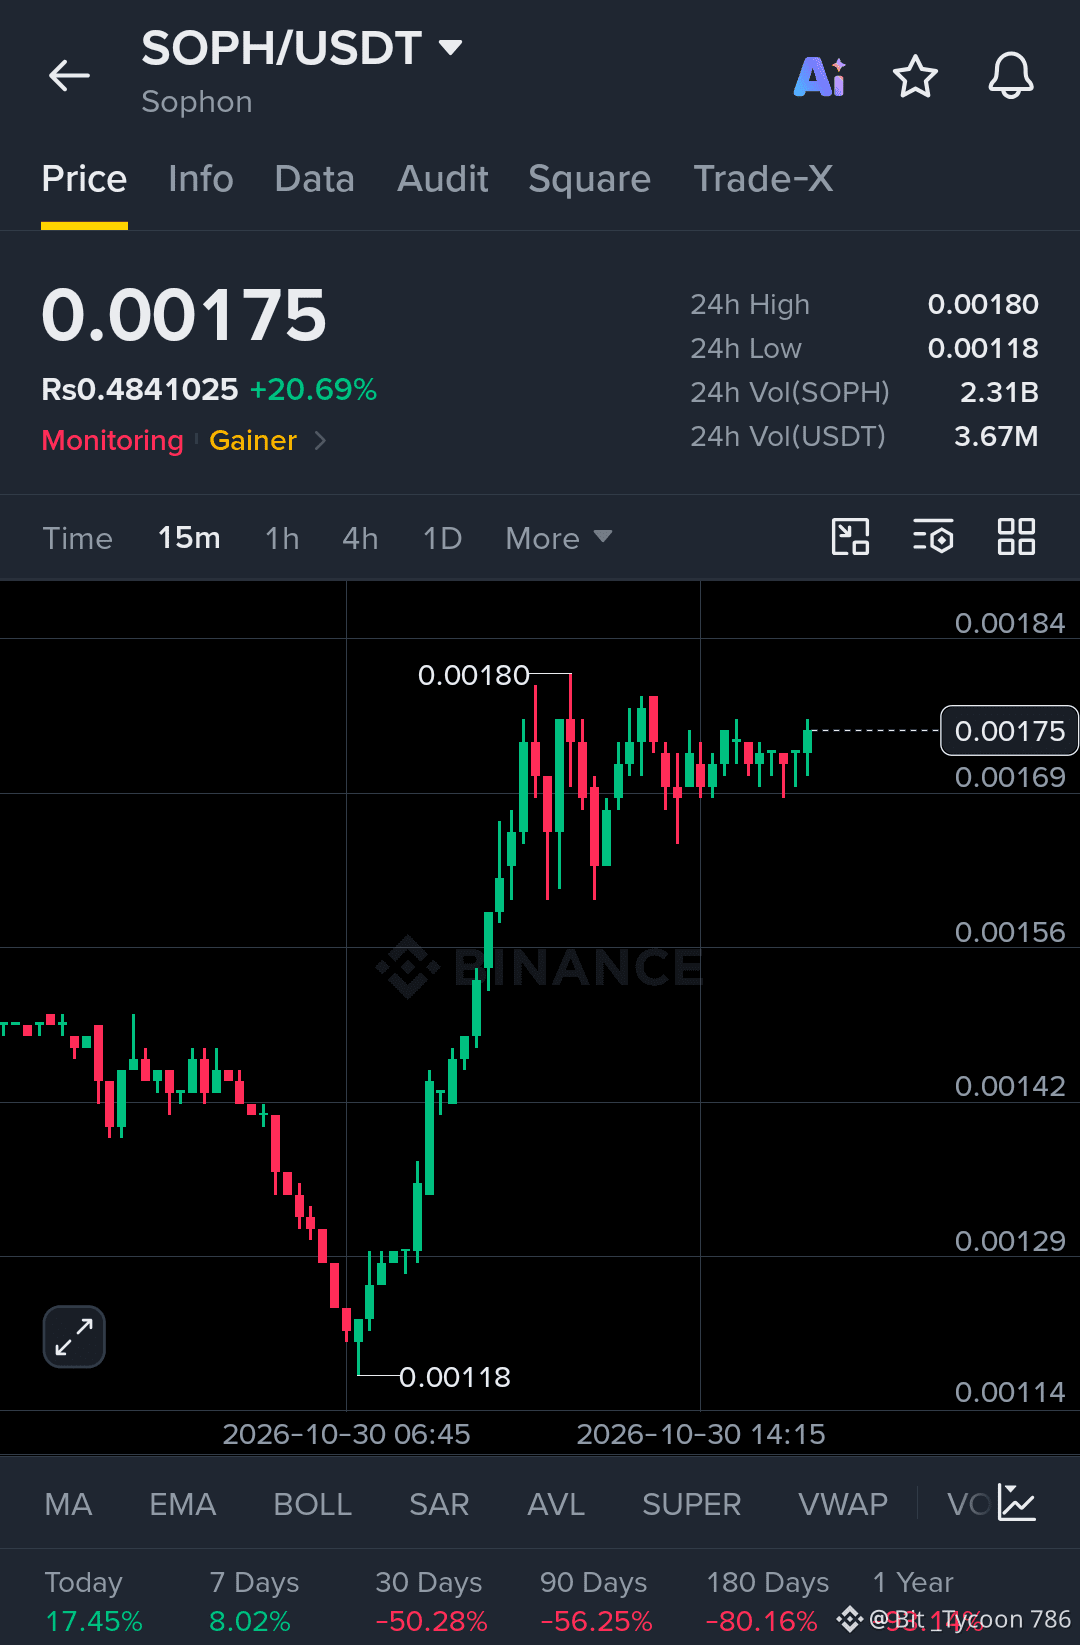
$SOPH IS SHOWING STRONG BULLISH MOMENTUM!
SOPH/USDT is trading at $0.00175, up 20.69%, after a sharp recovery from its 24-hour low of $0.00118.
Buyers have pushed the price significantly higher, and SOPH is now consolidating near $0.00175 after reaching a daily high of $0.00180.
Trading volume has reached 2.31 billion SOPH, with 3.67 million USDT in turnover.
Key levels to watch:
- Current price: $0.00175
- Immediate resistance: $0.00180
- Next resistance: $0.00184
- Immediate support: $0.00169
- Lower support: $0.00156
A clean breakout above $0.00180 could strengthen bullish continuation. However, holding $0.00169 is important to maintain the current structure.
SOPH has attracted strong buying interest today. The next move will depend on whether buyers can turn the $0.00180 resistance into support.
Watch the breakout closely.
{spot}(SOPHUSDT)
#KOSPIFalls3.53%BackBelow6000 #AmazonSharesFallAbout7%InPremarketTrading #USMidtermElections #BinanceWillListPredictPREDICT #TwoAddressesHoldingAbout1.28BUSDTFrozen
$SOPH IS SHOWING STRONG BULLISH MOMENTUM!
SOPH/USDT is trading at $0.00175, up 20.69%, after a sharp recovery from its 24-hour low of $0.00118.
Buyers have pushed the price significantly higher, and SOPH is now consolidating near $0.00175 after reaching a daily high of $0.00180.
Trading volume has reached 2.31 billion SOPH, with 3.67 million USDT in turnover.
Key levels to watch:
- Current price: $0.00175
- Immediate resistance: $0.00180
- Next resistance: $0.00184
- Immediate support: $0.00169
- Lower support: $0.00156
A clean breakout above $0.00180 could strengthen bullish continuation. However, holding $0.00169 is important to maintain the current structure.
SOPH has attracted strong buying interest today. The next move will depend on whether buyers can turn the $0.00180 resistance into support.
Watch the breakout closely.
#KOSPIFalls3.53%BackBelow6000 #AmazonSharesFallAbout7%InPremarketTrading #USMidtermElections #BinanceWillListPredictPREDICT #TwoAddressesHoldingAbout1.28BUSDTFrozen
21
·
--
Bullish
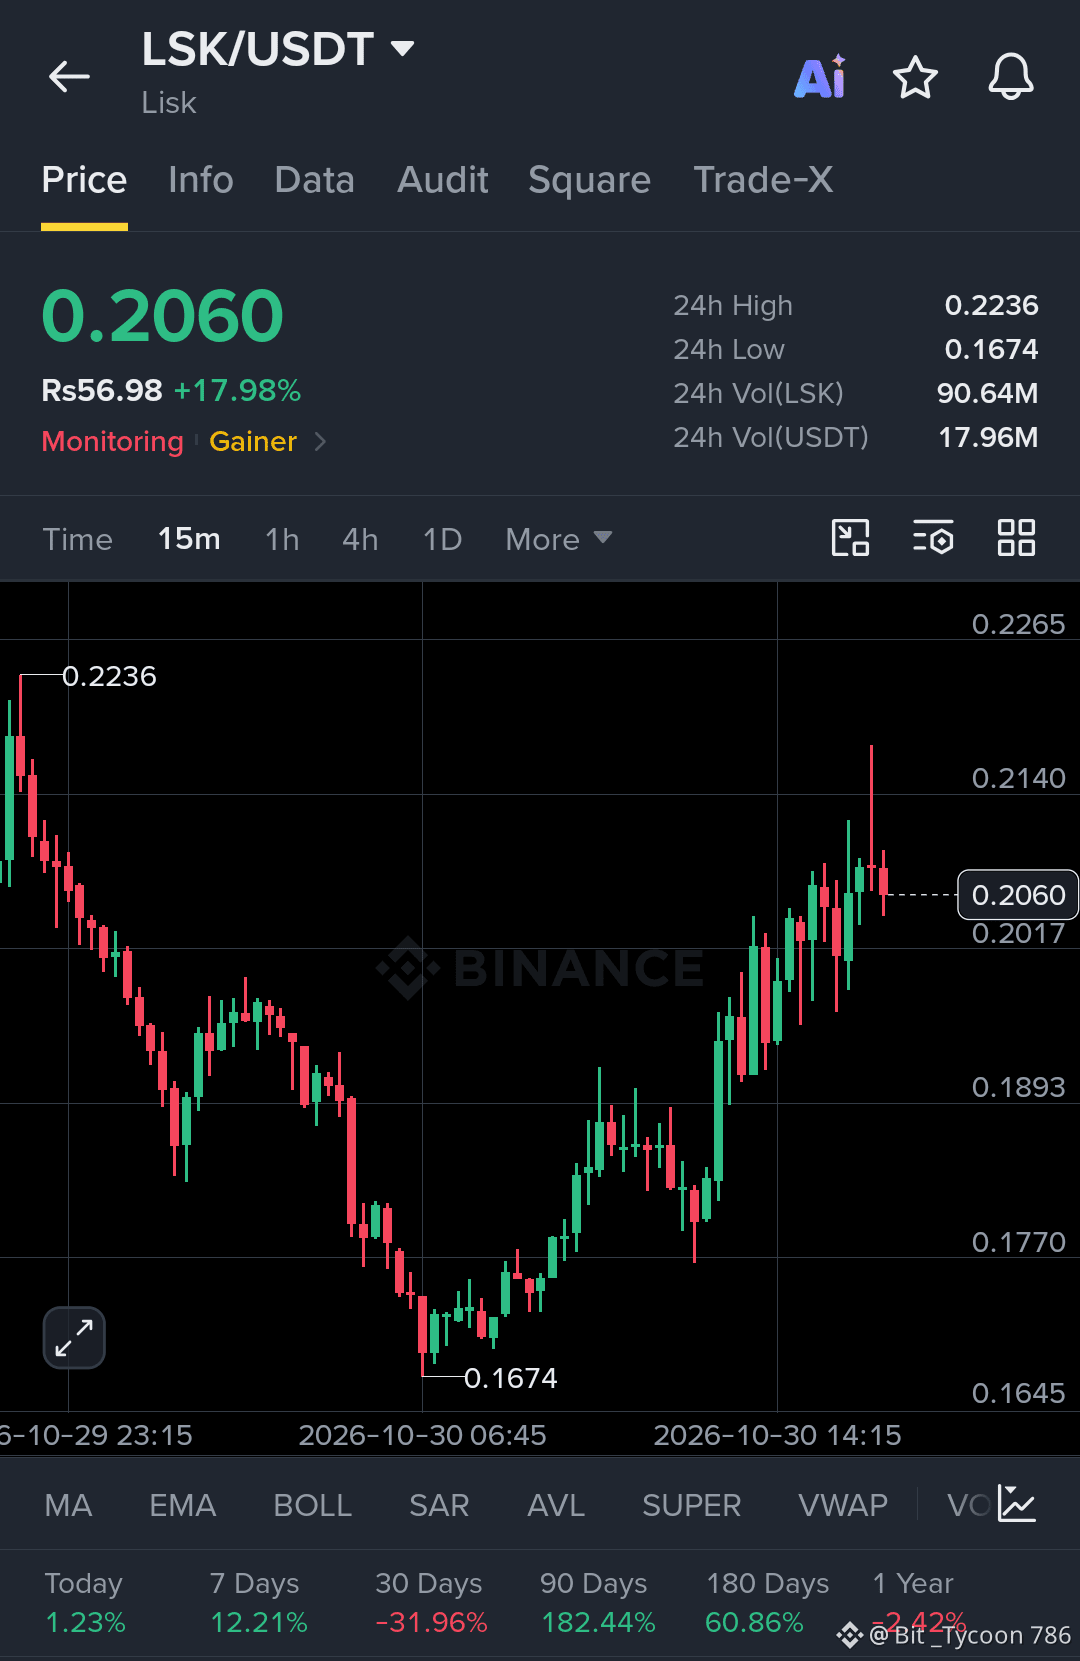
$LSK IS MAKING A STRONG COMEBACK!
LSK/USDT is trading at $0.2060, up 17.98%, after recovering sharply from its 24-hour low of $0.1674.
Buyers have regained control after the earlier decline, pushing LSK toward the $0.2236 daily high. Trading volume has reached 90.64 million LSK, with 17.96 million USDT in turnover.
Key levels to watch:
- Current price: $0.2060
- Resistance: $0.2140
- Major resistance: $0.2236
- Support: $0.2017
- Next support: $0.1893
LSK is showing positive momentum, but the recent rejection near $0.2140 means buyers still need to prove their strength.
A sustained move above $0.2140 could open another test of $0.2236. Losing $0.2017, however, may invite a deeper pullback.
The next move depends on whether buyers can defend support and reclaim resistance.
{spot}(LSKUSDT)
#KOSPIFalls3.53%BackBelow6000 #AmazonSharesFallAbout7%InPremarketTrading #USMidtermElections #BinanceWillListPredictPREDICT #TwoAddressesHoldingAbout1.28BUSDTFrozen
$LSK IS MAKING A STRONG COMEBACK!
LSK/USDT is trading at $0.2060, up 17.98%, after recovering sharply from its 24-hour low of $0.1674.
Buyers have regained control after the earlier decline, pushing LSK toward the $0.2236 daily high. Trading volume has reached 90.64 million LSK, with 17.96 million USDT in turnover.
Key levels to watch:
- Current price: $0.2060
- Resistance: $0.2140
- Major resistance: $0.2236
- Support: $0.2017
- Next support: $0.1893
LSK is showing positive momentum, but the recent rejection near $0.2140 means buyers still need to prove their strength.
A sustained move above $0.2140 could open another test of $0.2236. Losing $0.2017, however, may invite a deeper pullback.
The next move depends on whether buyers can defend support and reclaim resistance.
#KOSPIFalls3.53%BackBelow6000 #AmazonSharesFallAbout7%InPremarketTrading #USMidtermElections #BinanceWillListPredictPREDICT #TwoAddressesHoldingAbout1.28BUSDTFrozen
51
·
--
Bullish
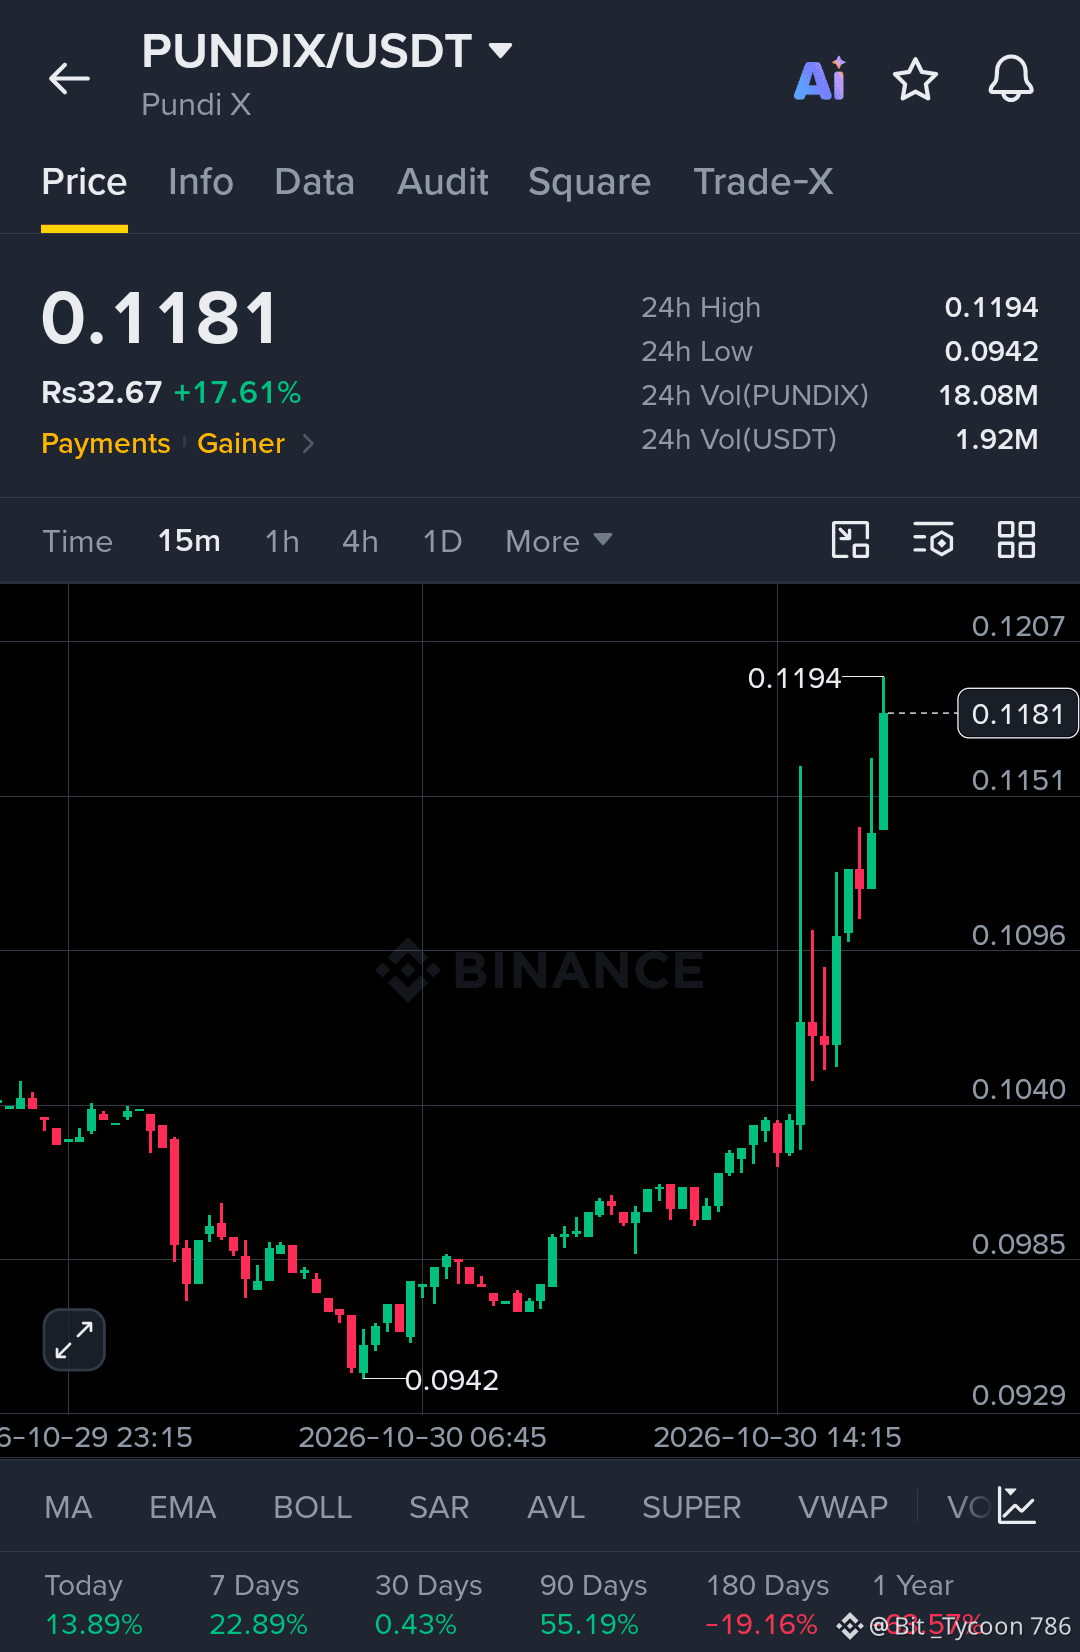
$PUNDIX IS SHOWING STRONG BUYER STRENGTH!
PUNDIX/USDT is trading at $0.1181, up 17.61%, following a sharp recovery from its 24-hour low of $0.0942.
Buyers have stepped in aggressively, pushing the price toward the $0.1194 daily high. Trading volume has reached 18.08 million PUNDIX, showing increased market activity.
Key levels to watch:
- Resistance: $0.1194
- Support: $0.1150
- Next support: $0.1096
- Current price: $0.1181
A clean break above $0.1194 could support further upside. However, rejection near this level may bring short-term profit-taking.
The momentum is clearly bullish, but holding the breakout zone will be important for continuation.
Watch the $0.1194 level closely.
{spot}(PUNDIXUSDT)
#KOSPIFalls3.53%BackBelow6000 #AmazonSharesFallAbout7%InPremarketTrading #USMidtermElections #BinanceWillListPredictPREDICT #TwoAddressesHoldingAbout1.28BUSDTFrozen
$PUNDIX IS SHOWING STRONG BUYER STRENGTH!
PUNDIX/USDT is trading at $0.1181, up 17.61%, following a sharp recovery from its 24-hour low of $0.0942.
Buyers have stepped in aggressively, pushing the price toward the $0.1194 daily high. Trading volume has reached 18.08 million PUNDIX, showing increased market activity.
Key levels to watch:
- Resistance: $0.1194
- Support: $0.1150
- Next support: $0.1096
- Current price: $0.1181
A clean break above $0.1194 could support further upside. However, rejection near this level may bring short-term profit-taking.
The momentum is clearly bullish, but holding the breakout zone will be important for continuation.
Watch the $0.1194 level closely.
#KOSPIFalls3.53%BackBelow6000 #AmazonSharesFallAbout7%InPremarketTrading #USMidtermElections #BinanceWillListPredictPREDICT #TwoAddressesHoldingAbout1.28BUSDTFrozen
41
·
--
Bullish
🚨 $6.3 BILLION BINANCE HACK! THE CRYPTO MARKET IS ON EDGE!
One of the biggest crypto security breaches in history has hit Binance. Attackers drained approximately $6.3 billion from its hot wallets across multiple blockchains, using compromised infrastructure and an EIP-7702 authorization exploit.
Tether and Circle moved quickly, freezing billions in stolen stablecoins. Meanwhile, BTC and ETH faced selling pressure as the attacker moved assets and borrowed around $44 million in ETH through Aave.
North Korea's TraderTraitor group is being linked to the attack by blockchain investigators, but attribution is not officially confirmed.
Binance says customer funds are safe and it will cover the losses.
Billions stolen. Billions frozen. Crypto security under pressure.
Is this a wake-up call for the entire industry?
#KOSPIFalls3.53%BackBelow6000 #USMidtermElections #BinanceWillListPredictPREDICT #TwoAddressesHoldingAbout1.28BUSDTFrozen


2
260
·
--
Bullish
🚨🚀 ALTCOINS ARE HEATING UP! GREEN SCREEN EVERYWHERE!💚💚👀👀
The market is showing some serious buying strength, and these 5 coins are leading today's gainers!
🔥 TOP 5 PERFORMERS:
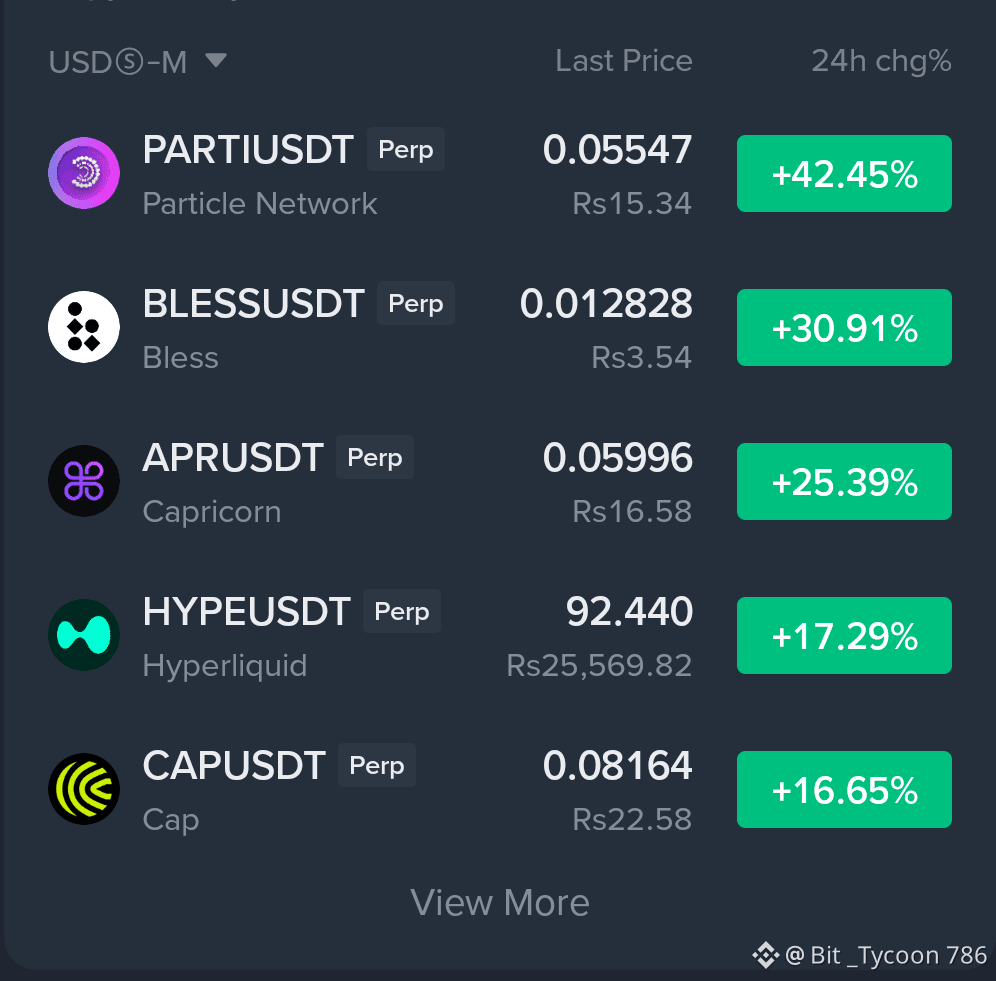
1. $PARTI (Particle Network) — $0.05547 | +42.45%
2. $BLESS (Bless) — $0.012828 | +30.91%
3. APR (Capricorn) — $0.05996 | +25.39%
4. HYPE (Hyperliquid) — $92.440 | +17.29%
5. $CAP (Cap) — $0.08164 | +16.65%
PARTI is taking the lead with an impressive 42.45% surge, while BLESS and APR are also showing strong momentum.
HYPE and CAP are keeping the bullish momentum alive.
The big question now: Can buyers maintain this strength, or are we approaching a short-term profit-taking phase?
Keep your eyes on volume, support levels, and the next breakout opportunities. Strong moves can bring strong volatility too.
The altcoin market is getting interesting!
{future}(CAPUSDT)
{future}(BLESSUSDT)
{spot}(PARTIUSDT)
#EarningsSeason #USMidtermElections #BinanceWillListPredictPREDICT #TwoAddressesHoldingAbout1.28BUSDTFrozen
🚨🚀 ALTCOINS ARE HEATING UP! GREEN SCREEN EVERYWHERE!💚💚👀👀
The market is showing some serious buying strength, and these 5 coins are leading today's gainers!
🔥 TOP 5 PERFORMERS:
1. $PARTI (Particle Network) — $0.05547 | +42.45%
2. $BLESS (Bless) — $0.012828 | +30.91%
3. APR (Capricorn) — $0.05996 | +25.39%
4. HYPE (Hyperliquid) — $92.440 | +17.29%
5. $CAP (Cap) — $0.08164 | +16.65%
PARTI is taking the lead with an impressive 42.45% surge, while BLESS and APR are also showing strong momentum.
HYPE and CAP are keeping the bullish momentum alive.
The big question now: Can buyers maintain this strength, or are we approaching a short-term profit-taking phase?
Keep your eyes on volume, support levels, and the next breakout opportunities. Strong moves can bring strong volatility too.
The altcoin market is getting interesting!
#EarningsSeason #USMidtermElections #BinanceWillListPredictPREDICT #TwoAddressesHoldingAbout1.28BUSDTFrozen
1
290
·
--
Bullish
🚨GREEN IS EVERYWHERE TODAY! 💚🔥
Happy Gainers Day!
Today's Top 5 Market Gainers:
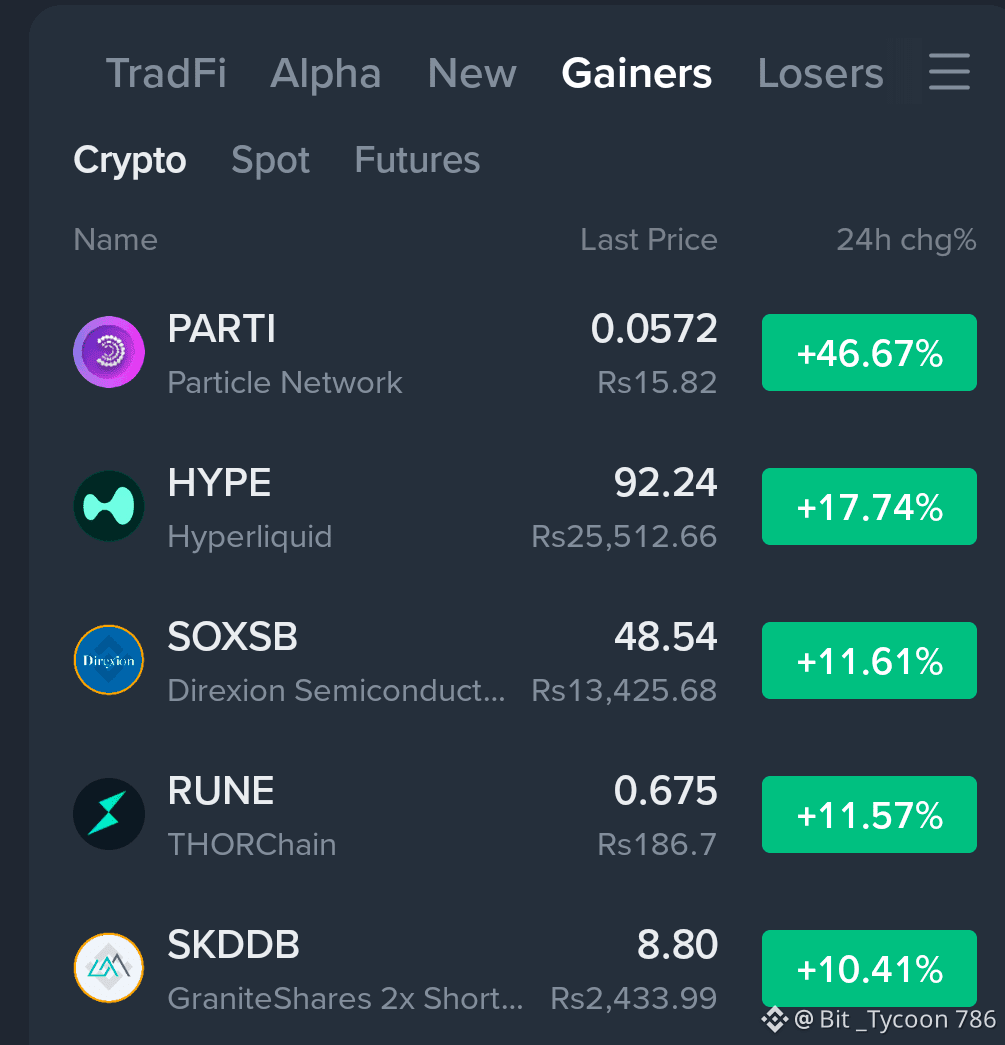
1.$PARTI — +46.67%
2. $HYPE — +17.74%
3. $SOXSB — +11.61%
4. RUNE — +11.57%
5. SKDDB — +10.41%
Buyers are showing strength, and the market is giving us some serious green candles.
Which one is on your watchlist?
Green vibes only! 💚🚀 LONG 💫💫🎉🎉
{spot}(PARTIUSDT)
{spot}(HYPEUSDT)
#EarningsSeason #USMidtermElections #BinanceWillListPredictPREDICT #TwoAddressesHoldingAbout1.28BUSDTFrozen
🚨GREEN IS EVERYWHERE TODAY! 💚🔥
Happy Gainers Day!
Today's Top 5 Market Gainers:
1.$PARTI — +46.67%
2. $HYPE — +17.74%
3. $SOXSB — +11.61%
4. RUNE — +11.57%
5. SKDDB — +10.41%
Buyers are showing strength, and the market is giving us some serious green candles.
Which one is on your watchlist?
Green vibes only! 💚🚀 LONG 💫💫🎉🎉
#EarningsSeason #USMidtermElections #BinanceWillListPredictPREDICT #TwoAddressesHoldingAbout1.28BUSDTFrozen
2
1
658
·
--
Bullish
🚨 THE FED'S NEXT MOVE COULD SHAKE THE ENTIRE MARKET!
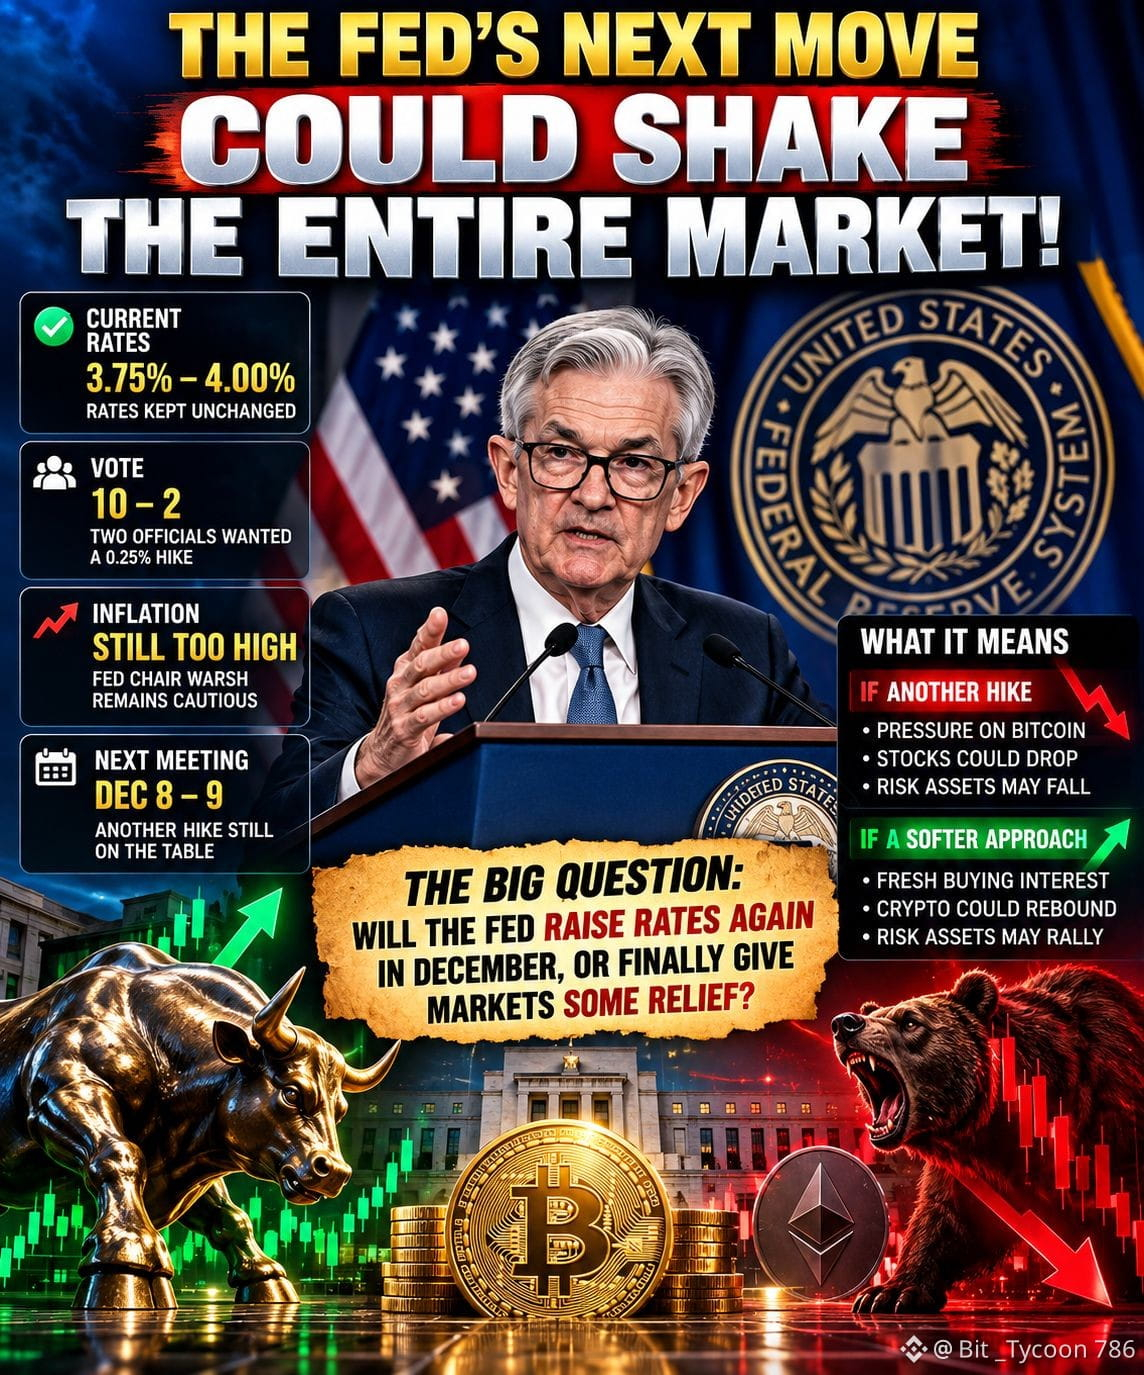
All eyes are on the Federal Reserve as inflation remains a major concern and interest rate uncertainty keeps traders on edge.
The key question is simple: Will the Fed keep rates higher for longer, or will we finally see a shift toward rate cuts?
A hawkish decision could put pressure on Bitcoin, altcoins and stocks. A softer approach could bring fresh buying interest and a market rebound.
But don't get ahead of the data. Inflation, jobs numbers and the Fed's next statements will matter.
One thing is certain: The next Fed move could set the tone for the crypto market.
Are we heading for another sell-off or a strong recovery?
#FedWatch #EarningsSeason #USMidtermElections #BinanceWillListPredictPREDICT #TwoAddressesHoldingAbout1.28BUSDTFrozen
127
·
--
Bullish
$HYPE | Hyperliquid Market Update
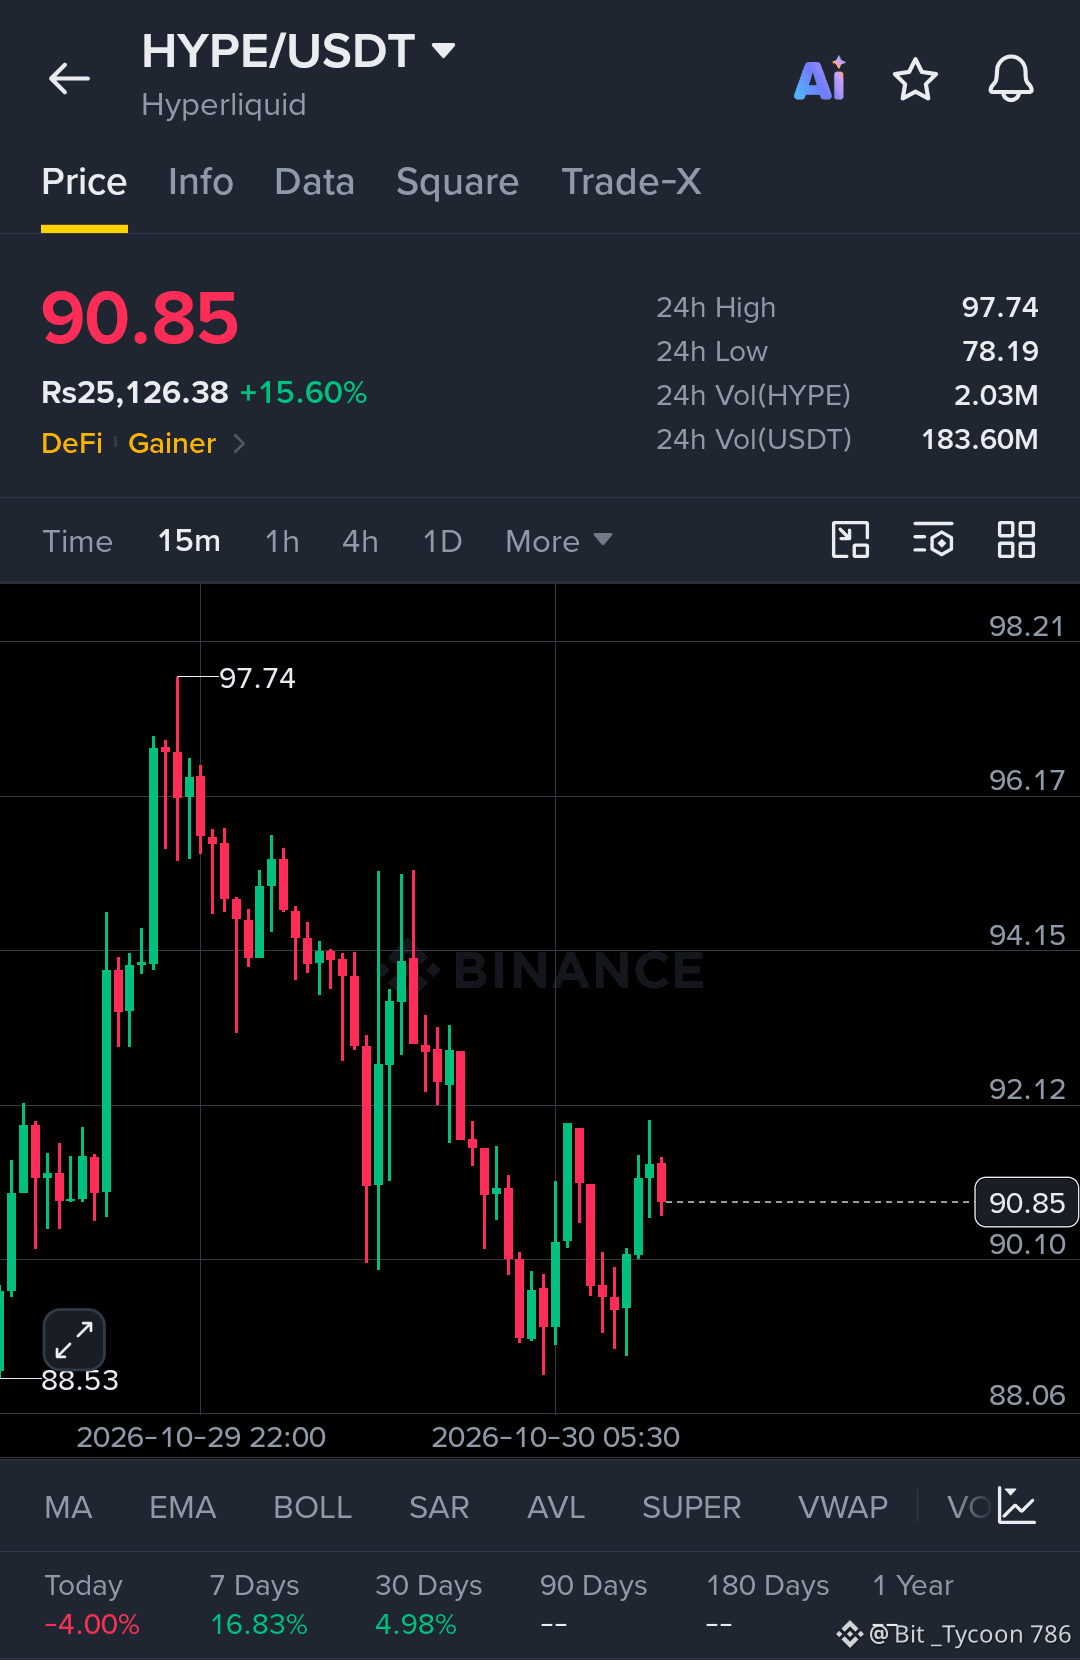
HYPE is trading around $90.85, up 15.60% over the past 24 hours, with trading volume reaching 2.03M HYPE, equivalent to approximately $183.60M.
Price recently climbed to $97.74 before facing selling pressure and entering a short-term correction. The pullback pushed the price toward the $88.50 area, where buyers stepped in and supported a recovery toward $90.85.
On the 15-minute chart, the market is showing signs of a rebound, although the broader intraday structure still reflects the earlier downward move from the recent high.
Key levels to watch:
- Resistance: $92.12, $94.15, $96.17
- Support: $90.10, $88.53, $78.19
A sustained move above $92.12 could help strengthen the recovery. However, losing the $90.10 area may bring the recent lows back into focus.
The next move will depend on whether buyers can maintain momentum and reclaim nearby resistance levels.
{spot}(HYPEUSDT)
$NIL
{spot}(NILUSDT)
$SOL
{spot}(SOLUSDT)
#FedWatch #EarningsSeason #USMidtermElections #BinanceWillListPredictPREDICT
$HYPE | Hyperliquid Market Update
HYPE is trading around $90.85, up 15.60% over the past 24 hours, with trading volume reaching 2.03M HYPE, equivalent to approximately $183.60M.
Price recently climbed to $97.74 before facing selling pressure and entering a short-term correction. The pullback pushed the price toward the $88.50 area, where buyers stepped in and supported a recovery toward $90.85.
On the 15-minute chart, the market is showing signs of a rebound, although the broader intraday structure still reflects the earlier downward move from the recent high.
Key levels to watch:
- Resistance: $92.12, $94.15, $96.17
- Support: $90.10, $88.53, $78.19
A sustained move above $92.12 could help strengthen the recovery. However, losing the $90.10 area may bring the recent lows back into focus.
The next move will depend on whether buyers can maintain momentum and reclaim nearby resistance levels.
$NIL
$SOL
#FedWatch #EarningsSeason #USMidtermElections #BinanceWillListPredictPREDICT
3
1k
·
--
Bullish
🚨 🇺🇸 PETER SCHIFF JUST ISSUED A MAJOR FED WARNING!
Schiff calls Kevin Warsh’s tough inflation stance a “bluff,” predicting the Fed could return to QE and cut interest rates next year, even as inflation remains elevated.
🔥 Inflation stays hot.
🔥 QE could inject fresh liquidity.
🔥 Rate cuts could fuel stocks, gold & Bitcoin.
But the Fed faces a dangerous dilemma: fight inflation or support the economy?
Will Warsh hold the hawkish line, or will the money printers return?
The next Fed pivot could change the entire market outlook.
#FedWatch #BTC #FederalReserve #QE #Crypto


149
·
--
Bullish
$LSK /USDT is showing a sharp breakout, with price climbing to $0.2115 after gaining 28.73% in 24 hours. The 15-minute chart shows a strong expansion from the $0.17 area, followed by a pullback from the $0.2224 high.
The move reflects strong short-term buying pressure, but the latest rejection near the daily high suggests traders are taking profits. After such a rapid advance, the next test is whether LSK can hold its breakout structure rather than surrender the gains.
The immediate resistance is $0.2224. A sustained break above this level could bring $0.2300 into focus. On the downside, $0.2100 is the first area to monitor, followed by $0.2000 and $0.1878 if the pullback deepens.
Reported 24-hour volume stands at 34.25 million LSK, equivalent to approximately 6.70 million USDT. This indicates active trading during the rally, although sustained demand will be needed to support further upside.
LSK remains in a strong short-term move, but confirmation matters more than the daily percentage gain. Holding above nearby support would help preserve the bullish structure, while a rejection below $0.2000 would weaken the breakout. The key levels now are $0.2224 resistance and $0.2100 support, with volume and price reaction guiding the next assessment.
{spot}(LSKUSDT)
#FedWatch #EarningsSeason #USMidtermElections #BrazilCryptoExchangesMustApplyForLicensesByFriday #StanDruckenmillerBecomesInvestorInTradeXYZ
$LSK /USDT is showing a sharp breakout, with price climbing to $0.2115 after gaining 28.73% in 24 hours. The 15-minute chart shows a strong expansion from the $0.17 area, followed by a pullback from the $0.2224 high.
The move reflects strong short-term buying pressure, but the latest rejection near the daily high suggests traders are taking profits. After such a rapid advance, the next test is whether LSK can hold its breakout structure rather than surrender the gains.
The immediate resistance is $0.2224. A sustained break above this level could bring $0.2300 into focus. On the downside, $0.2100 is the first area to monitor, followed by $0.2000 and $0.1878 if the pullback deepens.
Reported 24-hour volume stands at 34.25 million LSK, equivalent to approximately 6.70 million USDT. This indicates active trading during the rally, although sustained demand will be needed to support further upside.
LSK remains in a strong short-term move, but confirmation matters more than the daily percentage gain. Holding above nearby support would help preserve the bullish structure, while a rejection below $0.2000 would weaken the breakout. The key levels now are $0.2224 resistance and $0.2100 support, with volume and price reaction guiding the next assessment.
#FedWatch #EarningsSeason #USMidtermElections #BrazilCryptoExchangesMustApplyForLicensesByFriday #StanDruckenmillerBecomesInvestorInTradeXYZ
LONG
SHORT
LSK
$0.2115
3 hr(s) left
722
·
--
Bullish
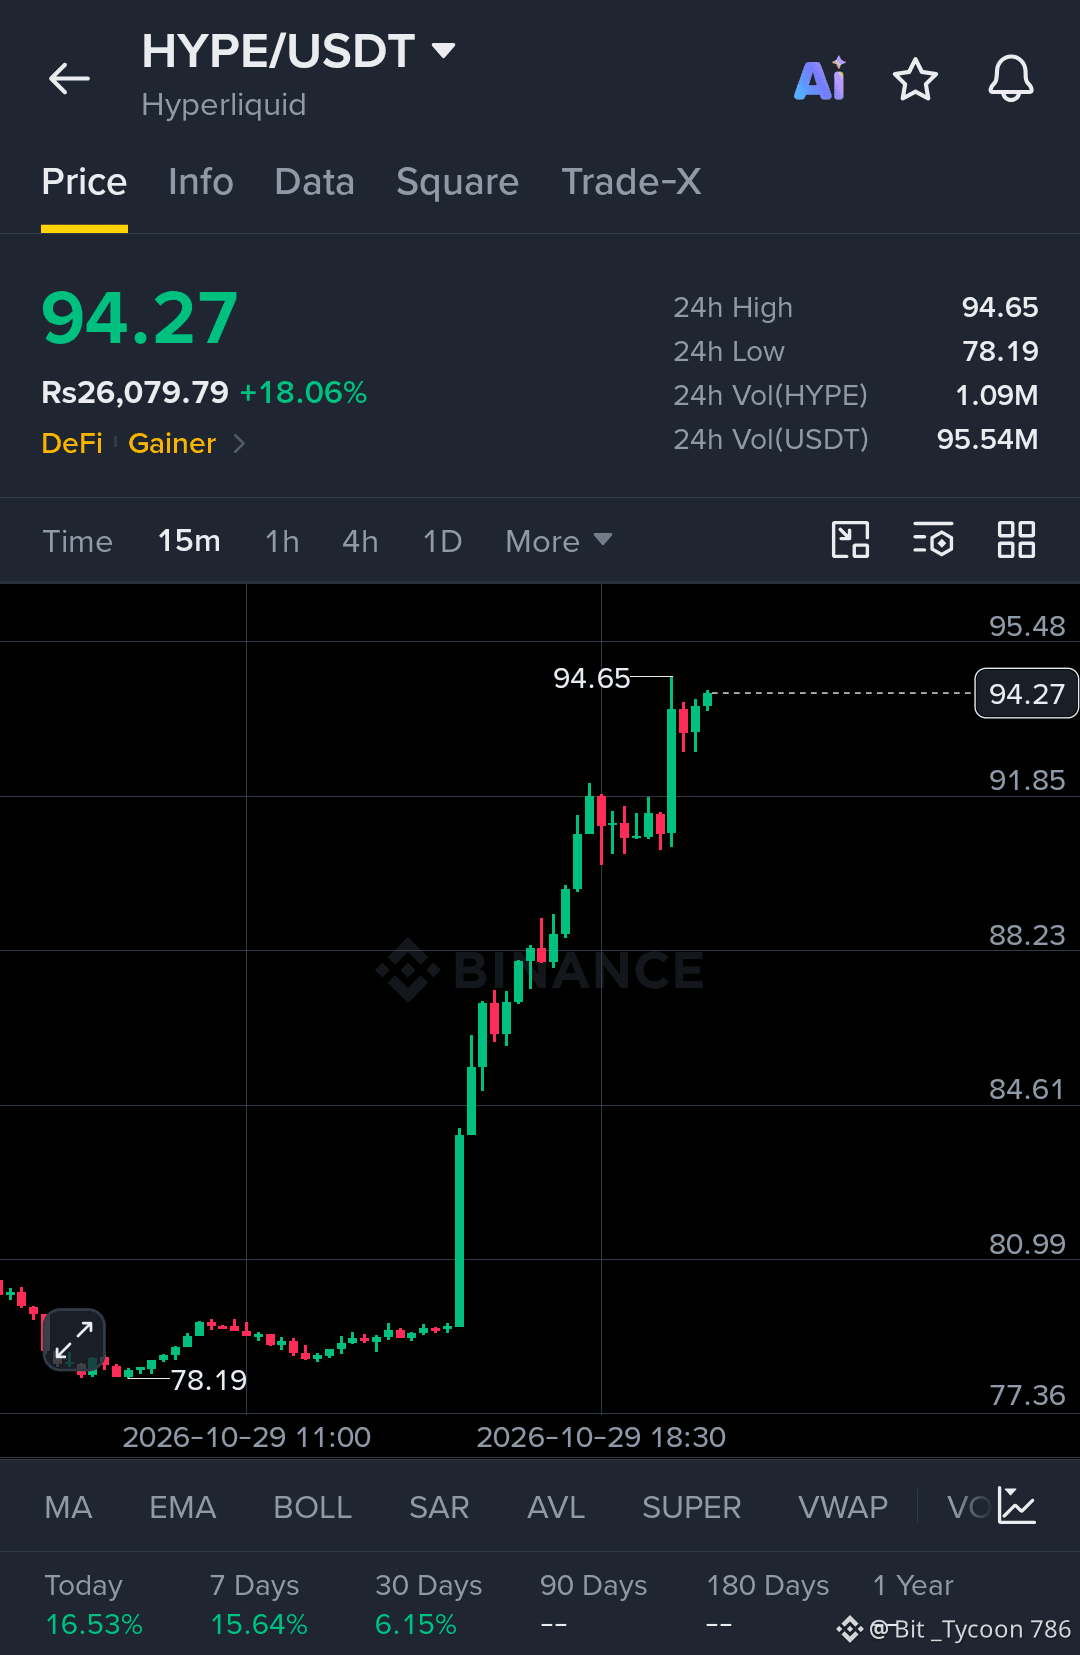
$HYPE /USDT is showing strong short-term momentum after a sharp breakout from the $78–$80 range. Price has climbed to $94.27, up 18.06% in 24 hours, with buyers pushing the market close to its daily high of $94.65.
The 15-minute chart shows a clear upward move, followed by a brief consolidation around $90–$92 before another push higher. This structure suggests buyers remain active, although the speed of the rally increases the risk of a short-term pullback.
The immediate resistance is $94.65. A sustained break above this level could open the way toward $96.00 and $98.00. On the downside, $92.00 is the first area to monitor, followed by $91.85 and the $90.00 zone if selling pressure increases.
Trading volume has reached approximately 1.09 million HYPE, equivalent to 95.54 million USDT over 24 hours, indicating substantial market activity during the move. Volume persistence will matter more than the daily percentage gain alone.
HYPE is currently testing the upper end of its intraday range. A confirmed breakout above $94.65 would strengthen the bullish structure, while rejection could lead to consolidation or a deeper retracement. Chasing an extended candle carries additional risk, so the reaction at resistance and the ability to hold support remain the key factors to watch.
{spot}(HYPEUSDT)
#FedWatch #EarningsSeason #USMidtermElections #BrazilCryptoExchangesMustApplyForLicensesByFriday #StanDruckenmillerBecomesInvestorInTradeXYZ
$HYPE /USDT is showing strong short-term momentum after a sharp breakout from the $78–$80 range. Price has climbed to $94.27, up 18.06% in 24 hours, with buyers pushing the market close to its daily high of $94.65.
The 15-minute chart shows a clear upward move, followed by a brief consolidation around $90–$92 before another push higher. This structure suggests buyers remain active, although the speed of the rally increases the risk of a short-term pullback.
The immediate resistance is $94.65. A sustained break above this level could open the way toward $96.00 and $98.00. On the downside, $92.00 is the first area to monitor, followed by $91.85 and the $90.00 zone if selling pressure increases.
Trading volume has reached approximately 1.09 million HYPE, equivalent to 95.54 million USDT over 24 hours, indicating substantial market activity during the move. Volume persistence will matter more than the daily percentage gain alone.
HYPE is currently testing the upper end of its intraday range. A confirmed breakout above $94.65 would strengthen the bullish structure, while rejection could lead to consolidation or a deeper retracement. Chasing an extended candle carries additional risk, so the reaction at resistance and the ability to hold support remain the key factors to watch.
#FedWatch #EarningsSeason #USMidtermElections #BrazilCryptoExchangesMustApplyForLicensesByFriday #StanDruckenmillerBecomesInvestorInTradeXYZ
269
·
--
Bullish
🚨 ICP in 2027: $100 or a major letdown?
Internet Computer aims to push decentralized computing further—but can adoption and demand drive ICP toward $100, or will expectations fall short?
Bullish breakout or bearish reality?
Drop your ICP 2027 price target below.
#ICP #FedWatch #EarningsSeason
$ICP
{spot}(ICPUSDT)
🚨 ICP in 2027: $100 or a major letdown?
Internet Computer aims to push decentralized computing further—but can adoption and demand drive ICP toward $100, or will expectations fall short?
Bullish breakout or bearish reality?
Drop your ICP 2027 price target below.
#ICP #FedWatch #EarningsSeason
$ICP
Internet Computer aims to push decentralized computing further—but can adoption and demand drive ICP toward $100, or will expectations fall short?
Bullish breakout or bearish reality?
Drop your ICP 2027 price target below.
#ICP #FedWatch #EarningsSeason
$ICP


1
373
·
--
Bullish
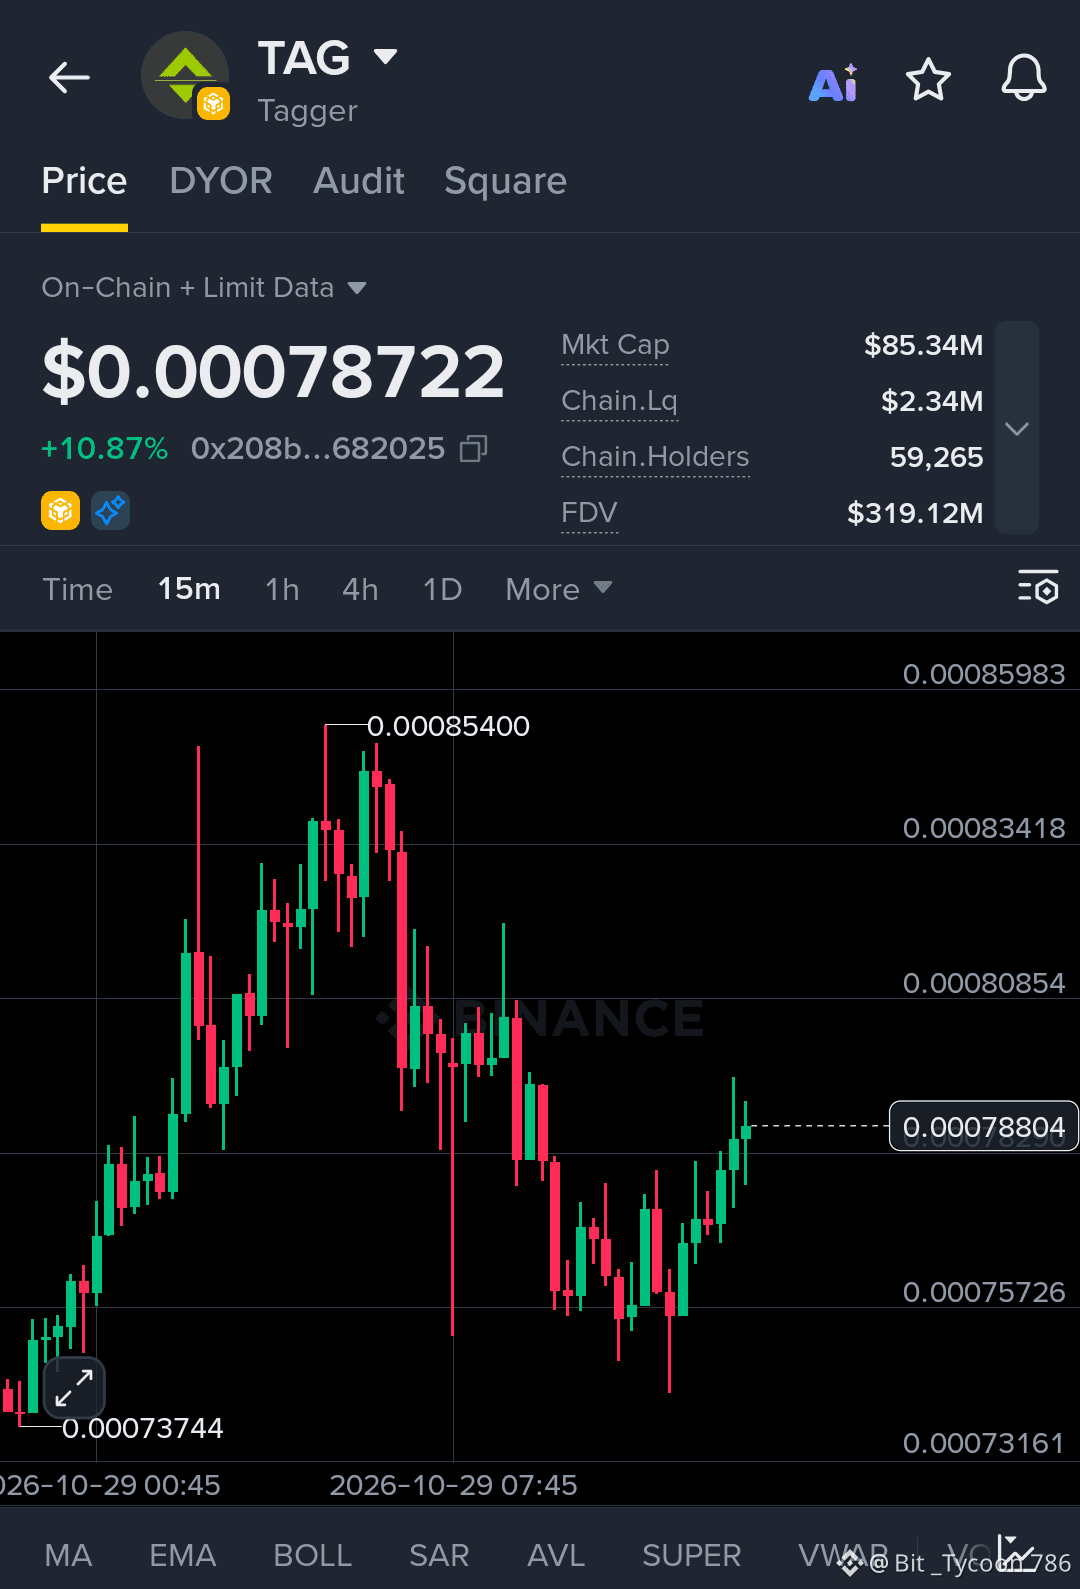
$TAG (Tagger) is attempting a short-term recovery after pulling back from its recent high, with the 15-minute chart showing buyers gradually regaining control.
The token is trading around $0.00078722, up 10.87% at the time of the screenshot. Price previously reached $0.00085400 before facing selling pressure and retracing toward the $0.00074–$0.00075 region. The latest candles show a rebound from that support area, although the recovery still needs confirmation.
The immediate level to watch is $0.0007900. A sustained move above this zone could bring $0.0008085 into focus, followed by resistance around $0.0008342. The previous high near $0.0008540 remains the broader upside reference if momentum continues to build.
On the downside, $0.0007750 is an important short-term area, followed by support around $0.0007570. A move below these levels would weaken the current recovery and increase the possibility of another test of the recent low near $0.0007374.
TAG has a reported market capitalization of $85.34 million, approximately $2.34 million in on-chain liquidity, and 59,265 holders in the screenshot. Its fully diluted valuation stands at $319.12 million, making the distinction between current market capitalization and FDV relevant when assessing its token economics.
For now, TAG is recovering from its pullback, but the next move depends on whether buyers can sustain pressure above nearby resistance. A confirmed breakout would strengthen the short-term structure, while rejection could leave the token trading within its existing range. Volume, support retention, and the reaction at resistance remain the key signals to monitor.
{alpha}(560x208bf3e7da9639f1eaefa2de78c23396b0682025)
#CanMicrosoftDeliverOnAI #CanGoogleDefindItsCore #FedWatch #BitcoinCore32.1RaisesPeerConnectionLimit #GoogleToPreviewCryptoCustodySecuritySystem
$TAG (Tagger) is attempting a short-term recovery after pulling back from its recent high, with the 15-minute chart showing buyers gradually regaining control.
The token is trading around $0.00078722, up 10.87% at the time of the screenshot. Price previously reached $0.00085400 before facing selling pressure and retracing toward the $0.00074–$0.00075 region. The latest candles show a rebound from that support area, although the recovery still needs confirmation.
The immediate level to watch is $0.0007900. A sustained move above this zone could bring $0.0008085 into focus, followed by resistance around $0.0008342. The previous high near $0.0008540 remains the broader upside reference if momentum continues to build.
On the downside, $0.0007750 is an important short-term area, followed by support around $0.0007570. A move below these levels would weaken the current recovery and increase the possibility of another test of the recent low near $0.0007374.
TAG has a reported market capitalization of $85.34 million, approximately $2.34 million in on-chain liquidity, and 59,265 holders in the screenshot. Its fully diluted valuation stands at $319.12 million, making the distinction between current market capitalization and FDV relevant when assessing its token economics.
For now, TAG is recovering from its pullback, but the next move depends on whether buyers can sustain pressure above nearby resistance. A confirmed breakout would strengthen the short-term structure, while rejection could leave the token trading within its existing range. Volume, support retention, and the reaction at resistance remain the key signals to monitor.
#CanMicrosoftDeliverOnAI #CanGoogleDefindItsCore #FedWatch #BitcoinCore32.1RaisesPeerConnectionLimit #GoogleToPreviewCryptoCustodySecuritySystem
1
213
·
--
Bullish
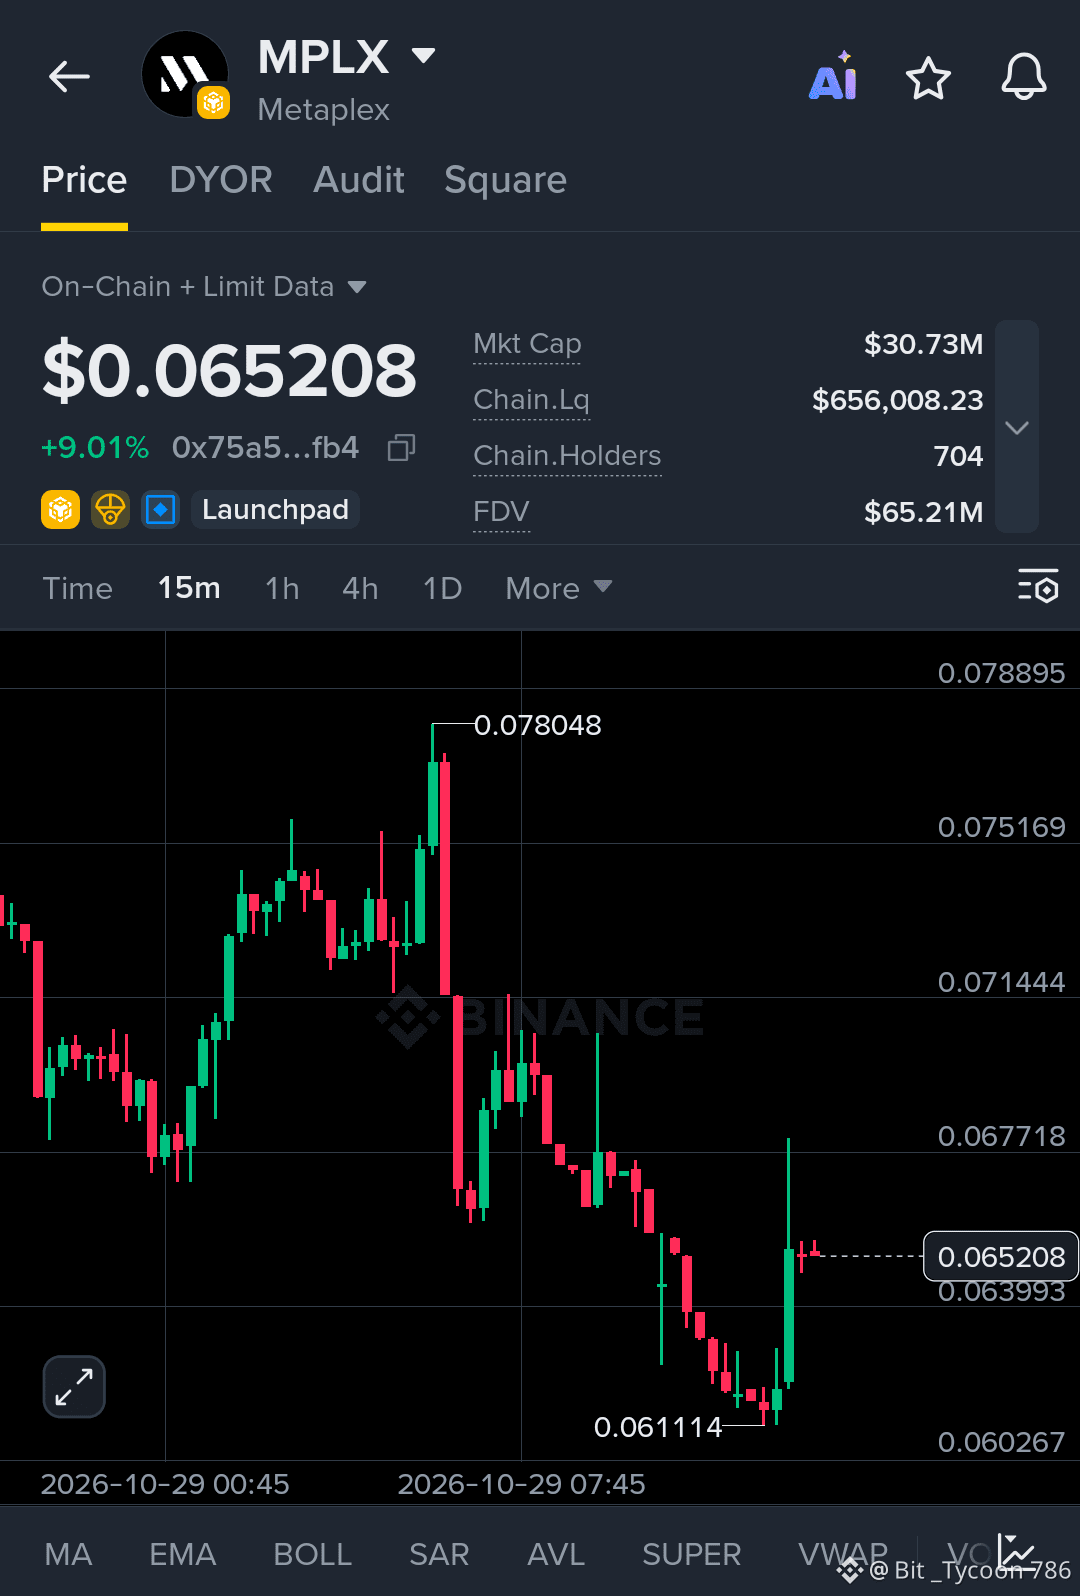
$MPLX is showing a recovery attempt after a sharp sell-off, but the 15-minute chart still needs stronger confirmation before the trend can be considered bullish.
The token is trading around $0.0652 after bouncing from the recent low near $0.0611. Buyers stepped in at the bottom and pushed the price higher, although the rebound has slowed near the $0.065–$0.066 area. That suggests short-term buying interest is returning, but sellers may still be active.
The first level to watch is $0.0660. A sustained move above this zone could open the way toward $0.0677, followed by $0.0690. If momentum continues to improve, the $0.0714 resistance area becomes the next important test.
On the downside, $0.0640 is an important support zone. Losing this level could weaken the recovery and bring $0.0630 back into focus. The recent low near $0.0611 remains the key level to watch if selling pressure returns.
MPLX has a market cap of approximately $30.73 million, with around $656,008 in on-chain liquidity and 704 reported holders in the screenshot. These figures provide some context, but they do not guarantee liquidity depth or sustained demand.
For now, the main question is whether MPLX can reclaim resistance and hold above it. The bounce is worth watching, but confirmation through stronger volume and continued buying pressure would make the recovery more convincing. Until then, patience and risk management remain important.
{alpha}(560x75a5863a19af60ec0098d62ed8c34cc594fb470f)
#CanMicrosoftDeliverOnAI #CanGoogleDefindItsCore #FedWatch #BitcoinCore32.1RaisesPeerConnectionLimit #BitcoinCoreIdentifiesThreeVulnerabilities
$MPLX is showing a recovery attempt after a sharp sell-off, but the 15-minute chart still needs stronger confirmation before the trend can be considered bullish.
The token is trading around $0.0652 after bouncing from the recent low near $0.0611. Buyers stepped in at the bottom and pushed the price higher, although the rebound has slowed near the $0.065–$0.066 area. That suggests short-term buying interest is returning, but sellers may still be active.
The first level to watch is $0.0660. A sustained move above this zone could open the way toward $0.0677, followed by $0.0690. If momentum continues to improve, the $0.0714 resistance area becomes the next important test.
On the downside, $0.0640 is an important support zone. Losing this level could weaken the recovery and bring $0.0630 back into focus. The recent low near $0.0611 remains the key level to watch if selling pressure returns.
MPLX has a market cap of approximately $30.73 million, with around $656,008 in on-chain liquidity and 704 reported holders in the screenshot. These figures provide some context, but they do not guarantee liquidity depth or sustained demand.
For now, the main question is whether MPLX can reclaim resistance and hold above it. The bounce is worth watching, but confirmation through stronger volume and continued buying pressure would make the recovery more convincing. Until then, patience and risk management remain important.
#CanMicrosoftDeliverOnAI #CanGoogleDefindItsCore #FedWatch #BitcoinCore32.1RaisesPeerConnectionLimit #BitcoinCoreIdentifiesThreeVulnerabilities
68
·
--
Bullish
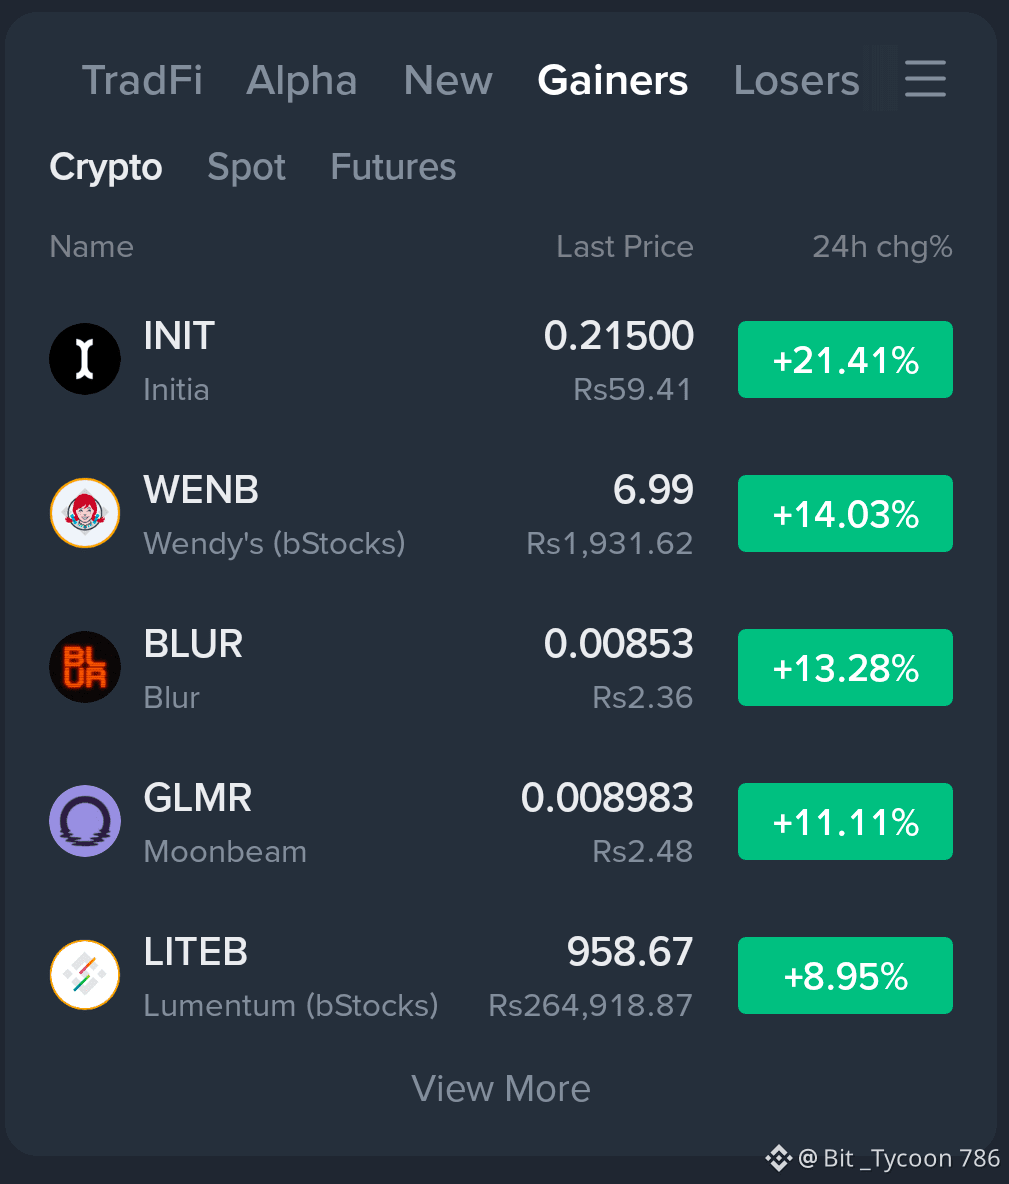
🎉 Happy Gainers Day! Green Market, Strong Momentum! 📈🚀
The market is painting the charts green, and today's top gainers are catching everyone's attention! 🔥💹
🥇 $INIT — Up 21.41%
🥈 $WENB — Up 14.03%
🥉 $BLUR — Up 13.28%
🌙 $GLMR — Up 11.11%
💎 $LITEB — Up 8.95%
💚 From INIT's strong move to BLUR and GLMR gaining momentum, these tokens are making a noticeable impact on today's market.
📊 Remember, a green candle is an opportunity to analyze, not a guarantee of further gains. Watch volume, key resistance levels, and your risk before entering any trade.
🔥 Happy Gainer Day, Crypto Family! Which coin do you think will lead the next move? 👇
#Crypto #TopGainers #CryptoMarket #Trading
{spot}(BLURUSDT)
🎉 Happy Gainers Day! Green Market, Strong Momentum! 📈🚀
The market is painting the charts green, and today's top gainers are catching everyone's attention! 🔥💹
🥇 $INIT — Up 21.41%
🥈 $WENB — Up 14.03%
🥉 $BLUR — Up 13.28%
🌙 $GLMR — Up 11.11%
💎 $LITEB — Up 8.95%
💚 From INIT's strong move to BLUR and GLMR gaining momentum, these tokens are making a noticeable impact on today's market.
📊 Remember, a green candle is an opportunity to analyze, not a guarantee of further gains. Watch volume, key resistance levels, and your risk before entering any trade.
🔥 Happy Gainer Day, Crypto Family! Which coin do you think will lead the next move? 👇
#Crypto #TopGainers #CryptoMarket #Trading
1
547
·
--
Bullish
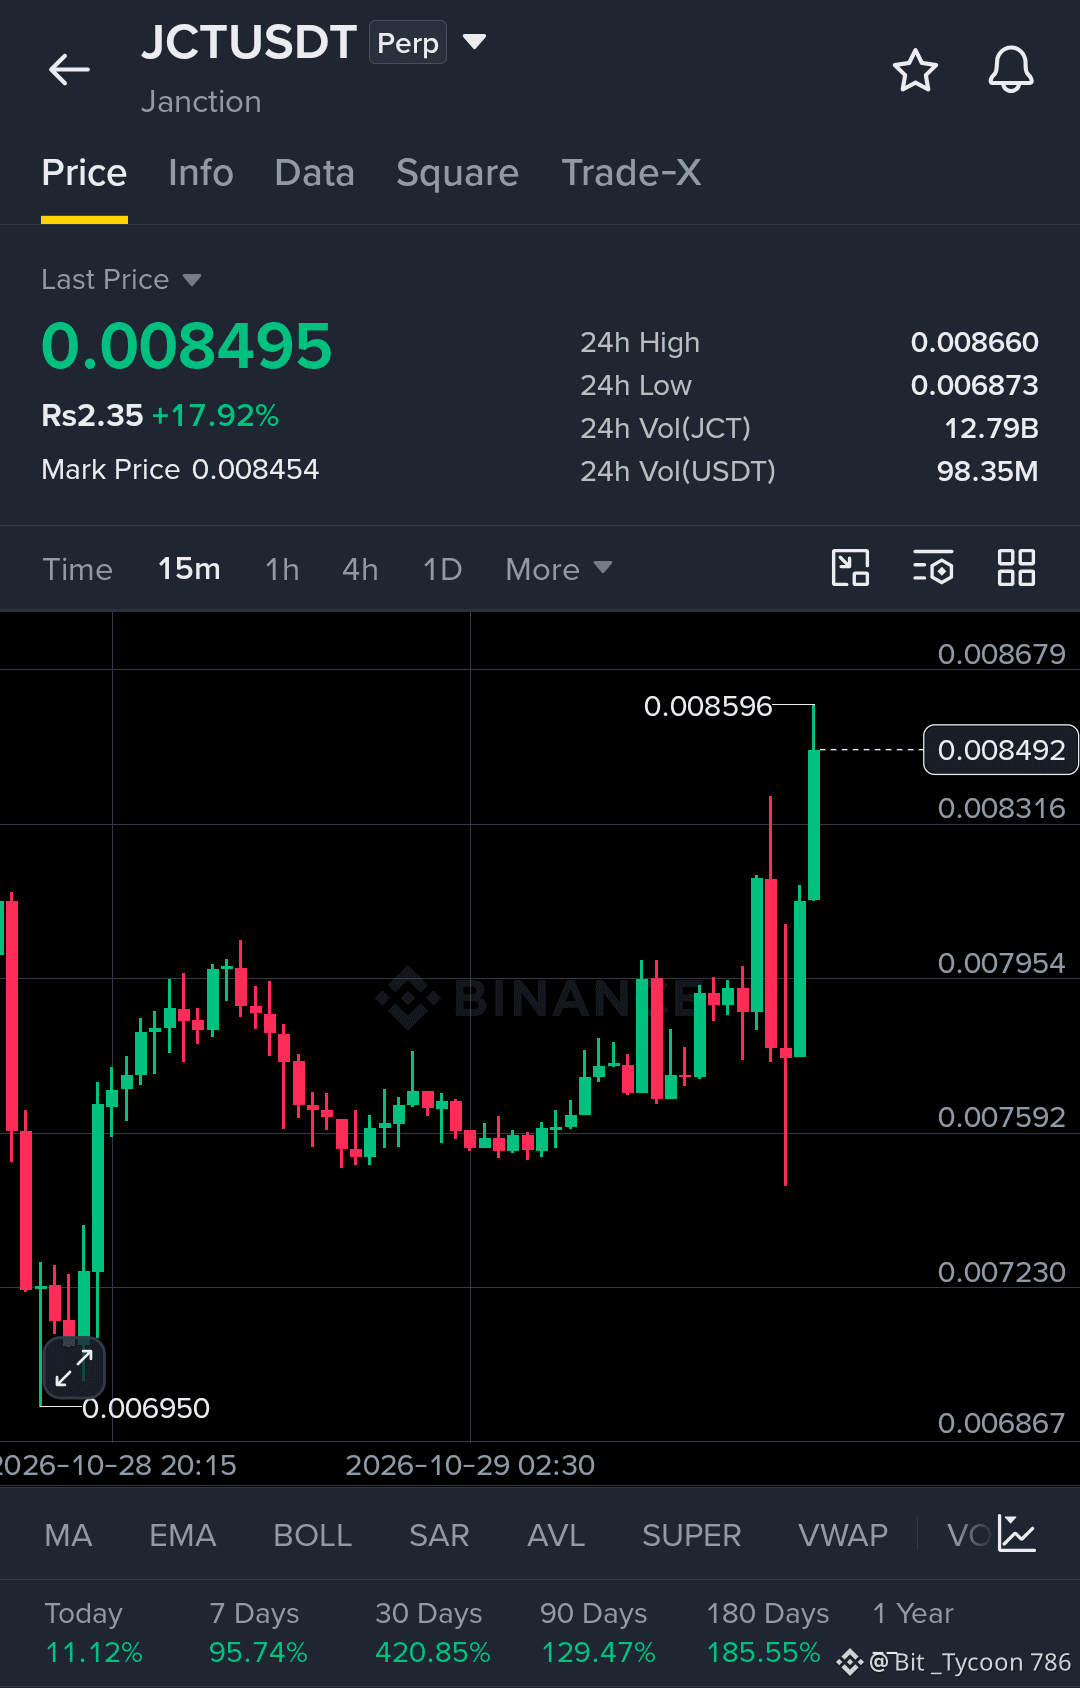
$JCT is showing a strong short-term recovery, trading around 0.008495 USDT, up 17.92% over the past 24 hours. The price has climbed from the 0.006950 low and recently pushed toward 0.008596, showing renewed buying interest after a period of consolidation.
The latest 15-minute candles show an expansion in momentum, with buyers pushing the price above the earlier trading range around 0.00795. However, the move has been sharp, and the recent wicks suggest that volatility remains elevated. Holding the breakout area will be important if the market is to sustain its upward structure.
The immediate resistance zone sits around 0.008596–0.008660. A sustained move above this range could open the way for further upside, while rejection may bring a retest of 0.008316. Below that, 0.007954 is an important support level, followed by the 0.007592 area.
For now, JCT is showing strong short-term momentum, but the next move depends on whether buyers can defend the breakout rather than allowing price to fall back into its previous range. With the 24-hour change already substantial, chasing the latest candle carries added risk. A stable retest, followed by renewed buying and stronger volume, would provide better confirmation of continuation.
{future}(JCTUSDT)
#CanMicrosoftDeliverOnAI #CanGoogleDefindItsCore #EarningsSeason #BitcoinCoreIdentifiesThreeVulnerabilities #StrategyShareholdersApproveDailyDividends
$JCT is showing a strong short-term recovery, trading around 0.008495 USDT, up 17.92% over the past 24 hours. The price has climbed from the 0.006950 low and recently pushed toward 0.008596, showing renewed buying interest after a period of consolidation.
The latest 15-minute candles show an expansion in momentum, with buyers pushing the price above the earlier trading range around 0.00795. However, the move has been sharp, and the recent wicks suggest that volatility remains elevated. Holding the breakout area will be important if the market is to sustain its upward structure.
The immediate resistance zone sits around 0.008596–0.008660. A sustained move above this range could open the way for further upside, while rejection may bring a retest of 0.008316. Below that, 0.007954 is an important support level, followed by the 0.007592 area.
For now, JCT is showing strong short-term momentum, but the next move depends on whether buyers can defend the breakout rather than allowing price to fall back into its previous range. With the 24-hour change already substantial, chasing the latest candle carries added risk. A stable retest, followed by renewed buying and stronger volume, would provide better confirmation of continuation.
#CanMicrosoftDeliverOnAI #CanGoogleDefindItsCore #EarningsSeason #BitcoinCoreIdentifiesThreeVulnerabilities #StrategyShareholdersApproveDailyDividends
378
·
--
Bullish
🚨 JUST IN: 🇺🇸 TRUMP WANTS TO REPLACE “AI” WITH “SUPER INTELLIGENCE”!
President Trump says the U.S. will move to ban the term “Artificial Intelligence” from relevant government documents “in short order,” favoring “Super Intelligence” (SI) instead.
He calls the current name “bad and inaccurate.”
The technology stays the same — but America’s official terminology could change.
AI today. SI tomorrow? The next move could reshape how Washington talks about the future of intelligence.
The world is watching. 🇺🇸

148
Log in to explore more content
Join global crypto users on Binance Square
⚡️ Get latest and useful information about crypto.
💬 Trusted by the world’s largest crypto exchange.
👍 Discover real insights from verified creators.
Email / Phone number