

GetMoney
1.1k Posts

GetMoney
Report
Block User
其实全世界的钱一直藏在你的口袋里

BTC Holder
Frequent Trader
5.4 Years
4 Following
744 Followers
52 Liked
Posts
All
Quotes
·
--
📰 On October 2, BTC ETF and ETH ETF showed completely opposite fund flow directions.
BTC ETF had a single-day net inflow of 1,383 units, worth $120.25 million; over the past 7 days, it accumulated a net inflow of 2,467 units, worth $214.4 million. This buying pace, at least, indicates that capital has not stopped entering BTC ETFs.
🔥 On the other side, ETH ETF saw a single-day net outflow of 234.36 thousand units, worth $64.69 million. Over the past 7 days, it accumulated a net outflow of 8,133 units, worth $22.45 million. The number of units leaving in one day is already clearly higher than the 7-day average pace; the figures do indeed look a bit striking.
To be honest, the most interesting part isn’t just looking at BTC inflows on their own, or only focusing on ETH outflows, but rather the fact that on the same day there was such a pronounced contrast between the two. Funds didn’t withdraw together—they made different choices.
💡 Of course, ETF net inflows and net outflows only reflect changes in daily capital and cannot directly be equated with future price movements. But based on this set of data, BTC ETFs are receiving sustained buying, while ETH ETFs are enduring continuous outflows.
🤔 If you could only choose one, would you rather follow BTC with its ongoing inflows, or treat this large ETH outflow as an opportunity for adjustment?
#BTC #ETH #比特币ETF #Ethereum ETF
📰 On October 2, BTC ETF and ETH ETF showed completely opposite fund flow directions.
BTC ETF had a single-day net inflow of 1,383 units, worth $120.25 million; over the past 7 days, it accumulated a net inflow of 2,467 units, worth $214.4 million. This buying pace, at least, indicates that capital has not stopped entering BTC ETFs.
🔥 On the other side, ETH ETF saw a single-day net outflow of 234.36 thousand units, worth $64.69 million. Over the past 7 days, it accumulated a net outflow of 8,133 units, worth $22.45 million. The number of units leaving in one day is already clearly higher than the 7-day average pace; the figures do indeed look a bit striking.
To be honest, the most interesting part isn’t just looking at BTC inflows on their own, or only focusing on ETH outflows, but rather the fact that on the same day there was such a pronounced contrast between the two. Funds didn’t withdraw together—they made different choices.
💡 Of course, ETF net inflows and net outflows only reflect changes in daily capital and cannot directly be equated with future price movements. But based on this set of data, BTC ETFs are receiving sustained buying, while ETH ETFs are enduring continuous outflows.
🤔 If you could only choose one, would you rather follow BTC with its ongoing inflows, or treat this large ETH outflow as an opportunity for adjustment?
#BTC #ETH #比特币ETF #Ethereum ETF
BTC ETF had a single-day net inflow of 1,383 units, worth $120.25 million; over the past 7 days, it accumulated a net inflow of 2,467 units, worth $214.4 million. This buying pace, at least, indicates that capital has not stopped entering BTC ETFs.
🔥 On the other side, ETH ETF saw a single-day net outflow of 234.36 thousand units, worth $64.69 million. Over the past 7 days, it accumulated a net outflow of 8,133 units, worth $22.45 million. The number of units leaving in one day is already clearly higher than the 7-day average pace; the figures do indeed look a bit striking.
To be honest, the most interesting part isn’t just looking at BTC inflows on their own, or only focusing on ETH outflows, but rather the fact that on the same day there was such a pronounced contrast between the two. Funds didn’t withdraw together—they made different choices.
💡 Of course, ETF net inflows and net outflows only reflect changes in daily capital and cannot directly be equated with future price movements. But based on this set of data, BTC ETFs are receiving sustained buying, while ETH ETFs are enduring continuous outflows.
🤔 If you could only choose one, would you rather follow BTC with its ongoing inflows, or treat this large ETH outflow as an opportunity for adjustment?
#BTC #ETH #比特币ETF #Ethereum ETF

8
·
--
📰 Kalshi has hit the brakes.
The U.S. Commodity Futures Trading Commission (CFTC) is investigating reward programs in prediction markets. It is concerned the platform may use misleading promotions to attract traders, and also worries that cashback, high-volume trading rewards, and market-maker incentives could be used to generate wash trades, potentially even leading to market manipulation. Kalshi has moved up the end date of its trading-volume incentive program to October 13, 2026.
🔥 The tricky part is that these rewards aren’t just side benefits for prediction markets. Order-placement rewards, taker rebates, liquidity incentives, position rewards, and referral rewards are originally key tools for the platform to maintain depth, attract new users, and retain them. When the rewards stop, contracts may become less active, and user experience could deteriorate as well.
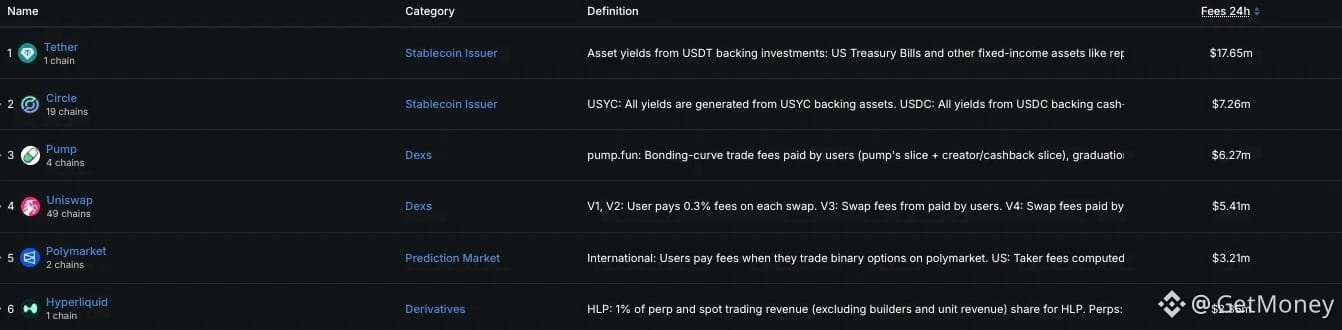
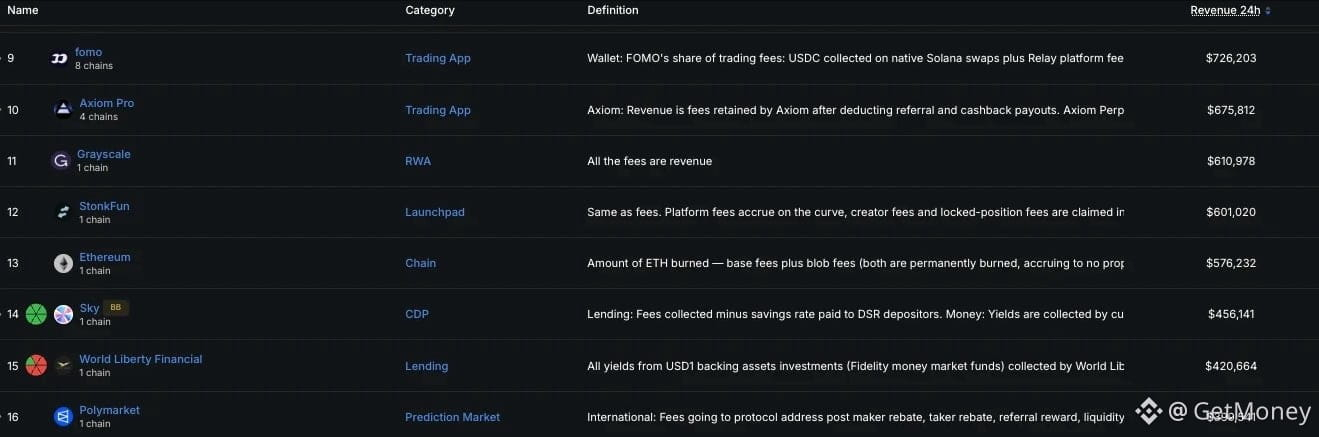
💡 Polymarket’s numbers make the point even clearer. Since it began charging fees in January 2026, the platform has generated about $229 million in trading fees in total, while paying out roughly $128 million in rewards—about 54.3% of trading fees. Of that, daily fees are around $3.21 million, but revenue is only about $0.40 million. Roughly $2.80 million returns to traders and market makers in various forms of rewards.
👀 User growth also coincides with the timing of when rewards were introduced: monthly new users were 233,000 in January 2026, rising to 259,000 in March. However, this doesn’t fully prove that rewards are the only cause—regulatory changes, ad campaigns, and events like the World Cup could also play roles.
🤔 Now that Kalshi has already stopped early, if the CFTC continues to take action, which category of rewards would Polymarket adjust? Do you think prediction markets should buy liquidity with subsidies, or should they reduce incentives directly?
#预测市场 #Kalshi #Polymarket #Regulatory
📰 Kalshi has hit the brakes.
The U.S. Commodity Futures Trading Commission (CFTC) is investigating reward programs in prediction markets. It is concerned the platform may use misleading promotions to attract traders, and also worries that cashback, high-volume trading rewards, and market-maker incentives could be used to generate wash trades, potentially even leading to market manipulation. Kalshi has moved up the end date of its trading-volume incentive program to October 13, 2026.
🔥 The tricky part is that these rewards aren’t just side benefits for prediction markets. Order-placement rewards, taker rebates, liquidity incentives, position rewards, and referral rewards are originally key tools for the platform to maintain depth, attract new users, and retain them. When the rewards stop, contracts may become less active, and user experience could deteriorate as well.
💡 Polymarket’s numbers make the point even clearer. Since it began charging fees in January 2026, the platform has generated about $229 million in trading fees in total, while paying out roughly $128 million in rewards—about 54.3% of trading fees. Of that, daily fees are around $3.21 million, but revenue is only about $0.40 million. Roughly $2.80 million returns to traders and market makers in various forms of rewards.
👀 User growth also coincides with the timing of when rewards were introduced: monthly new users were 233,000 in January 2026, rising to 259,000 in March. However, this doesn’t fully prove that rewards are the only cause—regulatory changes, ad campaigns, and events like the World Cup could also play roles.
🤔 Now that Kalshi has already stopped early, if the CFTC continues to take action, which category of rewards would Polymarket adjust? Do you think prediction markets should buy liquidity with subsidies, or should they reduce incentives directly?
#预测市场 #Kalshi #Polymarket #Regulatory
The U.S. Commodity Futures Trading Commission (CFTC) is investigating reward programs in prediction markets. It is concerned the platform may use misleading promotions to attract traders, and also worries that cashback, high-volume trading rewards, and market-maker incentives could be used to generate wash trades, potentially even leading to market manipulation. Kalshi has moved up the end date of its trading-volume incentive program to October 13, 2026.
🔥 The tricky part is that these rewards aren’t just side benefits for prediction markets. Order-placement rewards, taker rebates, liquidity incentives, position rewards, and referral rewards are originally key tools for the platform to maintain depth, attract new users, and retain them. When the rewards stop, contracts may become less active, and user experience could deteriorate as well.
💡 Polymarket’s numbers make the point even clearer. Since it began charging fees in January 2026, the platform has generated about $229 million in trading fees in total, while paying out roughly $128 million in rewards—about 54.3% of trading fees. Of that, daily fees are around $3.21 million, but revenue is only about $0.40 million. Roughly $2.80 million returns to traders and market makers in various forms of rewards.
👀 User growth also coincides with the timing of when rewards were introduced: monthly new users were 233,000 in January 2026, rising to 259,000 in March. However, this doesn’t fully prove that rewards are the only cause—regulatory changes, ad campaigns, and events like the World Cup could also play roles.
🤔 Now that Kalshi has already stopped early, if the CFTC continues to take action, which category of rewards would Polymarket adjust? Do you think prediction markets should buy liquidity with subsidies, or should they reduce incentives directly?
#预测市场 #Kalshi #Polymarket #Regulatory


8
·
--
📰 This update is pretty simple: ProShares Bitcoin Strategy ETF is up 2.8%, and iShares Bitcoin Trust is up 2.7%.
The two products are performing very similarly—the difference is only 0.1 percentage point. One is a Bitcoin strategy ETF and the other is a Bitcoin trust, with different names and product structures, but this time they both saw synchronized gains.
🔥 To be honest, just looking at this headline alone, the only thing we can confirm is that the related products moved higher. We can’t directly interpret it as a large-scale inflow of capital, and we also can’t conclude from this that they will definitely keep rising. The material doesn’t provide information on fund inflows, trading volume, or changes in holdings—don’t make things up.
💡 What’s more interesting is that traditional-market Bitcoin-related products are being compared side by side. ProShares and iShares are both up at the same time, which at least suggests that these two products had the same directional trend over this period.
🤔 Are you more focused on Bitcoin spot trusts, or on ETFs with strategy attributes?
#比特币ETF #比特币信托 #加密市场 #BTC
📰 This update is pretty simple: ProShares Bitcoin Strategy ETF is up 2.8%, and iShares Bitcoin Trust is up 2.7%.
The two products are performing very similarly—the difference is only 0.1 percentage point. One is a Bitcoin strategy ETF and the other is a Bitcoin trust, with different names and product structures, but this time they both saw synchronized gains.
🔥 To be honest, just looking at this headline alone, the only thing we can confirm is that the related products moved higher. We can’t directly interpret it as a large-scale inflow of capital, and we also can’t conclude from this that they will definitely keep rising. The material doesn’t provide information on fund inflows, trading volume, or changes in holdings—don’t make things up.
💡 What’s more interesting is that traditional-market Bitcoin-related products are being compared side by side. ProShares and iShares are both up at the same time, which at least suggests that these two products had the same directional trend over this period.
🤔 Are you more focused on Bitcoin spot trusts, or on ETFs with strategy attributes?
#比特币ETF #比特币信托 #加密市场 #BTC
The two products are performing very similarly—the difference is only 0.1 percentage point. One is a Bitcoin strategy ETF and the other is a Bitcoin trust, with different names and product structures, but this time they both saw synchronized gains.
🔥 To be honest, just looking at this headline alone, the only thing we can confirm is that the related products moved higher. We can’t directly interpret it as a large-scale inflow of capital, and we also can’t conclude from this that they will definitely keep rising. The material doesn’t provide information on fund inflows, trading volume, or changes in holdings—don’t make things up.
💡 What’s more interesting is that traditional-market Bitcoin-related products are being compared side by side. ProShares and iShares are both up at the same time, which at least suggests that these two products had the same directional trend over this period.
🤔 Are you more focused on Bitcoin spot trusts, or on ETFs with strategy attributes?
#比特币ETF #比特币信托 #加密市场 #BTC

135
·
--
📰 Evening BTC report: 86416.01 USDT, up 2.98% over the past 24h. This move isn’t small. The overall market for major coins is still on the strong side.
🔥 But today, the real highlight wasn’t BTC—it was SAND, which surged 66.95% in a single day. PNT is also up 45.23%, and GTC is up 23.12%. The gainers list is clearly much more lively than the broader market.
Honestly, the divergence between winners and losers is a bit extreme. Some are being aggressively pumped, while others get dumped outright. NFP is down 65.85%, and BETA is down 64.00%—the gap is no longer just a little difference.
🤔 The most critical question now is whether BTC can keep its upward momentum steady, or whether capital has started rotating back into smaller coins. Tonight, do you want to hold BTC, or go after strong names like SAND?
#BTC #SAND #加密市场 # Evening Market
📰 Evening BTC report: 86416.01 USDT, up 2.98% over the past 24h. This move isn’t small. The overall market for major coins is still on the strong side.
🔥 But today, the real highlight wasn’t BTC—it was SAND, which surged 66.95% in a single day. PNT is also up 45.23%, and GTC is up 23.12%. The gainers list is clearly much more lively than the broader market.
Honestly, the divergence between winners and losers is a bit extreme. Some are being aggressively pumped, while others get dumped outright. NFP is down 65.85%, and BETA is down 64.00%—the gap is no longer just a little difference.
🤔 The most critical question now is whether BTC can keep its upward momentum steady, or whether capital has started rotating back into smaller coins. Tonight, do you want to hold BTC, or go after strong names like SAND?
#BTC #SAND #加密市场 # Evening Market
🔥 But today, the real highlight wasn’t BTC—it was SAND, which surged 66.95% in a single day. PNT is also up 45.23%, and GTC is up 23.12%. The gainers list is clearly much more lively than the broader market.
Honestly, the divergence between winners and losers is a bit extreme. Some are being aggressively pumped, while others get dumped outright. NFP is down 65.85%, and BETA is down 64.00%—the gap is no longer just a little difference.
🤔 The most critical question now is whether BTC can keep its upward momentum steady, or whether capital has started rotating back into smaller coins. Tonight, do you want to hold BTC, or go after strong names like SAND?
#BTC #SAND #加密市场 # Evening Market
1
·
--
📰 CryptoQuant analyst Darkfost said that BTC is approaching a cost basis dense zone: the group holding for 18 months to 2 years has an average cost of about 88,350 USDT; the group holding for 6 to 12 months has an average cost of about 89,200 USDT.
🔥 The costs of these two groups are quite close to each other, so what’s truly being tested isn’t just the price itself, but also the patience of the holders. Especially for the 6- to 12-month cohort, they are already down by nearly a year overall, and some of them may have bought near the market top.
💡 But first, it’s important to clarify that the cost basis is not a support level or a resistance level—it’s only an average. Thinking of it as “if it reaches this area, it will definitely rebound” or “if it touches it, it will definitely drop” can make the situation too simple.
Honestly, once BTC gets close to this region, holders’ decisions will become more polarized: some may not be able to withstand the pressure and exit first; others may continue buying to try to lower their average cost and return to profitability. When these two behaviors overlap, they could disrupt the upward momentum BTC has been building.
🤔 So this test is more like a contest of patience among holders: do you think these mid-term holders will choose to cut losses and exit, or keep adding positions to average down?
#BTC #比特币 #链上数据 #加密市场
📰 CryptoQuant analyst Darkfost said that BTC is approaching a cost basis dense zone: the group holding for 18 months to 2 years has an average cost of about 88,350 USDT; the group holding for 6 to 12 months has an average cost of about 89,200 USDT.
🔥 The costs of these two groups are quite close to each other, so what’s truly being tested isn’t just the price itself, but also the patience of the holders. Especially for the 6- to 12-month cohort, they are already down by nearly a year overall, and some of them may have bought near the market top.
💡 But first, it’s important to clarify that the cost basis is not a support level or a resistance level—it’s only an average. Thinking of it as “if it reaches this area, it will definitely rebound” or “if it touches it, it will definitely drop” can make the situation too simple.
Honestly, once BTC gets close to this region, holders’ decisions will become more polarized: some may not be able to withstand the pressure and exit first; others may continue buying to try to lower their average cost and return to profitability. When these two behaviors overlap, they could disrupt the upward momentum BTC has been building.
🤔 So this test is more like a contest of patience among holders: do you think these mid-term holders will choose to cut losses and exit, or keep adding positions to average down?
#BTC #比特币 #链上数据 #加密市场
🔥 The costs of these two groups are quite close to each other, so what’s truly being tested isn’t just the price itself, but also the patience of the holders. Especially for the 6- to 12-month cohort, they are already down by nearly a year overall, and some of them may have bought near the market top.
💡 But first, it’s important to clarify that the cost basis is not a support level or a resistance level—it’s only an average. Thinking of it as “if it reaches this area, it will definitely rebound” or “if it touches it, it will definitely drop” can make the situation too simple.
Honestly, once BTC gets close to this region, holders’ decisions will become more polarized: some may not be able to withstand the pressure and exit first; others may continue buying to try to lower their average cost and return to profitability. When these two behaviors overlap, they could disrupt the upward momentum BTC has been building.
🤔 So this test is more like a contest of patience among holders: do you think these mid-term holders will choose to cut losses and exit, or keep adding positions to average down?
#BTC #比特币 #链上数据 #加密市场

50
·
--
📰 In this issue of the RWA Weekly, what’s most interesting isn’t the market cap—it’s the fact that traditional finance is truly moving money on-chain. When the Hong Kong SAR government issued around HK$20 billion worth of digitally issued green bonds, it introduced Hong Kong dollar tokenized deposits into the HKD bond primary issuance and settlement process—an early global example of a digital bond using this approach.
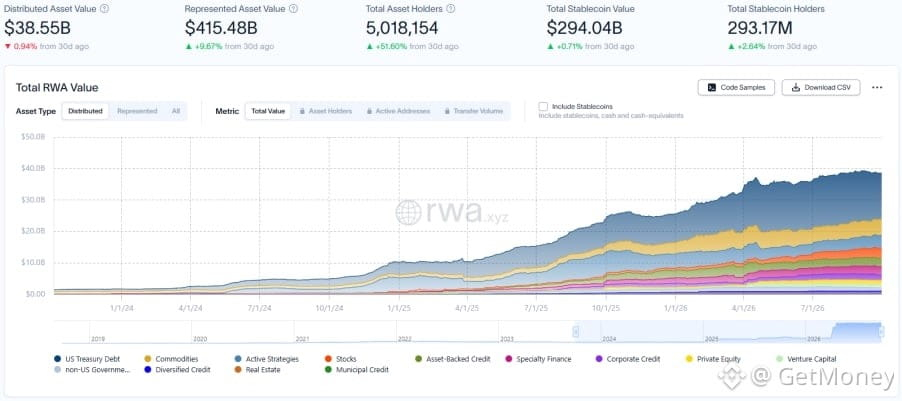
🔥 The data is also a bit counterintuitive: the total market cap of RWA on-chain fell to $38.55 billion, down 0.94% month-over-month, but asset holders rose to 5.0182 million, up 51.6% month-over-month. To be honest, the scale is shrinking temporarily, while users are increasing fast—suggesting new capital and new users are still coming in.
💡 This time, Aave V4 launched the Equities Hub on Base, starting to support lending against tokenized U.S. equities as collateral using USDC, giving RWA and DeFi lending a more direct connection. Ethena also included tokenized stocks into USDe’s yield-support strategy—market playbooks are becoming more complex.
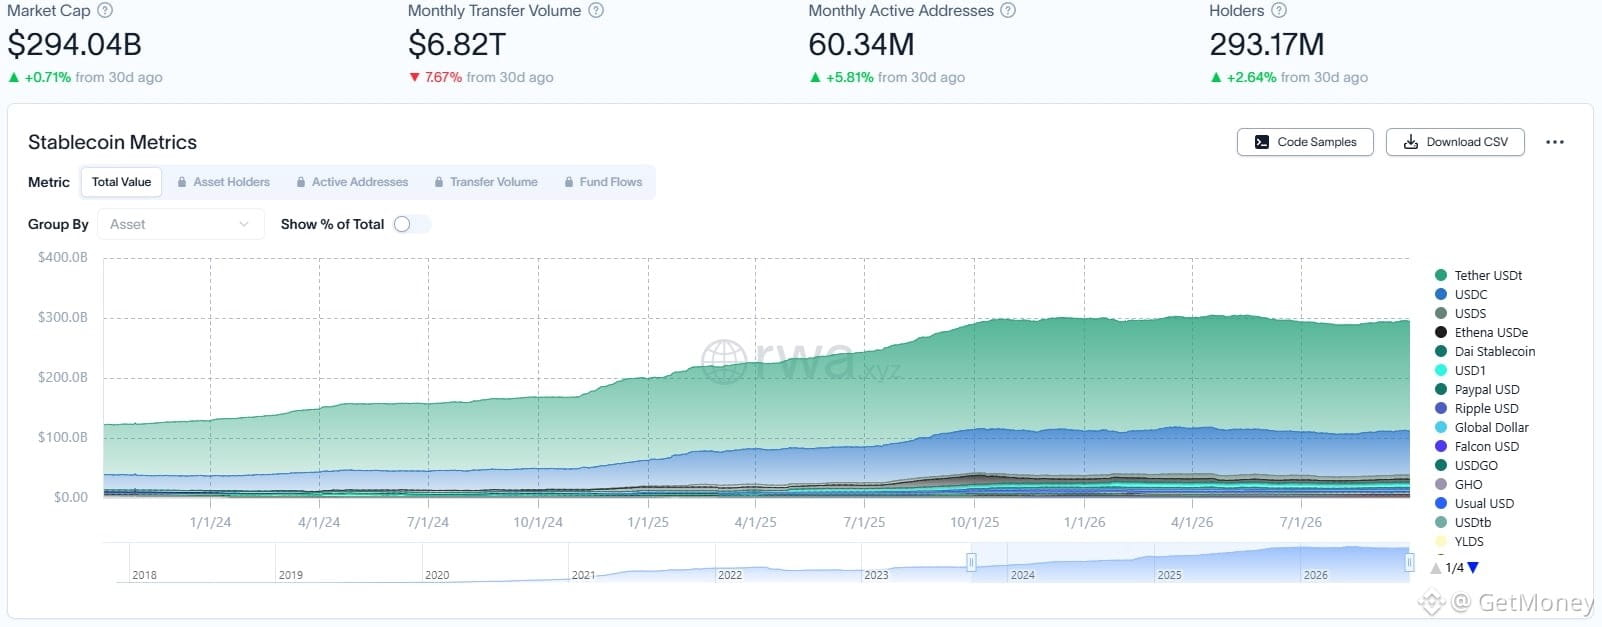
👀 On the stablecoin side, total market cap reached $294.04 billion, and holders rose to 293 million, but monthly transfer volume dropped to $68.2 billion. In reality, users are still increasing; it’s just that short-term capital transfers haven’t sped up in tandem. On top of that, Stripe-led USD stablecoin OUSD has officially launched—actions by payment companies entering the space are becoming increasingly obvious.
🤔 Regulation is also laying the groundwork: the U.S. SEC is discussing a ZK identity framework that supports KYC once and works across multiple platforms, while South Korea plans to include stocks, bonds, and funds within the scope of tokenized securities. Honestly, what will ultimately determine whether RWA can go far may not be whether a specific project’s price is up or down—it’s more about when these assets can be used conveniently by everyday people. Which do you think will be the first to go mainstream: tokenized bonds, tokenized stocks, or stablecoin payments?
#RWA #稳定币 #代币化资产 #DeFi
📰 In this issue of the RWA Weekly, what’s most interesting isn’t the market cap—it’s the fact that traditional finance is truly moving money on-chain. When the Hong Kong SAR government issued around HK$20 billion worth of digitally issued green bonds, it introduced Hong Kong dollar tokenized deposits into the HKD bond primary issuance and settlement process—an early global example of a digital bond using this approach.
🔥 The data is also a bit counterintuitive: the total market cap of RWA on-chain fell to $38.55 billion, down 0.94% month-over-month, but asset holders rose to 5.0182 million, up 51.6% month-over-month. To be honest, the scale is shrinking temporarily, while users are increasing fast—suggesting new capital and new users are still coming in.
💡 This time, Aave V4 launched the Equities Hub on Base, starting to support lending against tokenized U.S. equities as collateral using USDC, giving RWA and DeFi lending a more direct connection. Ethena also included tokenized stocks into USDe’s yield-support strategy—market playbooks are becoming more complex.
👀 On the stablecoin side, total market cap reached $294.04 billion, and holders rose to 293 million, but monthly transfer volume dropped to $68.2 billion. In reality, users are still increasing; it’s just that short-term capital transfers haven’t sped up in tandem. On top of that, Stripe-led USD stablecoin OUSD has officially launched—actions by payment companies entering the space are becoming increasingly obvious.
🤔 Regulation is also laying the groundwork: the U.S. SEC is discussing a ZK identity framework that supports KYC once and works across multiple platforms, while South Korea plans to include stocks, bonds, and funds within the scope of tokenized securities. Honestly, what will ultimately determine whether RWA can go far may not be whether a specific project’s price is up or down—it’s more about when these assets can be used conveniently by everyday people. Which do you think will be the first to go mainstream: tokenized bonds, tokenized stocks, or stablecoin payments?
#RWA #稳定币 #代币化资产 #DeFi
🔥 The data is also a bit counterintuitive: the total market cap of RWA on-chain fell to $38.55 billion, down 0.94% month-over-month, but asset holders rose to 5.0182 million, up 51.6% month-over-month. To be honest, the scale is shrinking temporarily, while users are increasing fast—suggesting new capital and new users are still coming in.
💡 This time, Aave V4 launched the Equities Hub on Base, starting to support lending against tokenized U.S. equities as collateral using USDC, giving RWA and DeFi lending a more direct connection. Ethena also included tokenized stocks into USDe’s yield-support strategy—market playbooks are becoming more complex.
👀 On the stablecoin side, total market cap reached $294.04 billion, and holders rose to 293 million, but monthly transfer volume dropped to $68.2 billion. In reality, users are still increasing; it’s just that short-term capital transfers haven’t sped up in tandem. On top of that, Stripe-led USD stablecoin OUSD has officially launched—actions by payment companies entering the space are becoming increasingly obvious.
🤔 Regulation is also laying the groundwork: the U.S. SEC is discussing a ZK identity framework that supports KYC once and works across multiple platforms, while South Korea plans to include stocks, bonds, and funds within the scope of tokenized securities. Honestly, what will ultimately determine whether RWA can go far may not be whether a specific project’s price is up or down—it’s more about when these assets can be used conveniently by everyday people. Which do you think will be the first to go mainstream: tokenized bonds, tokenized stocks, or stablecoin payments?
#RWA #稳定币 #代币化资产 #DeFi

48
·
--
📰 In this round of Bitcoin’s rise, QCP believes it was mainly driven by capital flows rather than sudden runaway inflation. Real interest rates rose by 44 bps in September, but breakeven inflation barely moved. Behind it is more like strengthening growth expectations, increased Treasury supply, plus weak auctions—all forcing the market to clear at higher real yields.
🔥 What’s interesting is that gold and Bitcoin moved in opposite directions this time. Gold fell 8.5% for the month, while Bitcoin rose 12%. This suggests capital didn’t fully retreat from risk assets; instead, it concentrated into assets that both have supportive regulatory developments and technical backing.
💰 Spot ETFs saw inflows of $3.5 billion in August and $2.6 billion in September—this is definitely strong. Add to that the SEC exemption granted on September 17, which QCP views as the first genuinely meaningful regulatory push after the Clarity Act was dealt a setback. However, the market-structure legislation has been pushed back to 2027, so there’s both near-term tailwind and long-term waiting.
👀 The options market is also a bit intriguing: clients are rolling October’s $90,000 call options into November. Since November will coincide with midterm elections, the Treasury refinancing, and the December Fed meeting, it seems funds are preparing for a longer trading window.
🤔 But there’s one hard test ahead: the Nonfarm Payrolls report. Bitcoin probed down to $82,500 three times this week but didn’t break it. $87,400 is the threshold on the way to $90,000. To be honest, after this data is released, will the market keep buying on capital flows—or will it return to the line of real interest rates? Which do you think is more crucial?
#BTC #比特币 #现货ETF #US Federal Reserve
📰 In this round of Bitcoin’s rise, QCP believes it was mainly driven by capital flows rather than sudden runaway inflation. Real interest rates rose by 44 bps in September, but breakeven inflation barely moved. Behind it is more like strengthening growth expectations, increased Treasury supply, plus weak auctions—all forcing the market to clear at higher real yields.
🔥 What’s interesting is that gold and Bitcoin moved in opposite directions this time. Gold fell 8.5% for the month, while Bitcoin rose 12%. This suggests capital didn’t fully retreat from risk assets; instead, it concentrated into assets that both have supportive regulatory developments and technical backing.
💰 Spot ETFs saw inflows of $3.5 billion in August and $2.6 billion in September—this is definitely strong. Add to that the SEC exemption granted on September 17, which QCP views as the first genuinely meaningful regulatory push after the Clarity Act was dealt a setback. However, the market-structure legislation has been pushed back to 2027, so there’s both near-term tailwind and long-term waiting.
👀 The options market is also a bit intriguing: clients are rolling October’s $90,000 call options into November. Since November will coincide with midterm elections, the Treasury refinancing, and the December Fed meeting, it seems funds are preparing for a longer trading window.
🤔 But there’s one hard test ahead: the Nonfarm Payrolls report. Bitcoin probed down to $82,500 three times this week but didn’t break it. $87,400 is the threshold on the way to $90,000. To be honest, after this data is released, will the market keep buying on capital flows—or will it return to the line of real interest rates? Which do you think is more crucial?
#BTC #比特币 #现货ETF #US Federal Reserve
🔥 What’s interesting is that gold and Bitcoin moved in opposite directions this time. Gold fell 8.5% for the month, while Bitcoin rose 12%. This suggests capital didn’t fully retreat from risk assets; instead, it concentrated into assets that both have supportive regulatory developments and technical backing.
💰 Spot ETFs saw inflows of $3.5 billion in August and $2.6 billion in September—this is definitely strong. Add to that the SEC exemption granted on September 17, which QCP views as the first genuinely meaningful regulatory push after the Clarity Act was dealt a setback. However, the market-structure legislation has been pushed back to 2027, so there’s both near-term tailwind and long-term waiting.
👀 The options market is also a bit intriguing: clients are rolling October’s $90,000 call options into November. Since November will coincide with midterm elections, the Treasury refinancing, and the December Fed meeting, it seems funds are preparing for a longer trading window.
🤔 But there’s one hard test ahead: the Nonfarm Payrolls report. Bitcoin probed down to $82,500 three times this week but didn’t break it. $87,400 is the threshold on the way to $90,000. To be honest, after this data is released, will the market keep buying on capital flows—or will it return to the line of real interest rates? Which do you think is more crucial?
#BTC #比特币 #现货ETF #US Federal Reserve

115
·
--
📰 The most eye-catching news today is still that Anthropic may be considering an IPO. Bloomberg reports that formal marketing could begin as early as mid-November, with the goal of listing before Thanksgiving, and a potential valuation of about $1.8 trillion to $2.0 trillion. However, the timeline is still under discussion—whether it can land on this schedule remains to be seen.
🔥 On the other side, Hyperliquid is expected to receive its first AQAv2 reserve earnings distribution tomorrow. Passive income of roughly $14.5 million generated from the USDC reserves will flow into the Assistance Fund, which will be used to repurchase HYPE. The highlight here is very straightforward: protocol revenue starts flowing back into the token mechanism through buybacks.
💡 A new proposal from the NEAR community is also quite interesting. It plans to use 24 months to gradually reduce NEAR’s maximum annual token issuance rate from 2.5% down to 1.6%. This is currently just a community proposal and not a final outcome, but adjustments on the supply side will indeed affect the timing of subsequent token unlocks.
⚠️ Security incidents can’t be ignored either. Aave’s founder said the issue lies with a third-party external adapter built on top of Aave v3—Aave v3 contracts themselves were not affected. SlowMist adds that the attacker exploited an access-control vulnerability and stole approximately 114.09 ETH. Honestly, the more modules and external tools there are, the harder it is for users to judge risk based solely on the name of the main protocol.
🤔 Among these today, which do you care about more: Anthropic’s massive-scale IPO, or Hyperliquid’s buyback arrangement?
#加密市场 #Anthropic #Hyperliquid #NEAR
📰 The most eye-catching news today is still that Anthropic may be considering an IPO. Bloomberg reports that formal marketing could begin as early as mid-November, with the goal of listing before Thanksgiving, and a potential valuation of about $1.8 trillion to $2.0 trillion. However, the timeline is still under discussion—whether it can land on this schedule remains to be seen.
🔥 On the other side, Hyperliquid is expected to receive its first AQAv2 reserve earnings distribution tomorrow. Passive income of roughly $14.5 million generated from the USDC reserves will flow into the Assistance Fund, which will be used to repurchase HYPE. The highlight here is very straightforward: protocol revenue starts flowing back into the token mechanism through buybacks.
💡 A new proposal from the NEAR community is also quite interesting. It plans to use 24 months to gradually reduce NEAR’s maximum annual token issuance rate from 2.5% down to 1.6%. This is currently just a community proposal and not a final outcome, but adjustments on the supply side will indeed affect the timing of subsequent token unlocks.
⚠️ Security incidents can’t be ignored either. Aave’s founder said the issue lies with a third-party external adapter built on top of Aave v3—Aave v3 contracts themselves were not affected. SlowMist adds that the attacker exploited an access-control vulnerability and stole approximately 114.09 ETH. Honestly, the more modules and external tools there are, the harder it is for users to judge risk based solely on the name of the main protocol.
🤔 Among these today, which do you care about more: Anthropic’s massive-scale IPO, or Hyperliquid’s buyback arrangement?
#加密市场 #Anthropic #Hyperliquid #NEAR
🔥 On the other side, Hyperliquid is expected to receive its first AQAv2 reserve earnings distribution tomorrow. Passive income of roughly $14.5 million generated from the USDC reserves will flow into the Assistance Fund, which will be used to repurchase HYPE. The highlight here is very straightforward: protocol revenue starts flowing back into the token mechanism through buybacks.
💡 A new proposal from the NEAR community is also quite interesting. It plans to use 24 months to gradually reduce NEAR’s maximum annual token issuance rate from 2.5% down to 1.6%. This is currently just a community proposal and not a final outcome, but adjustments on the supply side will indeed affect the timing of subsequent token unlocks.
⚠️ Security incidents can’t be ignored either. Aave’s founder said the issue lies with a third-party external adapter built on top of Aave v3—Aave v3 contracts themselves were not affected. SlowMist adds that the attacker exploited an access-control vulnerability and stole approximately 114.09 ETH. Honestly, the more modules and external tools there are, the harder it is for users to judge risk based solely on the name of the main protocol.
🤔 Among these today, which do you care about more: Anthropic’s massive-scale IPO, or Hyperliquid’s buyback arrangement?
#加密市场 #Anthropic #Hyperliquid #NEAR

306
·
--
📰 USDT plans to return to the Bitcoin network this month. It first came into being in 2014 via the Omni protocol, and later the focus shifted toward Ethereum and Tron. Today, its market cap is approaching $19 billion. Tether CEO Paolo Ardoino directly calls this return “it’s home.”
🔥 Responsible for execution is Utexo. The company was founded in 2025. Earlier this year, it completed a $7.5 million funding round led by Tether, and has already obtained the commercial license to issue USDT on Bitcoin.
💡 What’s really interesting is how it’s done. Utexo uses the RGB protocol and client-side verification. Transaction details are stored off-chain between the parties, while the Bitcoin ledger only uses cryptographic proofs to confirm ownership. The assets ultimately anchor to UTXOs.
👀 This setup supports private USDT transfers, direct swapping between native BTC and USDT, and even collateralized lending using native Bitcoin. It doesn’t require cross-chain wrapping like WBTC does. Honestly, this is far more interesting than simply “supporting another chain.”
🤔 But compliance handling has changed too: Utexo can’t directly freeze assets the way Tether can freeze Ethereum addresses. Instead, it can maintain a blacklist of relevant UTXOs and distribute it to exchanges and other institutions so those assets can’t be redeemed. Private transfers and blacklist redemption coexist—do you think users will accept this balance?
#USDT #比特币 #RGB #stablecoin
📰 USDT plans to return to the Bitcoin network this month. It first came into being in 2014 via the Omni protocol, and later the focus shifted toward Ethereum and Tron. Today, its market cap is approaching $19 billion. Tether CEO Paolo Ardoino directly calls this return “it’s home.”
🔥 Responsible for execution is Utexo. The company was founded in 2025. Earlier this year, it completed a $7.5 million funding round led by Tether, and has already obtained the commercial license to issue USDT on Bitcoin.
💡 What’s really interesting is how it’s done. Utexo uses the RGB protocol and client-side verification. Transaction details are stored off-chain between the parties, while the Bitcoin ledger only uses cryptographic proofs to confirm ownership. The assets ultimately anchor to UTXOs.
👀 This setup supports private USDT transfers, direct swapping between native BTC and USDT, and even collateralized lending using native Bitcoin. It doesn’t require cross-chain wrapping like WBTC does. Honestly, this is far more interesting than simply “supporting another chain.”
🤔 But compliance handling has changed too: Utexo can’t directly freeze assets the way Tether can freeze Ethereum addresses. Instead, it can maintain a blacklist of relevant UTXOs and distribute it to exchanges and other institutions so those assets can’t be redeemed. Private transfers and blacklist redemption coexist—do you think users will accept this balance?
#USDT #比特币 #RGB #stablecoin
🔥 Responsible for execution is Utexo. The company was founded in 2025. Earlier this year, it completed a $7.5 million funding round led by Tether, and has already obtained the commercial license to issue USDT on Bitcoin.
💡 What’s really interesting is how it’s done. Utexo uses the RGB protocol and client-side verification. Transaction details are stored off-chain between the parties, while the Bitcoin ledger only uses cryptographic proofs to confirm ownership. The assets ultimately anchor to UTXOs.
👀 This setup supports private USDT transfers, direct swapping between native BTC and USDT, and even collateralized lending using native Bitcoin. It doesn’t require cross-chain wrapping like WBTC does. Honestly, this is far more interesting than simply “supporting another chain.”
🤔 But compliance handling has changed too: Utexo can’t directly freeze assets the way Tether can freeze Ethereum addresses. Instead, it can maintain a blacklist of relevant UTXOs and distribute it to exchanges and other institutions so those assets can’t be redeemed. Private transfers and blacklist redemption coexist—do you think users will accept this balance?
#USDT #比特币 #RGB #stablecoin

83
·
--
📰 BTC futures market suddenly heats up. Data from crypto analyst Axel Adler Jr. shows that the futures buying pressure indicator has risen to 4.9, the highest level since August 19.
🔥 In the same period, open interest for the concurrent contracts increased by nearly 9,000 BTC within 24 hours. More importantly, over the past 12 hours, cumulative buying pressure has been higher by almost five standard deviations than the average level over the past week, suggesting that this inflow of funds has been quite concentrated.
Honestly, strong buy-side demand is of course a good sign, but with open interest rising quickly at the same time, it also means a lot of new long positions have piled up on the exchange. If the uptrend goes smoothly, prices may be pushed higher faster; but if the direction reverses, liquidation could trigger a chain reaction.
💡 Axel Adler Jr.’s assessment is straightforward: if BTC can still hold above $85,000 after the upward momentum cools, the rally could continue; if it breaks below $83,000, the closing of newly opened long positions could accelerate the drop.
🤔 Right now, it really comes down to whether the new longs can withstand the pullback. Would you treat $85,000 as the line in terms of strength, or are you more focused on the risk of long liquidations near $83,000?
#BTC #比特币 #合约市场 #crypto market
📰 BTC futures market suddenly heats up. Data from crypto analyst Axel Adler Jr. shows that the futures buying pressure indicator has risen to 4.9, the highest level since August 19.
🔥 In the same period, open interest for the concurrent contracts increased by nearly 9,000 BTC within 24 hours. More importantly, over the past 12 hours, cumulative buying pressure has been higher by almost five standard deviations than the average level over the past week, suggesting that this inflow of funds has been quite concentrated.
Honestly, strong buy-side demand is of course a good sign, but with open interest rising quickly at the same time, it also means a lot of new long positions have piled up on the exchange. If the uptrend goes smoothly, prices may be pushed higher faster; but if the direction reverses, liquidation could trigger a chain reaction.
💡 Axel Adler Jr.’s assessment is straightforward: if BTC can still hold above $85,000 after the upward momentum cools, the rally could continue; if it breaks below $83,000, the closing of newly opened long positions could accelerate the drop.
🤔 Right now, it really comes down to whether the new longs can withstand the pullback. Would you treat $85,000 as the line in terms of strength, or are you more focused on the risk of long liquidations near $83,000?
#BTC #比特币 #合约市场 #crypto market
🔥 In the same period, open interest for the concurrent contracts increased by nearly 9,000 BTC within 24 hours. More importantly, over the past 12 hours, cumulative buying pressure has been higher by almost five standard deviations than the average level over the past week, suggesting that this inflow of funds has been quite concentrated.
Honestly, strong buy-side demand is of course a good sign, but with open interest rising quickly at the same time, it also means a lot of new long positions have piled up on the exchange. If the uptrend goes smoothly, prices may be pushed higher faster; but if the direction reverses, liquidation could trigger a chain reaction.
💡 Axel Adler Jr.’s assessment is straightforward: if BTC can still hold above $85,000 after the upward momentum cools, the rally could continue; if it breaks below $83,000, the closing of newly opened long positions could accelerate the drop.
🤔 Right now, it really comes down to whether the new longs can withstand the pullback. Would you treat $85,000 as the line in terms of strength, or are you more focused on the risk of long liquidations near $83,000?
#BTC #比特币 #合约市场 #crypto market

96
·
--
📰 Well-known trader Killa directly points to a reasonable BTC dip-buying area near $82,500. He believes the trend has clearly shifted, but the market is still in the peak phase of the “doubting bull market,” so any pullback could be treated as a buying opportunity.
🔥 His reasoning comes from the 2023 bull run: when the price sweeps down, and the market has confirmed it and formed a low point that shows support, the deepest break is about 8%. In some cases, it only deviates downward by roughly 4%–5%, then quickly rallies again.
💡 Based on Killa’s assessment, the currently “established low” is $82,500. In other words, he doesn’t think the pullback will necessarily stop exactly here, but he expects that even if it briefly breaks below, the downside deviation won’t be very large.
Honestly, this view is worth considering, but you can’t copy the homework directly. Killa focuses on BTC quantitative trading and has over 200,000 followers on X. He previously predicted the top of this bull cycle in May 2025, shorted near $74,688 in mid-April, and then flipped to go long when the market broadly fell on June 5.
🤔 If BTC retests $82,500 again, would you buy in batches immediately, or wait until it drops 4%–5% before acting?
#BTC #比特币 #交易策略 #加密市场
📰 Well-known trader Killa directly points to a reasonable BTC dip-buying area near $82,500. He believes the trend has clearly shifted, but the market is still in the peak phase of the “doubting bull market,” so any pullback could be treated as a buying opportunity.
🔥 His reasoning comes from the 2023 bull run: when the price sweeps down, and the market has confirmed it and formed a low point that shows support, the deepest break is about 8%. In some cases, it only deviates downward by roughly 4%–5%, then quickly rallies again.
💡 Based on Killa’s assessment, the currently “established low” is $82,500. In other words, he doesn’t think the pullback will necessarily stop exactly here, but he expects that even if it briefly breaks below, the downside deviation won’t be very large.
Honestly, this view is worth considering, but you can’t copy the homework directly. Killa focuses on BTC quantitative trading and has over 200,000 followers on X. He previously predicted the top of this bull cycle in May 2025, shorted near $74,688 in mid-April, and then flipped to go long when the market broadly fell on June 5.
🤔 If BTC retests $82,500 again, would you buy in batches immediately, or wait until it drops 4%–5% before acting?
#BTC #比特币 #交易策略 #加密市场
🔥 His reasoning comes from the 2023 bull run: when the price sweeps down, and the market has confirmed it and formed a low point that shows support, the deepest break is about 8%. In some cases, it only deviates downward by roughly 4%–5%, then quickly rallies again.
💡 Based on Killa’s assessment, the currently “established low” is $82,500. In other words, he doesn’t think the pullback will necessarily stop exactly here, but he expects that even if it briefly breaks below, the downside deviation won’t be very large.
Honestly, this view is worth considering, but you can’t copy the homework directly. Killa focuses on BTC quantitative trading and has over 200,000 followers on X. He previously predicted the top of this bull cycle in May 2025, shorted near $74,688 in mid-April, and then flipped to go long when the market broadly fell on June 5.
🤔 If BTC retests $82,500 again, would you buy in batches immediately, or wait until it drops 4%–5% before acting?
#BTC #比特币 #交易策略 #加密市场

61
·
--
📰 The actions of giant whales moving stablecoins to Binance have become noticeably more frequent. Data from CryptoQuant analyst Darkfost shows that for whale addresses with individual transfers exceeding $1 million, the cumulative stablecoin inflow over the past 30 days has risen from $21.7 billion to $30.5 billion—an increase of more than 40% in just over a month.
🔥 When funds of this kind go into trading platforms, they are typically interpreted as positioning in advance, which could later develop into potential buy pressure. To be honest, it’s better for the money to show up first than for funds to keep withdrawing—but between “moving in” and “actually buying,” there still needs to be some distance.
💡 Previously, whale stablecoin inflows once exceeded $61 billion, and then went through a longer period of decline. Now, although they’ve started to rebound, there’s still a gap from that level—so it looks more like big capital is testing the waters again rather than having fully moved in.
👀 Darkfost also noted that whales remain somewhat cautious. On one side are market expectations for an “October rally,” and on the other are factors like ongoing conflicts, inflation pressures, and continually rising bond yields. Either way, the money is back, but pressing the buy button isn’t quite as straightforward.
🤔 If whale stablecoin inflows continue to increase going forward, would you treat it as a signal of early positioning, or wait until on-chain data shows more clear, actual buying before taking action?
#巨鲸动向 #稳定币 #Binance #on-chain data
📰 The actions of giant whales moving stablecoins to Binance have become noticeably more frequent. Data from CryptoQuant analyst Darkfost shows that for whale addresses with individual transfers exceeding $1 million, the cumulative stablecoin inflow over the past 30 days has risen from $21.7 billion to $30.5 billion—an increase of more than 40% in just over a month.
🔥 When funds of this kind go into trading platforms, they are typically interpreted as positioning in advance, which could later develop into potential buy pressure. To be honest, it’s better for the money to show up first than for funds to keep withdrawing—but between “moving in” and “actually buying,” there still needs to be some distance.
💡 Previously, whale stablecoin inflows once exceeded $61 billion, and then went through a longer period of decline. Now, although they’ve started to rebound, there’s still a gap from that level—so it looks more like big capital is testing the waters again rather than having fully moved in.
👀 Darkfost also noted that whales remain somewhat cautious. On one side are market expectations for an “October rally,” and on the other are factors like ongoing conflicts, inflation pressures, and continually rising bond yields. Either way, the money is back, but pressing the buy button isn’t quite as straightforward.
🤔 If whale stablecoin inflows continue to increase going forward, would you treat it as a signal of early positioning, or wait until on-chain data shows more clear, actual buying before taking action?
#巨鲸动向 #稳定币 #Binance #on-chain data
🔥 When funds of this kind go into trading platforms, they are typically interpreted as positioning in advance, which could later develop into potential buy pressure. To be honest, it’s better for the money to show up first than for funds to keep withdrawing—but between “moving in” and “actually buying,” there still needs to be some distance.
💡 Previously, whale stablecoin inflows once exceeded $61 billion, and then went through a longer period of decline. Now, although they’ve started to rebound, there’s still a gap from that level—so it looks more like big capital is testing the waters again rather than having fully moved in.
👀 Darkfost also noted that whales remain somewhat cautious. On one side are market expectations for an “October rally,” and on the other are factors like ongoing conflicts, inflation pressures, and continually rising bond yields. Either way, the money is back, but pressing the buy button isn’t quite as straightforward.
🤔 If whale stablecoin inflows continue to increase going forward, would you treat it as a signal of early positioning, or wait until on-chain data shows more clear, actual buying before taking action?
#巨鲸动向 #稳定币 #Binance #on-chain data

11
·
--
Bullish

1
26
·
--
📰 On October 1, Bitcoin spot ETFs recorded a total net inflow of $103 million. BlackRock’s IBIT pulled in $196 million in a single day, placing directly at the top.
Honestly, this figure is pretty interesting. Because on the same day, Fidelity’s FBTC saw a net outflow of $60.7316 million—funds weren’t flowing in uniformly, but instead showed clear differentiation among different ETFs.
🔥 IBIT’s cumulative net inflows have already reached $65.574 billion, and the scale is still extremely staggering. Grayscale’s Bitcoin Mini Trust ETF BTC also recorded a $14.5904 million net inflow yesterday, bringing its cumulative net inflows to $2.979 billion.
💡 As of before publication, the total net asset value of Bitcoin spot ETFs is $109.338 billion. The ETF net asset ratio is 6.43%, and historical cumulative net inflows have reached $57.598 billion. Institutional capital is still present in the market—it's just that, between different products, the choices are beginning to diverge.
🤔 Do you think this large-scale inflow into IBIT is mostly new capital, or capital rotated over from other ETFs?
#比特币 #比特币ETF #IBIT #加密市场
📰 On October 1, Bitcoin spot ETFs recorded a total net inflow of $103 million. BlackRock’s IBIT pulled in $196 million in a single day, placing directly at the top.
Honestly, this figure is pretty interesting. Because on the same day, Fidelity’s FBTC saw a net outflow of $60.7316 million—funds weren’t flowing in uniformly, but instead showed clear differentiation among different ETFs.
🔥 IBIT’s cumulative net inflows have already reached $65.574 billion, and the scale is still extremely staggering. Grayscale’s Bitcoin Mini Trust ETF BTC also recorded a $14.5904 million net inflow yesterday, bringing its cumulative net inflows to $2.979 billion.
💡 As of before publication, the total net asset value of Bitcoin spot ETFs is $109.338 billion. The ETF net asset ratio is 6.43%, and historical cumulative net inflows have reached $57.598 billion. Institutional capital is still present in the market—it's just that, between different products, the choices are beginning to diverge.
🤔 Do you think this large-scale inflow into IBIT is mostly new capital, or capital rotated over from other ETFs?
#比特币 #比特币ETF #IBIT #加密市场
Honestly, this figure is pretty interesting. Because on the same day, Fidelity’s FBTC saw a net outflow of $60.7316 million—funds weren’t flowing in uniformly, but instead showed clear differentiation among different ETFs.
🔥 IBIT’s cumulative net inflows have already reached $65.574 billion, and the scale is still extremely staggering. Grayscale’s Bitcoin Mini Trust ETF BTC also recorded a $14.5904 million net inflow yesterday, bringing its cumulative net inflows to $2.979 billion.
💡 As of before publication, the total net asset value of Bitcoin spot ETFs is $109.338 billion. The ETF net asset ratio is 6.43%, and historical cumulative net inflows have reached $57.598 billion. Institutional capital is still present in the market—it's just that, between different products, the choices are beginning to diverge.
🤔 Do you think this large-scale inflow into IBIT is mostly new capital, or capital rotated over from other ETFs?
#比特币 #比特币ETF #IBIT #加密市场

3
·
--
📊 The mid-day market picture shows a pretty big contrast. BTC’s current price is 85,512.90 USDT, up 2.10% in 24 hours. Big “bread” (BTC) is moving fairly steadily, but some smaller coins have already pushed volatility to the limit.
🔥 GTC is up 64.73%, PNT up 45.23%, and SCR also up 34.57%. These gains are definitely eye-catching, but if you chase in now, even a slight pullback can feel pretty uncomfortable.
⚠️ On the flip side, things are even harsher: NFP is down 65.85%, and BETA is down 64.00%. A one-day “cut in half” is not the end of it—honestly, people holding these two coins probably feel a bit panicked.
💡 In fact, today isn’t broad-based up or broad-based down—it’s the gap between coins that’s especially dramatic. BTC is up 2.10%, which doesn’t mean the small coins in your bag can keep up too. If your position is too concentrated, you’ll be very passive.
🤔 Today, are you holding GTC, which is up 64.73%, or NFP, which is down 65.85%?
#BTC #GTC #NFP #加密行情
📊 The mid-day market picture shows a pretty big contrast. BTC’s current price is 85,512.90 USDT, up 2.10% in 24 hours. Big “bread” (BTC) is moving fairly steadily, but some smaller coins have already pushed volatility to the limit.
🔥 GTC is up 64.73%, PNT up 45.23%, and SCR also up 34.57%. These gains are definitely eye-catching, but if you chase in now, even a slight pullback can feel pretty uncomfortable.
⚠️ On the flip side, things are even harsher: NFP is down 65.85%, and BETA is down 64.00%. A one-day “cut in half” is not the end of it—honestly, people holding these two coins probably feel a bit panicked.
💡 In fact, today isn’t broad-based up or broad-based down—it’s the gap between coins that’s especially dramatic. BTC is up 2.10%, which doesn’t mean the small coins in your bag can keep up too. If your position is too concentrated, you’ll be very passive.
🤔 Today, are you holding GTC, which is up 64.73%, or NFP, which is down 65.85%?
#BTC #GTC #NFP #加密行情
🔥 GTC is up 64.73%, PNT up 45.23%, and SCR also up 34.57%. These gains are definitely eye-catching, but if you chase in now, even a slight pullback can feel pretty uncomfortable.
⚠️ On the flip side, things are even harsher: NFP is down 65.85%, and BETA is down 64.00%. A one-day “cut in half” is not the end of it—honestly, people holding these two coins probably feel a bit panicked.
💡 In fact, today isn’t broad-based up or broad-based down—it’s the gap between coins that’s especially dramatic. BTC is up 2.10%, which doesn’t mean the small coins in your bag can keep up too. If your position is too concentrated, you’ll be very passive.
🤔 Today, are you holding GTC, which is up 64.73%, or NFP, which is down 65.85%?
#BTC #GTC #NFP #加密行情
3
·
--
📰 Citigroup has raised its target price for Bitcoin over the next 12 months from $82,000 to $113,000; its target price for Ethereum has also been raised from $2,240 to $3,028.
🔥 This adjustment isn’t small—especially for Bitcoin, whose target price has been increased by $31,000. To be honest, if institutions are willing to revise their expectations upward, the market will certainly re-examine the room ahead.
💡 The reasons Citigroup gives are fairly clear as well: in the coming year, crypto ETFs are expected to attract around $5 billion in net inflows, while renewed market interest, a weaker U.S. dollar, and the U.S. Treasury’s repurchases of long-term bonds could all provide support for digital assets.
Actually, this isn’t saying prices will definitely follow the script. It’s that traditional financial institutions’ assessment of capital inflows and the macro environment has changed. I didn’t expect this time that Ethereum would be raised as well—it suggests Citigroup isn’t only betting on Bitcoin.
🤔 Do you think these targets—$113,000 for Bitcoin and $3,028 for Ethereum—can be achieved next year?
#比特币 #以太坊 #加密货币ETF #Citigroup
📰 Citigroup has raised its target price for Bitcoin over the next 12 months from $82,000 to $113,000; its target price for Ethereum has also been raised from $2,240 to $3,028.
🔥 This adjustment isn’t small—especially for Bitcoin, whose target price has been increased by $31,000. To be honest, if institutions are willing to revise their expectations upward, the market will certainly re-examine the room ahead.
💡 The reasons Citigroup gives are fairly clear as well: in the coming year, crypto ETFs are expected to attract around $5 billion in net inflows, while renewed market interest, a weaker U.S. dollar, and the U.S. Treasury’s repurchases of long-term bonds could all provide support for digital assets.
Actually, this isn’t saying prices will definitely follow the script. It’s that traditional financial institutions’ assessment of capital inflows and the macro environment has changed. I didn’t expect this time that Ethereum would be raised as well—it suggests Citigroup isn’t only betting on Bitcoin.
🤔 Do you think these targets—$113,000 for Bitcoin and $3,028 for Ethereum—can be achieved next year?
#比特币 #以太坊 #加密货币ETF #Citigroup
🔥 This adjustment isn’t small—especially for Bitcoin, whose target price has been increased by $31,000. To be honest, if institutions are willing to revise their expectations upward, the market will certainly re-examine the room ahead.
💡 The reasons Citigroup gives are fairly clear as well: in the coming year, crypto ETFs are expected to attract around $5 billion in net inflows, while renewed market interest, a weaker U.S. dollar, and the U.S. Treasury’s repurchases of long-term bonds could all provide support for digital assets.
Actually, this isn’t saying prices will definitely follow the script. It’s that traditional financial institutions’ assessment of capital inflows and the macro environment has changed. I didn’t expect this time that Ethereum would be raised as well—it suggests Citigroup isn’t only betting on Bitcoin.
🤔 Do you think these targets—$113,000 for Bitcoin and $3,028 for Ethereum—can be achieved next year?
#比特币 #以太坊 #加密货币ETF #Citigroup

18
·
--
📰 The data from the Hong Kong Stock Exchange is very straightforward: in August 2026, the Hang Seng Tech Index futures saw an average daily trading volume of 154,986 contracts, while all single-stock futures combined totaled only 4,385. For a thematic index, trading activity far exceeds a bunch of single-stock contracts.
🔥 This is quite instructive for smaller CEXs and Perp DEXs. Keep listing trading pairs, increase leverage, and offer trading incentives—users may come fast, but they’ll also leave fast. Exclusively launching small-cap stocks isn’t a long-term advantage either. Once the underlying gets hot, big platforms will follow, and smaller platforms will have to find their next target again.
💡 A more interesting approach is to first attract attention with single-stock offerings, then group similar companies into an agreement-built small-cap index perpetual. Users don’t need to research every company individually—they can trade the entire sector directly. And the agreement can evolve from scouring stocks everywhere to organizing its own market.
👀 Liquidity might also be reorganized. A study from 2012 found that the ETF’s dollar-quoted depth reaches up to 35 times that of a single-stock sample. The portfolio dilutes the impact of single-company events. Market makers can manage their net exposure, without needing to synchronously buy and sell all constituent stocks for every index trade.
Honestly, the point of this path isn’t about “listing a few more new coin pairs,” but about concentrating fragmented demand into a product that can be traded repeatedly. Do you think a small trading platform can really keep users by offering small-cap stock index perpetuities?
#PerpDEX #永续合约 #小盘股 #加密衍生品
📰 The data from the Hong Kong Stock Exchange is very straightforward: in August 2026, the Hang Seng Tech Index futures saw an average daily trading volume of 154,986 contracts, while all single-stock futures combined totaled only 4,385. For a thematic index, trading activity far exceeds a bunch of single-stock contracts.
🔥 This is quite instructive for smaller CEXs and Perp DEXs. Keep listing trading pairs, increase leverage, and offer trading incentives—users may come fast, but they’ll also leave fast. Exclusively launching small-cap stocks isn’t a long-term advantage either. Once the underlying gets hot, big platforms will follow, and smaller platforms will have to find their next target again.
💡 A more interesting approach is to first attract attention with single-stock offerings, then group similar companies into an agreement-built small-cap index perpetual. Users don’t need to research every company individually—they can trade the entire sector directly. And the agreement can evolve from scouring stocks everywhere to organizing its own market.
👀 Liquidity might also be reorganized. A study from 2012 found that the ETF’s dollar-quoted depth reaches up to 35 times that of a single-stock sample. The portfolio dilutes the impact of single-company events. Market makers can manage their net exposure, without needing to synchronously buy and sell all constituent stocks for every index trade.
Honestly, the point of this path isn’t about “listing a few more new coin pairs,” but about concentrating fragmented demand into a product that can be traded repeatedly. Do you think a small trading platform can really keep users by offering small-cap stock index perpetuities?
#PerpDEX #永续合约 #小盘股 #加密衍生品
🔥 This is quite instructive for smaller CEXs and Perp DEXs. Keep listing trading pairs, increase leverage, and offer trading incentives—users may come fast, but they’ll also leave fast. Exclusively launching small-cap stocks isn’t a long-term advantage either. Once the underlying gets hot, big platforms will follow, and smaller platforms will have to find their next target again.
💡 A more interesting approach is to first attract attention with single-stock offerings, then group similar companies into an agreement-built small-cap index perpetual. Users don’t need to research every company individually—they can trade the entire sector directly. And the agreement can evolve from scouring stocks everywhere to organizing its own market.
👀 Liquidity might also be reorganized. A study from 2012 found that the ETF’s dollar-quoted depth reaches up to 35 times that of a single-stock sample. The portfolio dilutes the impact of single-company events. Market makers can manage their net exposure, without needing to synchronously buy and sell all constituent stocks for every index trade.
Honestly, the point of this path isn’t about “listing a few more new coin pairs,” but about concentrating fragmented demand into a product that can be traded repeatedly. Do you think a small trading platform can really keep users by offering small-cap stock index perpetuities?
#PerpDEX #永续合约 #小盘股 #加密衍生品

8
·
--
📰 Glassnode mentioned that the sell wall of 85,000 USDT above Bitcoin has already been digested by buyers.
This level was repeatedly tested for nearly a week, but it never managed to truly break through. After buyers ate through this layer of pressure yesterday, the sell orders previously resting above also seem to have been gradually withdrawn, and the chart suddenly has far less resistance.
🔥 To be honest, the disappearance of the sell wall doesn’t necessarily mean an immediate rally is guaranteed, but at least it indicates that there are fewer people willing to keep selling at the top. Previously, every time the price approached 85,000 USDT, it had to face sell pressure. Now that wall is gone, and the upward pace could indeed pick up.
💡 Glassnode’s view is also quite straightforward: with reduced sell-side liquidity above, pushing the price upward may become smoother. Who would have thought that a level that kept stalling for a week would ultimately be hard-consumed by buyers.
🤔 Do you think this is a release of pressure before a breakout, or will new resistance reappear after the sell orders are withdrawn?
#BTC #Glassnode #链上数据 #Bitcoin
📰 Glassnode mentioned that the sell wall of 85,000 USDT above Bitcoin has already been digested by buyers.
This level was repeatedly tested for nearly a week, but it never managed to truly break through. After buyers ate through this layer of pressure yesterday, the sell orders previously resting above also seem to have been gradually withdrawn, and the chart suddenly has far less resistance.
🔥 To be honest, the disappearance of the sell wall doesn’t necessarily mean an immediate rally is guaranteed, but at least it indicates that there are fewer people willing to keep selling at the top. Previously, every time the price approached 85,000 USDT, it had to face sell pressure. Now that wall is gone, and the upward pace could indeed pick up.
💡 Glassnode’s view is also quite straightforward: with reduced sell-side liquidity above, pushing the price upward may become smoother. Who would have thought that a level that kept stalling for a week would ultimately be hard-consumed by buyers.
🤔 Do you think this is a release of pressure before a breakout, or will new resistance reappear after the sell orders are withdrawn?
#BTC #Glassnode #链上数据 #Bitcoin
This level was repeatedly tested for nearly a week, but it never managed to truly break through. After buyers ate through this layer of pressure yesterday, the sell orders previously resting above also seem to have been gradually withdrawn, and the chart suddenly has far less resistance.
🔥 To be honest, the disappearance of the sell wall doesn’t necessarily mean an immediate rally is guaranteed, but at least it indicates that there are fewer people willing to keep selling at the top. Previously, every time the price approached 85,000 USDT, it had to face sell pressure. Now that wall is gone, and the upward pace could indeed pick up.
💡 Glassnode’s view is also quite straightforward: with reduced sell-side liquidity above, pushing the price upward may become smoother. Who would have thought that a level that kept stalling for a week would ultimately be hard-consumed by buyers.
🤔 Do you think this is a release of pressure before a breakout, or will new resistance reappear after the sell orders are withdrawn?
#BTC #Glassnode #链上数据 #Bitcoin

74
·
--
📰 The CEO of U.S. retirement account platform iTrustCapital revealed that more than half of the platform’s clients are buying Bitcoin. With assets under management reaching $1.3 billion, this suggests the purchases aren’t just one-off, scattered trades.
🔥 What’s even more interesting is that customers haven’t just started acting. According to him, after Bitcoin fell to a low of $58,000, investors have continued to allocate funds consistently.
To be honest, the mindset behind money in retirement accounts versus short-term trading funds is often quite different. Many people won’t switch directions immediately just because of a few days of volatility. Instead, they may treat the decline as an opportunity to buy in batches.
💡 Of course, this data only reflects iTrustCapital’s own customers and can’t be taken as direct evidence that the entire market is buying. But a figure of over 50% at least indicates that some long-term capital hasn’t exited due to the earlier pullback—it's still increasing its Bitcoin allocation.
🤔 If you have a retirement account or long-term investment funds, and you encounter the kind of volatility that started from the $58,000 low, would you choose to keep buying—or wait for clearer signals?
#BTC #比特币 #退休账户 #加密投资
📰 The CEO of U.S. retirement account platform iTrustCapital revealed that more than half of the platform’s clients are buying Bitcoin. With assets under management reaching $1.3 billion, this suggests the purchases aren’t just one-off, scattered trades.
🔥 What’s even more interesting is that customers haven’t just started acting. According to him, after Bitcoin fell to a low of $58,000, investors have continued to allocate funds consistently.
To be honest, the mindset behind money in retirement accounts versus short-term trading funds is often quite different. Many people won’t switch directions immediately just because of a few days of volatility. Instead, they may treat the decline as an opportunity to buy in batches.
💡 Of course, this data only reflects iTrustCapital’s own customers and can’t be taken as direct evidence that the entire market is buying. But a figure of over 50% at least indicates that some long-term capital hasn’t exited due to the earlier pullback—it's still increasing its Bitcoin allocation.
🤔 If you have a retirement account or long-term investment funds, and you encounter the kind of volatility that started from the $58,000 low, would you choose to keep buying—or wait for clearer signals?
#BTC #比特币 #退休账户 #加密投资
🔥 What’s even more interesting is that customers haven’t just started acting. According to him, after Bitcoin fell to a low of $58,000, investors have continued to allocate funds consistently.
To be honest, the mindset behind money in retirement accounts versus short-term trading funds is often quite different. Many people won’t switch directions immediately just because of a few days of volatility. Instead, they may treat the decline as an opportunity to buy in batches.
💡 Of course, this data only reflects iTrustCapital’s own customers and can’t be taken as direct evidence that the entire market is buying. But a figure of over 50% at least indicates that some long-term capital hasn’t exited due to the earlier pullback—it's still increasing its Bitcoin allocation.
🤔 If you have a retirement account or long-term investment funds, and you encounter the kind of volatility that started from the $58,000 low, would you choose to keep buying—or wait for clearer signals?
#BTC #比特币 #退休账户 #加密投资

65
·
--
📰 Variant Fund investment partner Alana Levin’s take is a bit blunt: the crypto market’s bottom most likely appeared at some point in July this year.
She wrote in early July that the bottom seemed close. At the time, Bitcoin was around $59,000, Ethereum $1,600, and ZEC $420. Now the question is: has this rally truly entered a real bull market, or is it just a false breakout?
🔥 Levin assumes the market is in the early stages of a new bull cycle and believes capital is more likely to flow into two types of assets: one consists of protocols with “money-like” characteristics—able to perform as a store of value; the other consists of protocols that can continuously generate revenue.
To be honest, BTC still remains, in her view, the dominant asset for digital value storage. How other competing assets should be valued likely depends on their share relative to Bitcoin’s market cap—and whether that share is still changing.
💡 For revenue-generating protocols, investors will look at where the revenue comes from, whether they can hold up when the market pulls back, and whether the profit margins are sufficient. Projects with real-world assets and room for stablecoin growth—potentially attracting institutional users—and whose founding teams are still around after surviving a bear market, are more likely to command higher valuations.
👀 Another category is on-chain projects that can be compared directly to traditional businesses, in areas including AI-related directions such as routing, inference, compute, data collection, and interfaces. Levin believes most of these may not actually need a blockchain. If projects in this space clearly outperform, they could be close to the market top. Which do you think will be the one truly worth holding through this cycle—money-store protocols, revenue generators, or the AI/traditional-business-style on-chain plays?
#加密市场 #比特币 #链上协议 #investment viewpoint
📰 Variant Fund investment partner Alana Levin’s take is a bit blunt: the crypto market’s bottom most likely appeared at some point in July this year.
She wrote in early July that the bottom seemed close. At the time, Bitcoin was around $59,000, Ethereum $1,600, and ZEC $420. Now the question is: has this rally truly entered a real bull market, or is it just a false breakout?
🔥 Levin assumes the market is in the early stages of a new bull cycle and believes capital is more likely to flow into two types of assets: one consists of protocols with “money-like” characteristics—able to perform as a store of value; the other consists of protocols that can continuously generate revenue.
To be honest, BTC still remains, in her view, the dominant asset for digital value storage. How other competing assets should be valued likely depends on their share relative to Bitcoin’s market cap—and whether that share is still changing.
💡 For revenue-generating protocols, investors will look at where the revenue comes from, whether they can hold up when the market pulls back, and whether the profit margins are sufficient. Projects with real-world assets and room for stablecoin growth—potentially attracting institutional users—and whose founding teams are still around after surviving a bear market, are more likely to command higher valuations.
👀 Another category is on-chain projects that can be compared directly to traditional businesses, in areas including AI-related directions such as routing, inference, compute, data collection, and interfaces. Levin believes most of these may not actually need a blockchain. If projects in this space clearly outperform, they could be close to the market top. Which do you think will be the one truly worth holding through this cycle—money-store protocols, revenue generators, or the AI/traditional-business-style on-chain plays?
#加密市场 #比特币 #链上协议 #investment viewpoint
She wrote in early July that the bottom seemed close. At the time, Bitcoin was around $59,000, Ethereum $1,600, and ZEC $420. Now the question is: has this rally truly entered a real bull market, or is it just a false breakout?
🔥 Levin assumes the market is in the early stages of a new bull cycle and believes capital is more likely to flow into two types of assets: one consists of protocols with “money-like” characteristics—able to perform as a store of value; the other consists of protocols that can continuously generate revenue.
To be honest, BTC still remains, in her view, the dominant asset for digital value storage. How other competing assets should be valued likely depends on their share relative to Bitcoin’s market cap—and whether that share is still changing.
💡 For revenue-generating protocols, investors will look at where the revenue comes from, whether they can hold up when the market pulls back, and whether the profit margins are sufficient. Projects with real-world assets and room for stablecoin growth—potentially attracting institutional users—and whose founding teams are still around after surviving a bear market, are more likely to command higher valuations.
👀 Another category is on-chain projects that can be compared directly to traditional businesses, in areas including AI-related directions such as routing, inference, compute, data collection, and interfaces. Levin believes most of these may not actually need a blockchain. If projects in this space clearly outperform, they could be close to the market top. Which do you think will be the one truly worth holding through this cycle—money-store protocols, revenue generators, or the AI/traditional-business-style on-chain plays?
#加密市场 #比特币 #链上协议 #investment viewpoint

70
Log in to explore more content
Join global crypto users on Binance Square
⚡️ Get latest and useful information about crypto.
💬 Trusted by the world’s largest crypto exchange.
👍 Discover real insights from verified creators.
Email / Phone number