

Hassan v277
688 Posts

Hassan v277
Report
Block User
Hlw Assalamualaikum I am posting daily fresh News follow me for daily News
Open Trade
Frequent Trader
3.7 Years
2 Following
232 Followers
1.0K+ Liked
Posts
Portfolio
All
Quotes
Videos
·
--
See translation
Bitcoin Just Flashed a Second, Stronger Golden Cross: Here's What That Means
In brief
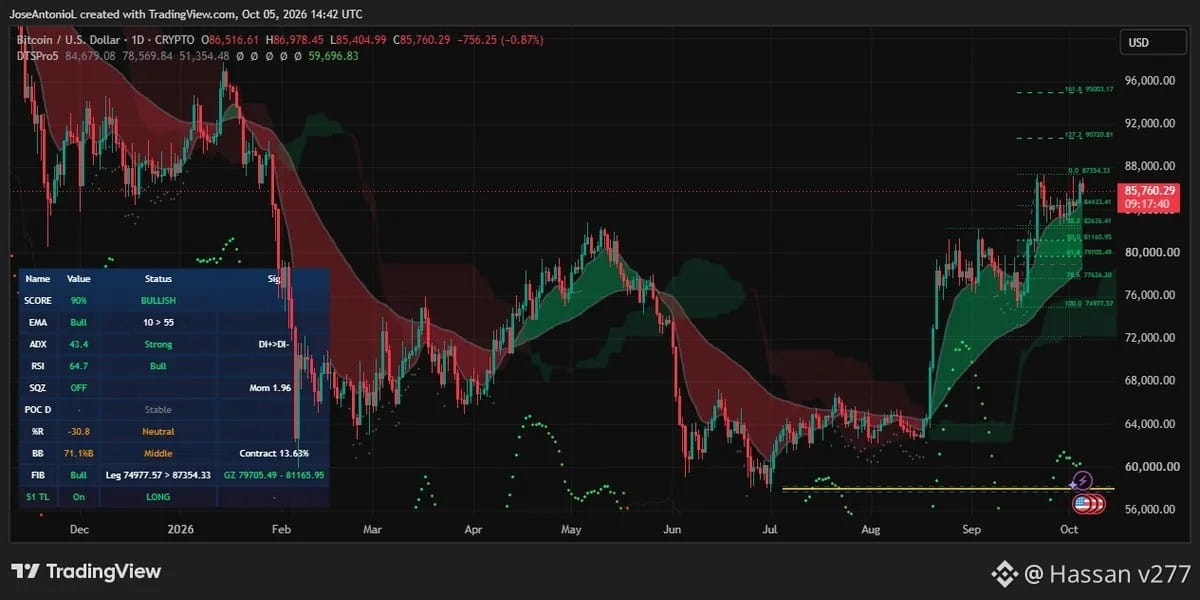
Bitcoin traded around $86,000 on Monday, roughly $1,200 below the $87,354 swing high that has capped the rally.
Macroeconomic winds have turned in Bitcoin's favor, with potential future catalysts around the corner.
The daily chart has painted a decidedly bullish picture, with Bitcoin entering a second, stronger "golden cross."
Bitcoin is starting the week on the front foot. It still can't clear the ceiling, but investors have reason to be optimistic.
The top crypto asset traded around $86,100 on Monday morning, up 1.14% in 24 hours, with a market capitalization of $1.73 trillion. The entire crypto market is worth $2.94 trillion, up 1.36% on the day, and the Fear & Greed Index sits at 68, still in "greed" territory and stabilizing sentiment after a dip from “extreme greed” readings last month.
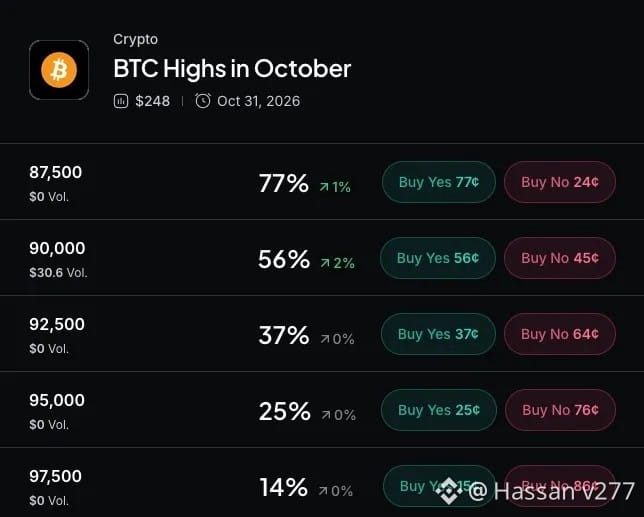
Myriad: How high will Bitcoin go? Click to make your prediction.
The spark was Friday's jobs report, and it was ugly—for the economy, that is. U.S. employers added only 29,000 positions in September, according to the Bureau of Labor Statistics, roughly a third of what economists expected. The unemployment rate ticked up to 4.2%.
Revisions made it worse. July was revised from a gain of 21,000 to a loss of 10,000 jobs, and August was cut from 162,000 to 133,000. Annual wage growth cooled to 3.0%.
Bad news for workers, good news for risk assets. That's the weird math of this cycle.
Bitcoin price data. Image: Tradingview
The Federal Reserve raised rates a quarter point to 3.75%-4.00% on September 16 in a unanimous vote. A week before Friday's report, bond traders gave an October hike a 64% chance. After it, those odds fell to roughly 16%-22%, depending on the snapshot.
Bitcoin Just Flashed a Second, Stronger Golden Cross: Here's What That Means
In brief
Bitcoin traded around $86,000 on Monday, roughly $1,200 below the $87,354 swing high that has capped the rally.
Macroeconomic winds have turned in Bitcoin's favor, with potential future catalysts around the corner.
The daily chart has painted a decidedly bullish picture, with Bitcoin entering a second, stronger "golden cross."
Bitcoin is starting the week on the front foot. It still can't clear the ceiling, but investors have reason to be optimistic.
The top crypto asset traded around $86,100 on Monday morning, up 1.14% in 24 hours, with a market capitalization of $1.73 trillion. The entire crypto market is worth $2.94 trillion, up 1.36% on the day, and the Fear & Greed Index sits at 68, still in "greed" territory and stabilizing sentiment after a dip from “extreme greed” readings last month.
Myriad: How high will Bitcoin go? Click to make your prediction.
The spark was Friday's jobs report, and it was ugly—for the economy, that is. U.S. employers added only 29,000 positions in September, according to the Bureau of Labor Statistics, roughly a third of what economists expected. The unemployment rate ticked up to 4.2%.
Revisions made it worse. July was revised from a gain of 21,000 to a loss of 10,000 jobs, and August was cut from 162,000 to 133,000. Annual wage growth cooled to 3.0%.
Bad news for workers, good news for risk assets. That's the weird math of this cycle.
Bitcoin price data. Image: Tradingview
The Federal Reserve raised rates a quarter point to 3.75%-4.00% on September 16 in a unanimous vote. A week before Friday's report, bond traders gave an October hike a 64% chance. After it, those odds fell to roughly 16%-22%, depending on the snapshot.
In brief
Bitcoin traded around $86,000 on Monday, roughly $1,200 below the $87,354 swing high that has capped the rally.
Macroeconomic winds have turned in Bitcoin's favor, with potential future catalysts around the corner.
The daily chart has painted a decidedly bullish picture, with Bitcoin entering a second, stronger "golden cross."
Bitcoin is starting the week on the front foot. It still can't clear the ceiling, but investors have reason to be optimistic.
The top crypto asset traded around $86,100 on Monday morning, up 1.14% in 24 hours, with a market capitalization of $1.73 trillion. The entire crypto market is worth $2.94 trillion, up 1.36% on the day, and the Fear & Greed Index sits at 68, still in "greed" territory and stabilizing sentiment after a dip from “extreme greed” readings last month.
Myriad: How high will Bitcoin go? Click to make your prediction.
The spark was Friday's jobs report, and it was ugly—for the economy, that is. U.S. employers added only 29,000 positions in September, according to the Bureau of Labor Statistics, roughly a third of what economists expected. The unemployment rate ticked up to 4.2%.
Revisions made it worse. July was revised from a gain of 21,000 to a loss of 10,000 jobs, and August was cut from 162,000 to 133,000. Annual wage growth cooled to 3.0%.
Bad news for workers, good news for risk assets. That's the weird math of this cycle.
Bitcoin price data. Image: Tradingview
The Federal Reserve raised rates a quarter point to 3.75%-4.00% on September 16 in a unanimous vote. A week before Friday's report, bond traders gave an October hike a 64% chance. After it, those odds fell to roughly 16%-22%, depending on the snapshot.

53
·
--
See translation
BNB price prediction: Can the 37th burn fuel an October rally?
$BNB price has entered October near $788 after gaining roughly 11% in September, with the 37th quarterly token burn and an 800–807 breakout now shaping the month’s price setup.
CoinGecko data show $BNB price trading around $788 on Oct. 4, up roughly 2.5% over 24 hours and 1.2% during the past seven days. Its market capitalization stands close to $105 billion, supported by a circulating supply of roughly 130 million $BNB.
September extended a recovery that had already gathered strength during August. Historical price data put $BNB’s September opening near $691 and its month-end price around $768, an increase of roughly 11%. August had produced another advance of close to 18%.
The market has since moved through several different technical phases. By Sept. 17, $BNB was trading near $721, with support clustered around 709–710 and resistance near 729–740. Price subsequently pushed toward $800 before retreating again. $BNB price holds $710 support as momentum weakens
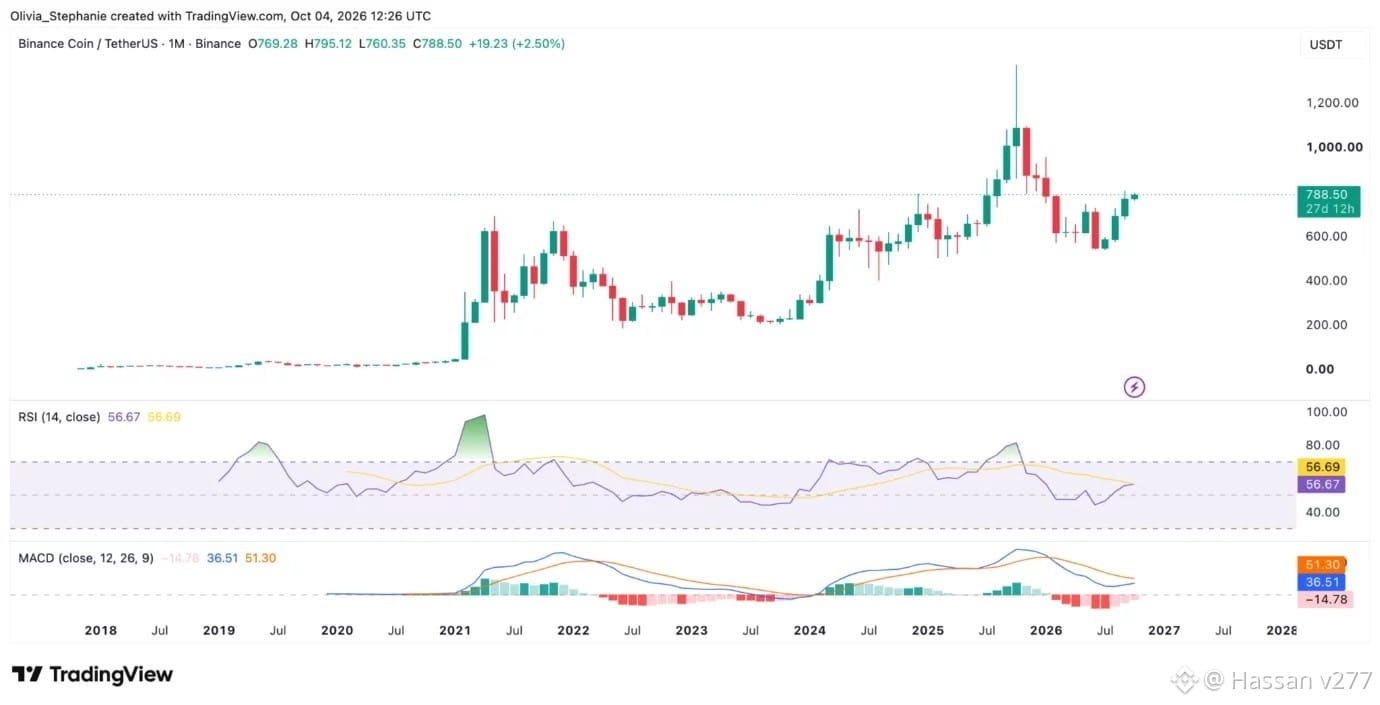
Current monthly indicators remain mixed. RSI sits around 56.66, almost level with its moving average of 56.69. A reading above 50 points to moderately positive momentum, though the indicator remains well below the 70 overbought threshold.
MACD has not confirmed the same strength. The MACD line is near 36.50, below the signal line around 51.29, while the histogram remains negative at approximately -14.80. Shrinking negative histogram bars suggest bearish momentum is easing, but the monthly chart has not yet produced a confirmed bullish crossover.
$BNB price chart, source: TradingView
For October, the technical picture becomes stronger if $BNB price can convert 800–807 from resistance into support.
BNB price prediction: Can the 37th burn fuel an October rally?
$BNB price has entered October near $788 after gaining roughly 11% in September, with the 37th quarterly token burn and an 800–807 breakout now shaping the month’s price setup.
CoinGecko data show $BNB price trading around $788 on Oct. 4, up roughly 2.5% over 24 hours and 1.2% during the past seven days. Its market capitalization stands close to $105 billion, supported by a circulating supply of roughly 130 million $BNB.
September extended a recovery that had already gathered strength during August. Historical price data put $BNB’s September opening near $691 and its month-end price around $768, an increase of roughly 11%. August had produced another advance of close to 18%.
The market has since moved through several different technical phases. By Sept. 17, $BNB was trading near $721, with support clustered around 709–710 and resistance near 729–740. Price subsequently pushed toward $800 before retreating again. $BNB price holds $710 support as momentum weakens
Current monthly indicators remain mixed. RSI sits around 56.66, almost level with its moving average of 56.69. A reading above 50 points to moderately positive momentum, though the indicator remains well below the 70 overbought threshold.
MACD has not confirmed the same strength. The MACD line is near 36.50, below the signal line around 51.29, while the histogram remains negative at approximately -14.80. Shrinking negative histogram bars suggest bearish momentum is easing, but the monthly chart has not yet produced a confirmed bullish crossover.
$BNB price chart, source: TradingView
For October, the technical picture becomes stronger if $BNB price can convert 800–807 from resistance into support.
$BNB price has entered October near $788 after gaining roughly 11% in September, with the 37th quarterly token burn and an 800–807 breakout now shaping the month’s price setup.
CoinGecko data show $BNB price trading around $788 on Oct. 4, up roughly 2.5% over 24 hours and 1.2% during the past seven days. Its market capitalization stands close to $105 billion, supported by a circulating supply of roughly 130 million $BNB.
September extended a recovery that had already gathered strength during August. Historical price data put $BNB’s September opening near $691 and its month-end price around $768, an increase of roughly 11%. August had produced another advance of close to 18%.
The market has since moved through several different technical phases. By Sept. 17, $BNB was trading near $721, with support clustered around 709–710 and resistance near 729–740. Price subsequently pushed toward $800 before retreating again. $BNB price holds $710 support as momentum weakens
Current monthly indicators remain mixed. RSI sits around 56.66, almost level with its moving average of 56.69. A reading above 50 points to moderately positive momentum, though the indicator remains well below the 70 overbought threshold.
MACD has not confirmed the same strength. The MACD line is near 36.50, below the signal line around 51.29, while the histogram remains negative at approximately -14.80. Shrinking negative histogram bars suggest bearish momentum is easing, but the monthly chart has not yet produced a confirmed bullish crossover.
$BNB price chart, source: TradingView
For October, the technical picture becomes stronger if $BNB price can convert 800–807 from resistance into support.

66
·
--
Verified
See translation
More Orange Than Ever': Michael Saylor Hints at Massive New Bitcoin Buy
Strategy (formerly MicroStrategy) founder and chairman Michael Saylor published data on the company's Bitcoin strategy with the concise comment: "More orange than ever."
Michael Saylor's "More orange than ever" post on X, Source: Michael Saylor via X.com
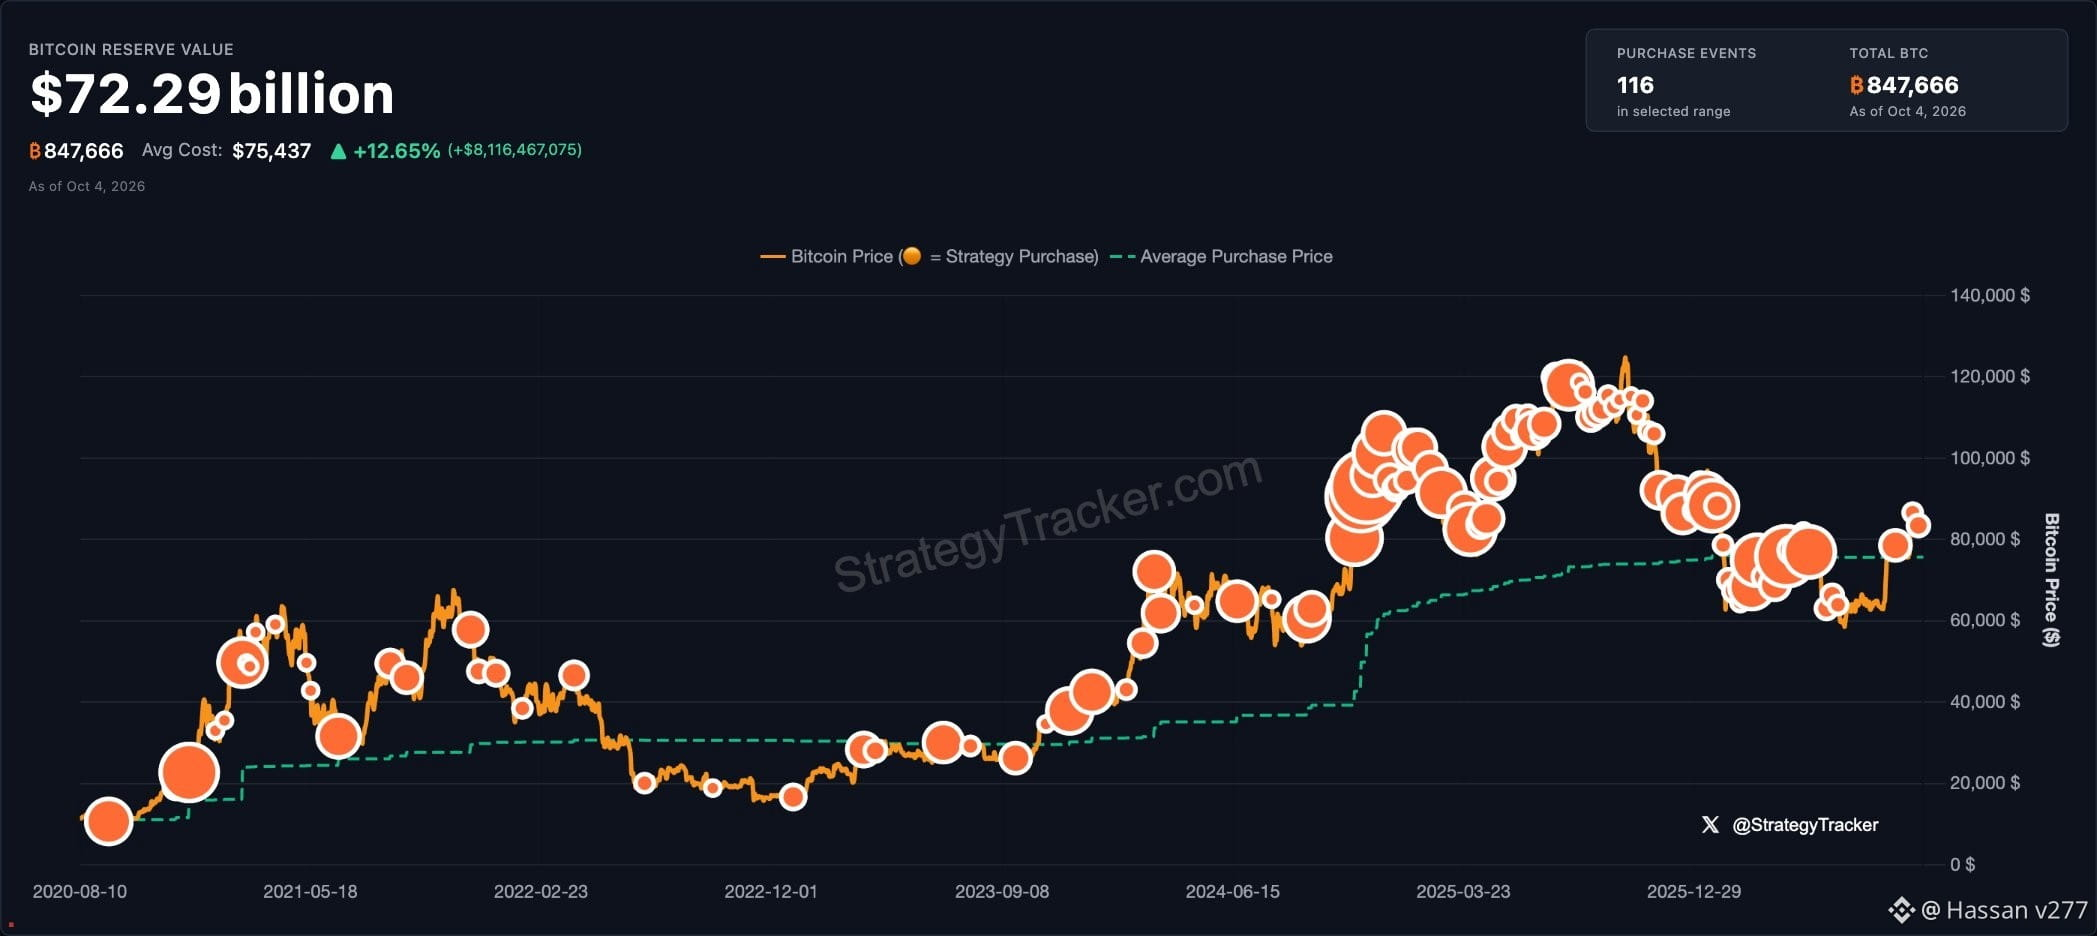
Saylor's wording directly refers to a recent chart from the StrategyTracker platform dated October 4, 2026, where the density of orange purchase markers reached an all-time high. Posts of this kind have traditionally preceded official filings with the U.S. Securities and Exchange Commission (SEC) on the completion of another round of large purchases.
What makes up the largest corporate Bitcoin portfolio in history
According to BitcoinTreasuriesNET analytics dashboard, Strategy has accumulated 847,666 $BTC to date, or about 4.04% of Bitcoin's total supply. With total historical spending of $63.95 billion, the portfolio's average purchase price is $75,442.45 per coin.
At current market prices, the reserves are valued at $72.20 billion, putting the company's unrealized net profit above $8.25 billion. Since the start of the year, the portfolio has grown by 26.05% (+175,169 $BTC), with purchases made in late September at prices close to the portfolio's average.
Strategy's Bitcoin accumulation chart showing 847,666 $BTC holdings as of October 4, 2026, Source: StrategyTracker
Saylor's claim that the balance is "more orange than ever" is also reflected in the stock market's valuation. The company's shares currently trade at a 14% premium to the value of its net crypto reserves, with an mNAV multiple of 1.14x. Each diluted share represents 0.001972 $BTC.
Wall Street accepts this premium because of the company's distinctive debt model, the Digital Credit Stack. Strategy raises liquidity by issuing specialized bonds (tickers STRC, STRD, STRF, and STRK) totaling $12.68 billion, with fixed yields ranging from 9.00% to 13.63% annually.
More Orange Than Ever': Michael Saylor Hints at Massive New Bitcoin Buy
Strategy (formerly MicroStrategy) founder and chairman Michael Saylor published data on the company's Bitcoin strategy with the concise comment: "More orange than ever."
Michael Saylor's "More orange than ever" post on X, Source: Michael Saylor via X.com
Saylor's wording directly refers to a recent chart from the StrategyTracker platform dated October 4, 2026, where the density of orange purchase markers reached an all-time high. Posts of this kind have traditionally preceded official filings with the U.S. Securities and Exchange Commission (SEC) on the completion of another round of large purchases.
What makes up the largest corporate Bitcoin portfolio in history
According to BitcoinTreasuriesNET analytics dashboard, Strategy has accumulated 847,666 $BTC to date, or about 4.04% of Bitcoin's total supply. With total historical spending of $63.95 billion, the portfolio's average purchase price is $75,442.45 per coin.
At current market prices, the reserves are valued at $72.20 billion, putting the company's unrealized net profit above $8.25 billion. Since the start of the year, the portfolio has grown by 26.05% (+175,169 $BTC), with purchases made in late September at prices close to the portfolio's average.
Strategy's Bitcoin accumulation chart showing 847,666 $BTC holdings as of October 4, 2026, Source: StrategyTracker
Saylor's claim that the balance is "more orange than ever" is also reflected in the stock market's valuation. The company's shares currently trade at a 14% premium to the value of its net crypto reserves, with an mNAV multiple of 1.14x. Each diluted share represents 0.001972 $BTC.
Wall Street accepts this premium because of the company's distinctive debt model, the Digital Credit Stack. Strategy raises liquidity by issuing specialized bonds (tickers STRC, STRD, STRF, and STRK) totaling $12.68 billion, with fixed yields ranging from 9.00% to 13.63% annually.
Strategy (formerly MicroStrategy) founder and chairman Michael Saylor published data on the company's Bitcoin strategy with the concise comment: "More orange than ever."
Michael Saylor's "More orange than ever" post on X, Source: Michael Saylor via X.com
Saylor's wording directly refers to a recent chart from the StrategyTracker platform dated October 4, 2026, where the density of orange purchase markers reached an all-time high. Posts of this kind have traditionally preceded official filings with the U.S. Securities and Exchange Commission (SEC) on the completion of another round of large purchases.
What makes up the largest corporate Bitcoin portfolio in history
According to BitcoinTreasuriesNET analytics dashboard, Strategy has accumulated 847,666 $BTC to date, or about 4.04% of Bitcoin's total supply. With total historical spending of $63.95 billion, the portfolio's average purchase price is $75,442.45 per coin.
At current market prices, the reserves are valued at $72.20 billion, putting the company's unrealized net profit above $8.25 billion. Since the start of the year, the portfolio has grown by 26.05% (+175,169 $BTC), with purchases made in late September at prices close to the portfolio's average.
Strategy's Bitcoin accumulation chart showing 847,666 $BTC holdings as of October 4, 2026, Source: StrategyTracker
Saylor's claim that the balance is "more orange than ever" is also reflected in the stock market's valuation. The company's shares currently trade at a 14% premium to the value of its net crypto reserves, with an mNAV multiple of 1.14x. Each diluted share represents 0.001972 $BTC.
Wall Street accepts this premium because of the company's distinctive debt model, the Digital Credit Stack. Strategy raises liquidity by issuing specialized bonds (tickers STRC, STRD, STRF, and STRK) totaling $12.68 billion, with fixed yields ranging from 9.00% to 13.63% annually.
231
·
--
See translation
Analyst Sees Bitcoin Path to $97K as Weak Jobs Data Shift Fed Odds
Bitcoin’s recovery is drawing support from softer employment figures and renewed investment demand, according to 21shares. The firm’s strategist views reduced expectations for further monetary tightening as favorable for cryptocurrencies heading into the final quarter.
Softer Jobs Data Put Bitcoin’s $87K Barrier in Focus
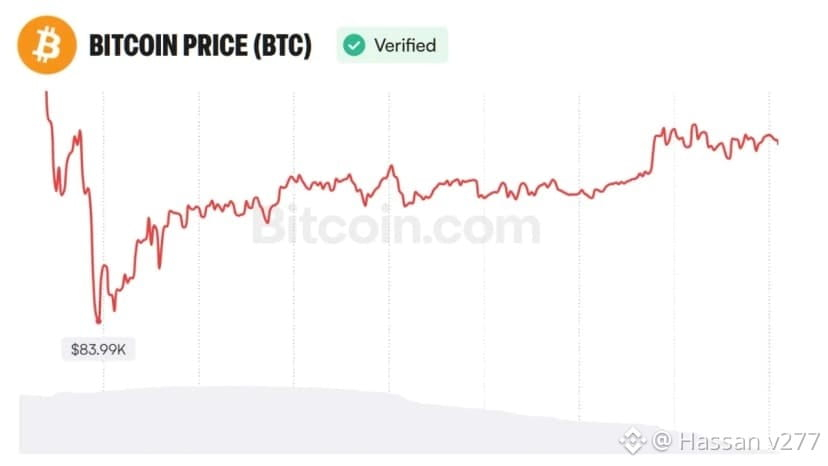
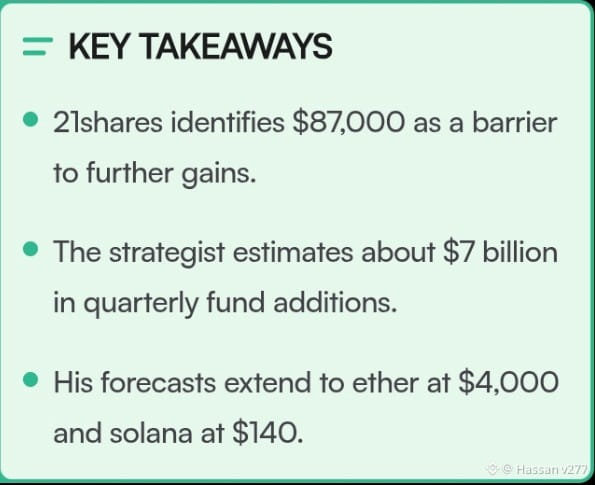
Bitcoin broke through $85,000-$86,000 overnight and was testing $87,000 on Oct. 2 when Matt Mena, senior crypto research strategist at 21shares, a crypto investment product issuer, supplied comments to Bitcoin.com News. He linked the advance to changing economic expectations and described the latter level as a barrier that had constrained prices for much of the year.
The strategist identified $87,000 as a resistance level, meaning a price area where selling pressure can impede an advance. Mena said:
“More uncertain macro data, such as this jobs report, could be the catalyst to clear this resistance and set the path to the next resistance levels: $90K and $97K.”
The employment backdrop weakened as U.S. employers added 29,000 jobs in September and unemployment reached 4.2%, according to the September employment figures released Oct. 2 by the Bureau of Labor Statistics. July and August gains were revised down by a combined 60,000.
Mena argued that softer hiring gives the Federal Reserve room to hold rates into 2027, describing a weekly decline of more than 35% in hike odds. Separately, derivatives exchange CME Group’s FedWatch rate probabilities reflect prices of contracts tied to future interest rates; they represent traders’ expectations.
Analyst Sees Bitcoin Path to $97K as Weak Jobs Data Shift Fed Odds
Bitcoin’s recovery is drawing support from softer employment figures and renewed investment demand, according to 21shares. The firm’s strategist views reduced expectations for further monetary tightening as favorable for cryptocurrencies heading into the final quarter.
Softer Jobs Data Put Bitcoin’s $87K Barrier in Focus
Bitcoin broke through $85,000-$86,000 overnight and was testing $87,000 on Oct. 2 when Matt Mena, senior crypto research strategist at 21shares, a crypto investment product issuer, supplied comments to Bitcoin.com News. He linked the advance to changing economic expectations and described the latter level as a barrier that had constrained prices for much of the year.
The strategist identified $87,000 as a resistance level, meaning a price area where selling pressure can impede an advance. Mena said:
“More uncertain macro data, such as this jobs report, could be the catalyst to clear this resistance and set the path to the next resistance levels: $90K and $97K.”
The employment backdrop weakened as U.S. employers added 29,000 jobs in September and unemployment reached 4.2%, according to the September employment figures released Oct. 2 by the Bureau of Labor Statistics. July and August gains were revised down by a combined 60,000.
Mena argued that softer hiring gives the Federal Reserve room to hold rates into 2027, describing a weekly decline of more than 35% in hike odds. Separately, derivatives exchange CME Group’s FedWatch rate probabilities reflect prices of contracts tied to future interest rates; they represent traders’ expectations.
Bitcoin’s recovery is drawing support from softer employment figures and renewed investment demand, according to 21shares. The firm’s strategist views reduced expectations for further monetary tightening as favorable for cryptocurrencies heading into the final quarter.
Softer Jobs Data Put Bitcoin’s $87K Barrier in Focus
Bitcoin broke through $85,000-$86,000 overnight and was testing $87,000 on Oct. 2 when Matt Mena, senior crypto research strategist at 21shares, a crypto investment product issuer, supplied comments to Bitcoin.com News. He linked the advance to changing economic expectations and described the latter level as a barrier that had constrained prices for much of the year.
The strategist identified $87,000 as a resistance level, meaning a price area where selling pressure can impede an advance. Mena said:
“More uncertain macro data, such as this jobs report, could be the catalyst to clear this resistance and set the path to the next resistance levels: $90K and $97K.”
The employment backdrop weakened as U.S. employers added 29,000 jobs in September and unemployment reached 4.2%, according to the September employment figures released Oct. 2 by the Bureau of Labor Statistics. July and August gains were revised down by a combined 60,000.
Mena argued that softer hiring gives the Federal Reserve room to hold rates into 2027, describing a weekly decline of more than 35% in hike odds. Separately, derivatives exchange CME Group’s FedWatch rate probabilities reflect prices of contracts tied to future interest rates; they represent traders’ expectations.
78
·
--
See translation
US Rallied Bitcoin and Iran Crashed It In a Dramatic 24 Hours for Crypto
US Rallied Bitcoin and Iran Crashed It In a Dramatic 24 Hours for Crypto

113
·
--
See translation
Why is Bitcoin price going up today?
Bitcoin price has climbed roughly 3% and briefly crossed $87,000 on Oct. 2 as weak U.S. jobs data reinforced expectations for an October Federal Reserve pause while a wave of short liquidations added fuel to the move.
According to CoinGecko data, Bitcoin traded around $86,300 at press time after reaching an intraday high above $87,000, recovering from levels below $84,000 earlier in the day. Trading volume rose as $BTC returned to an area last tested during its September rally.
The move gathered pace after U.S. nonfarm payrolls rose by just 29,000 in September, far below the 90,000 jobs expected by economists. Unemployment rose to 4.2% from 4.1%, while August payroll growth was revised down to 133,000 from an initially reported 162,000.
Bitcoin had already started moving higher before the employment report, but the weaker reading gave traders another reason to expect the Fed to leave interest rates unchanged later this month. At the same time, the move through $85,000 forced bearish positions out of the market.#NFPWatch
#BitcoinFundingRateTriplesTo10%
Why is Bitcoin price going up today?
Bitcoin price has climbed roughly 3% and briefly crossed $87,000 on Oct. 2 as weak U.S. jobs data reinforced expectations for an October Federal Reserve pause while a wave of short liquidations added fuel to the move.
According to CoinGecko data, Bitcoin traded around $86,300 at press time after reaching an intraday high above $87,000, recovering from levels below $84,000 earlier in the day. Trading volume rose as $BTC returned to an area last tested during its September rally.
The move gathered pace after U.S. nonfarm payrolls rose by just 29,000 in September, far below the 90,000 jobs expected by economists. Unemployment rose to 4.2% from 4.1%, while August payroll growth was revised down to 133,000 from an initially reported 162,000.
Bitcoin had already started moving higher before the employment report, but the weaker reading gave traders another reason to expect the Fed to leave interest rates unchanged later this month. At the same time, the move through $85,000 forced bearish positions out of the market.#NFPWatch
#BitcoinFundingRateTriplesTo10%
Bitcoin price has climbed roughly 3% and briefly crossed $87,000 on Oct. 2 as weak U.S. jobs data reinforced expectations for an October Federal Reserve pause while a wave of short liquidations added fuel to the move.
According to CoinGecko data, Bitcoin traded around $86,300 at press time after reaching an intraday high above $87,000, recovering from levels below $84,000 earlier in the day. Trading volume rose as $BTC returned to an area last tested during its September rally.
The move gathered pace after U.S. nonfarm payrolls rose by just 29,000 in September, far below the 90,000 jobs expected by economists. Unemployment rose to 4.2% from 4.1%, while August payroll growth was revised down to 133,000 from an initially reported 162,000.
Bitcoin had already started moving higher before the employment report, but the weaker reading gave traders another reason to expect the Fed to leave interest rates unchanged later this month. At the same time, the move through $85,000 forced bearish positions out of the market.#NFPWatch
#BitcoinFundingRateTriplesTo10%

72
·
--
See translation
Tokenized Stocks, Investor Rights, and Their Crypto Role
Tokenized stocks could give crypto-native investors access to equity exposure through crypto platforms, but a token that tracks a share price is not automatically a share. The diversification case rests on whether holders receive genuine legal rights, whether assets sit within regulated custody arrangements, and whether markets maintain reliable liquidity.
The market backdrop has shifted. The five-year US Treasury yield moved above 5% in September for the first time since 2007, and the Federal Reserve raised its target range by 25 basis points on September 16. Higher yields give investors a more competitive alternative to risk assets, sharpening comparisons between equities, crypto, and government debt.
At the same time, the industry is moving beyond crypto’s original outsider posture. Bitcoin emerged after the 2008 financial crisis as a challenge to parts of the incumbent financial system; nearly two decades later, crypto infrastructure is increasingly being considered as a route into traditional markets.
The Digital Asset Market Clarity Act advanced through the Senate Banking Committee earlier in 2026 but failed to advance in a September procedural vote. One day later, on September 17, the SEC issued a five-year, temporary, and conditional Innovation Exemption for certain Tokenized Securities Venues. The agency framed the measure as a bridge toward longer-term rulemaking, not a permanent redesign of US market structure.
Tokenized Stocks, Investor Rights, and Their Crypto Role
Tokenized stocks could give crypto-native investors access to equity exposure through crypto platforms, but a token that tracks a share price is not automatically a share. The diversification case rests on whether holders receive genuine legal rights, whether assets sit within regulated custody arrangements, and whether markets maintain reliable liquidity.
The market backdrop has shifted. The five-year US Treasury yield moved above 5% in September for the first time since 2007, and the Federal Reserve raised its target range by 25 basis points on September 16. Higher yields give investors a more competitive alternative to risk assets, sharpening comparisons between equities, crypto, and government debt.
At the same time, the industry is moving beyond crypto’s original outsider posture. Bitcoin emerged after the 2008 financial crisis as a challenge to parts of the incumbent financial system; nearly two decades later, crypto infrastructure is increasingly being considered as a route into traditional markets.
The Digital Asset Market Clarity Act advanced through the Senate Banking Committee earlier in 2026 but failed to advance in a September procedural vote. One day later, on September 17, the SEC issued a five-year, temporary, and conditional Innovation Exemption for certain Tokenized Securities Venues. The agency framed the measure as a bridge toward longer-term rulemaking, not a permanent redesign of US market structure.
Tokenized stocks could give crypto-native investors access to equity exposure through crypto platforms, but a token that tracks a share price is not automatically a share. The diversification case rests on whether holders receive genuine legal rights, whether assets sit within regulated custody arrangements, and whether markets maintain reliable liquidity.
The market backdrop has shifted. The five-year US Treasury yield moved above 5% in September for the first time since 2007, and the Federal Reserve raised its target range by 25 basis points on September 16. Higher yields give investors a more competitive alternative to risk assets, sharpening comparisons between equities, crypto, and government debt.
At the same time, the industry is moving beyond crypto’s original outsider posture. Bitcoin emerged after the 2008 financial crisis as a challenge to parts of the incumbent financial system; nearly two decades later, crypto infrastructure is increasingly being considered as a route into traditional markets.
The Digital Asset Market Clarity Act advanced through the Senate Banking Committee earlier in 2026 but failed to advance in a September procedural vote. One day later, on September 17, the SEC issued a five-year, temporary, and conditional Innovation Exemption for certain Tokenized Securities Venues. The agency framed the measure as a bridge toward longer-term rulemaking, not a permanent redesign of US market structure.


46
·
--
See translation
5 Reasons Why Bitcoin Price Is Going Up Today
Bitcoin price is skyrocketing on Friday, trading towards $87,000 and up 4% over the past 24 hours. This comes amid a broader crypto market recovery despite higher bond yields globally. Here are 5 reasons why Bitcoin price is going up today.
5 Reasons Why Bitcoin Price Is Going Up Today
Bitcoin price is skyrocketing on Friday, trading towards $87,000 and up 4% over the past 24 hours. This comes amid a broader crypto market recovery despite higher bond yields globally. Here are 5 reasons why Bitcoin price is going up today.
Bitcoin price is skyrocketing on Friday, trading towards $87,000 and up 4% over the past 24 hours. This comes amid a broader crypto market recovery despite higher bond yields globally. Here are 5 reasons why Bitcoin price is going up today.

68
·
--
See translation
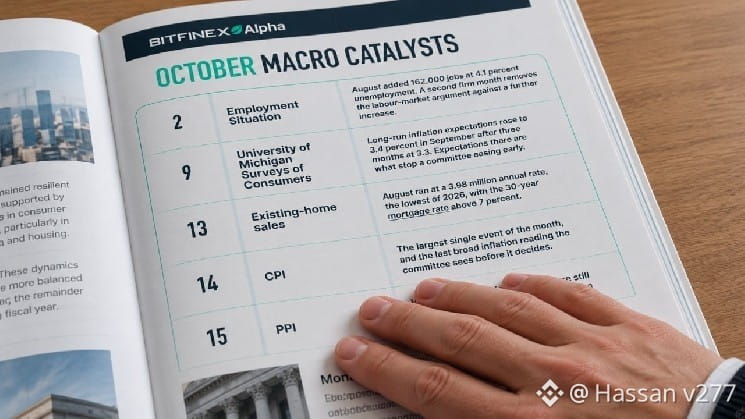
Bitfinex Lists 17 Macro Catalysts That Could Move Bitcoin in October
Bitcoin Needs Buying Demand to Offset Higher Yields
Bitcoin traders face a month in which economic data could change rate expectations while higher Treasury returns compete with cryptocurrency holdings. Crypto exchange Bitfinex outlined that tension in its October macro outlook published Oct. 1. Its central view is that further gains require spot demand, or purchases of bitcoin itself, while financial conditions remain restrictive.
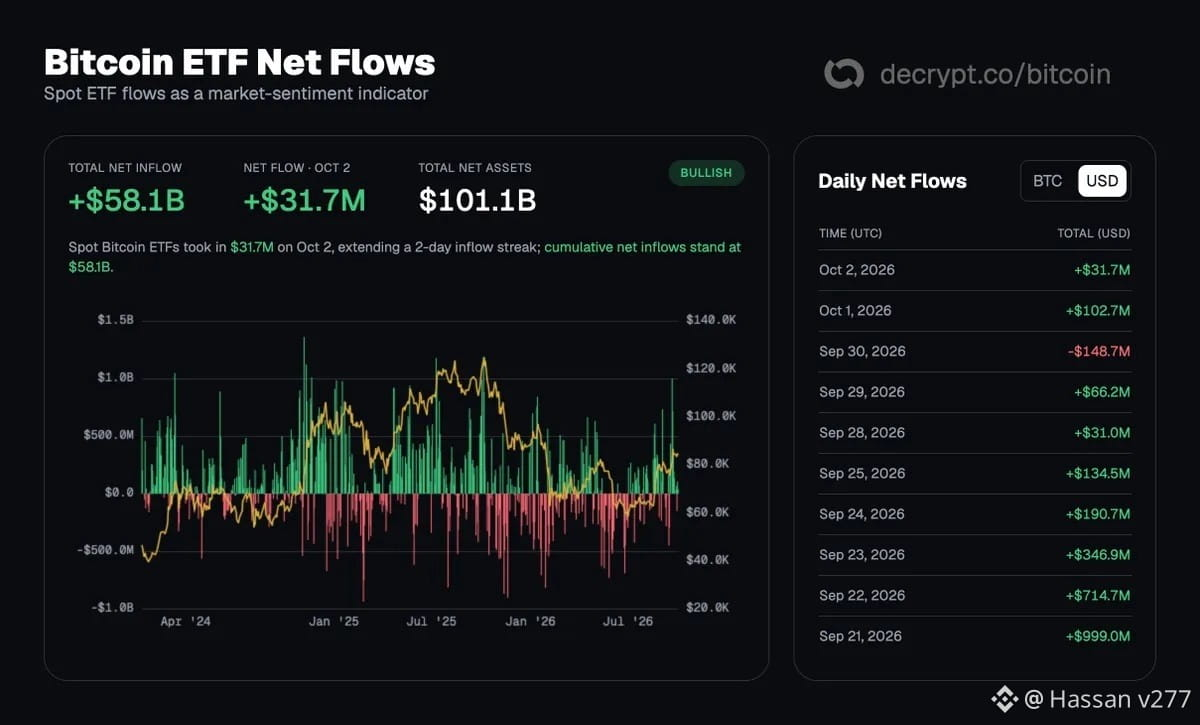
Investment funds provide one channel for that demand by connecting traditional brokerage accounts with exposure to bitcoin’s price. Spot bitcoin exchange-traded funds hold the cryptocurrency rather than futures contracts. Bitfinex attributes September’s approximately 6% advance partly to roughly $2.5 billion in net U.S. spot ETF inflows during the three weeks through Sept. 29.
Buying continued near September’s end, though daily additions slowed substantially compared with the previous week’s larger allocations. U.S. bitcoin ETFs attracted $66.19 million on Sept. 29, extending their inflow streak to nine sessions. For Bitfinex, October tests whether purchases remain strong enough to sustain gains against higher inflation-adjusted ret
Bitfinex Lists 17 Macro Catalysts That Could Move Bitcoin in October
Bitcoin Needs Buying Demand to Offset Higher Yields
Bitcoin traders face a month in which economic data could change rate expectations while higher Treasury returns compete with cryptocurrency holdings. Crypto exchange Bitfinex outlined that tension in its October macro outlook published Oct. 1. Its central view is that further gains require spot demand, or purchases of bitcoin itself, while financial conditions remain restrictive.
Investment funds provide one channel for that demand by connecting traditional brokerage accounts with exposure to bitcoin’s price. Spot bitcoin exchange-traded funds hold the cryptocurrency rather than futures contracts. Bitfinex attributes September’s approximately 6% advance partly to roughly $2.5 billion in net U.S. spot ETF inflows during the three weeks through Sept. 29.
Buying continued near September’s end, though daily additions slowed substantially compared with the previous week’s larger allocations. U.S. bitcoin ETFs attracted $66.19 million on Sept. 29, extending their inflow streak to nine sessions. For Bitfinex, October tests whether purchases remain strong enough to sustain gains against higher inflation-adjusted ret
Bitcoin Needs Buying Demand to Offset Higher Yields
Bitcoin traders face a month in which economic data could change rate expectations while higher Treasury returns compete with cryptocurrency holdings. Crypto exchange Bitfinex outlined that tension in its October macro outlook published Oct. 1. Its central view is that further gains require spot demand, or purchases of bitcoin itself, while financial conditions remain restrictive.
Investment funds provide one channel for that demand by connecting traditional brokerage accounts with exposure to bitcoin’s price. Spot bitcoin exchange-traded funds hold the cryptocurrency rather than futures contracts. Bitfinex attributes September’s approximately 6% advance partly to roughly $2.5 billion in net U.S. spot ETF inflows during the three weeks through Sept. 29.
Buying continued near September’s end, though daily additions slowed substantially compared with the previous week’s larger allocations. U.S. bitcoin ETFs attracted $66.19 million on Sept. 29, extending their inflow streak to nine sessions. For Bitfinex, October tests whether purchases remain strong enough to sustain gains against higher inflation-adjusted ret
82
·
--
See translation
Bitcoin’s October outlook hinges on $82K support, analysts say
Bitcoin has surrendered a post-inflation rally above $85,500 to trade around $83,500, according to ViaBTC’s Jeff Ko, as analysts have identified $82,000 as the key support level entering October.
Jeff Ko, chief analyst at ViaBTC, and Lacie Zhang, research lead at Bitget Wallet, told crypto.news that Bitcoin’s October performance will depend on institutional demand and U.S. economic data, with both identifying $82,000 as a key downside level.
In Ko’s account, Bitcoin rose more than 2% immediately after the latest Personal Consumption Expenditures inflation release, briefly moving above $85,500 before giving back the advance. Zhang’s October forecast puts the trading range between $78,000 and $95,000, conditional on demand holding up against inflation and interest-rate risks.
Bitcoin’s $82,000 support sits near liquidation exposure
For Ko, $82,000 matters because liquidation clusters become much thinner below that price. Zhang places the main downside liquidation zone between $82,000 and $82,500 and warns that losing the area could accelerate a decline toward $80,000.
Earlier CoinGlass data showed a similar concentration of leveraged positions. A Sep. 29 report identified a dense liquidation band around $82,300–$82,600, with another concentration near $85,400–$85,700 above the market.
Under Zhang’s bullish scenario, Bitcoin must hold $82,000 and reclaim $87,500 before a move toward $95,000 becomes possible. She also sees a break above $87,500 increasing the likelihood of a short squeeze, while a sustained decline below $80,000 would invalidate her seasonal bullish setup.
Bitcoin’s October outlook hinges on $82K support, analysts say
Bitcoin has surrendered a post-inflation rally above $85,500 to trade around $83,500, according to ViaBTC’s Jeff Ko, as analysts have identified $82,000 as the key support level entering October.
Jeff Ko, chief analyst at ViaBTC, and Lacie Zhang, research lead at Bitget Wallet, told crypto.news that Bitcoin’s October performance will depend on institutional demand and U.S. economic data, with both identifying $82,000 as a key downside level.
In Ko’s account, Bitcoin rose more than 2% immediately after the latest Personal Consumption Expenditures inflation release, briefly moving above $85,500 before giving back the advance. Zhang’s October forecast puts the trading range between $78,000 and $95,000, conditional on demand holding up against inflation and interest-rate risks.
Bitcoin’s $82,000 support sits near liquidation exposure
For Ko, $82,000 matters because liquidation clusters become much thinner below that price. Zhang places the main downside liquidation zone between $82,000 and $82,500 and warns that losing the area could accelerate a decline toward $80,000.
Earlier CoinGlass data showed a similar concentration of leveraged positions. A Sep. 29 report identified a dense liquidation band around $82,300–$82,600, with another concentration near $85,400–$85,700 above the market.
Under Zhang’s bullish scenario, Bitcoin must hold $82,000 and reclaim $87,500 before a move toward $95,000 becomes possible. She also sees a break above $87,500 increasing the likelihood of a short squeeze, while a sustained decline below $80,000 would invalidate her seasonal bullish setup.
Bitcoin has surrendered a post-inflation rally above $85,500 to trade around $83,500, according to ViaBTC’s Jeff Ko, as analysts have identified $82,000 as the key support level entering October.
Jeff Ko, chief analyst at ViaBTC, and Lacie Zhang, research lead at Bitget Wallet, told crypto.news that Bitcoin’s October performance will depend on institutional demand and U.S. economic data, with both identifying $82,000 as a key downside level.
In Ko’s account, Bitcoin rose more than 2% immediately after the latest Personal Consumption Expenditures inflation release, briefly moving above $85,500 before giving back the advance. Zhang’s October forecast puts the trading range between $78,000 and $95,000, conditional on demand holding up against inflation and interest-rate risks.
Bitcoin’s $82,000 support sits near liquidation exposure
For Ko, $82,000 matters because liquidation clusters become much thinner below that price. Zhang places the main downside liquidation zone between $82,000 and $82,500 and warns that losing the area could accelerate a decline toward $80,000.
Earlier CoinGlass data showed a similar concentration of leveraged positions. A Sep. 29 report identified a dense liquidation band around $82,300–$82,600, with another concentration near $85,400–$85,700 above the market.
Under Zhang’s bullish scenario, Bitcoin must hold $82,000 and reclaim $87,500 before a move toward $95,000 becomes possible. She also sees a break above $87,500 increasing the likelihood of a short squeeze, while a sustained decline below $80,000 would invalidate her seasonal bullish setup.

83
·
--
See translation
Bitcoin Price News: The Hidden Number Deciding If Altcoins Rally Next
Bitcoin is trying to stay above the $83,000 level, and according to a technical analyst tracking the chart, this is actually working out well for many altcoins. Almost every day right now, a different altcoin is breaking out. Today saw a few small pullbacks, but nothing serious. As long as Bitcoin holds above this level, that trend could keep going.
Bitcoin’s Bigger Picture Still Looks Strong
Looking at the bigger trend since Bitcoin’s low back in July, the analyst says Bitcoin has already met the basic requirements of a strong upward move, meaning price has been making higher highs and higher lows. If this move stretches a bit further, he’s watching three resistance levels above, $88,600, $92,200, and $97,637.
But he was clear about one important thing. If Bitcoin breaks clearly below the $83,000 area, not just a brief dip, but a real, confirmed break, that would shift attention down to the next support zone instead.😊😊❤️❤️
Bitcoin Price News: The Hidden Number Deciding If Altcoins Rally Next
Bitcoin is trying to stay above the $83,000 level, and according to a technical analyst tracking the chart, this is actually working out well for many altcoins. Almost every day right now, a different altcoin is breaking out. Today saw a few small pullbacks, but nothing serious. As long as Bitcoin holds above this level, that trend could keep going.
Bitcoin’s Bigger Picture Still Looks Strong
Looking at the bigger trend since Bitcoin’s low back in July, the analyst says Bitcoin has already met the basic requirements of a strong upward move, meaning price has been making higher highs and higher lows. If this move stretches a bit further, he’s watching three resistance levels above, $88,600, $92,200, and $97,637.
But he was clear about one important thing. If Bitcoin breaks clearly below the $83,000 area, not just a brief dip, but a real, confirmed break, that would shift attention down to the next support zone instead.😊😊❤️❤️
Bitcoin is trying to stay above the $83,000 level, and according to a technical analyst tracking the chart, this is actually working out well for many altcoins. Almost every day right now, a different altcoin is breaking out. Today saw a few small pullbacks, but nothing serious. As long as Bitcoin holds above this level, that trend could keep going.
Bitcoin’s Bigger Picture Still Looks Strong
Looking at the bigger trend since Bitcoin’s low back in July, the analyst says Bitcoin has already met the basic requirements of a strong upward move, meaning price has been making higher highs and higher lows. If this move stretches a bit further, he’s watching three resistance levels above, $88,600, $92,200, and $97,637.
But he was clear about one important thing. If Bitcoin breaks clearly below the $83,000 area, not just a brief dip, but a real, confirmed break, that would shift attention down to the next support zone instead.😊😊❤️❤️

77
·
--
2
1.6k
·
--
See translation
Why Crypto Rallied Instead Of Crashing After CLARITY Act Failed
Bitcoin hit $86,000 on September 21, a level unseen since January 28. Experts called it “the first day of the bull market,” pointing to a puzzling market reaction. Two events widely expected to hurt crypto, the CLARITY Act’s failure and a 25 basis point Fed rate hike, instead coincided with Bitcoin climbing roughly 15% in just six days.
Why Bad News Didn’t Trigger A Selloff
Analyst John Gillen’s explanation rests on a simple idea: both events had already been priced in well before they actually happened. Prediction markets and yield curve pricing had made a Fed hike feel almost demanded by traders, so when it arrived, the reaction was muted rather than negative rather than negative.
The CLARITY Act’s failure followed the same logic, weeks of uncertainty had already been weighing on prices, and once the outcome landed, whether good or bad, that overhang simply lifted.
His more pointed read went further. He argued the CLARITY Act had quietly evolved into legislation designed to protect banks rather than help crypto, making its failure less a setback and more what he called a “max bullish outcome” for the industry.
Why Crypto Rallied Instead Of Crashing After CLARITY Act Failed
Bitcoin hit $86,000 on September 21, a level unseen since January 28. Experts called it “the first day of the bull market,” pointing to a puzzling market reaction. Two events widely expected to hurt crypto, the CLARITY Act’s failure and a 25 basis point Fed rate hike, instead coincided with Bitcoin climbing roughly 15% in just six days.
Why Bad News Didn’t Trigger A Selloff
Analyst John Gillen’s explanation rests on a simple idea: both events had already been priced in well before they actually happened. Prediction markets and yield curve pricing had made a Fed hike feel almost demanded by traders, so when it arrived, the reaction was muted rather than negative rather than negative.
The CLARITY Act’s failure followed the same logic, weeks of uncertainty had already been weighing on prices, and once the outcome landed, whether good or bad, that overhang simply lifted.
His more pointed read went further. He argued the CLARITY Act had quietly evolved into legislation designed to protect banks rather than help crypto, making its failure less a setback and more what he called a “max bullish outcome” for the industry.
Bitcoin hit $86,000 on September 21, a level unseen since January 28. Experts called it “the first day of the bull market,” pointing to a puzzling market reaction. Two events widely expected to hurt crypto, the CLARITY Act’s failure and a 25 basis point Fed rate hike, instead coincided with Bitcoin climbing roughly 15% in just six days.
Why Bad News Didn’t Trigger A Selloff
Analyst John Gillen’s explanation rests on a simple idea: both events had already been priced in well before they actually happened. Prediction markets and yield curve pricing had made a Fed hike feel almost demanded by traders, so when it arrived, the reaction was muted rather than negative rather than negative.
The CLARITY Act’s failure followed the same logic, weeks of uncertainty had already been weighing on prices, and once the outcome landed, whether good or bad, that overhang simply lifted.
His more pointed read went further. He argued the CLARITY Act had quietly evolved into legislation designed to protect banks rather than help crypto, making its failure less a setback and more what he called a “max bullish outcome” for the industry.

54
·
--
See translation
Ethereum Price Faces a Reality Check as EIP-8288 Puts Its Technology to the Test
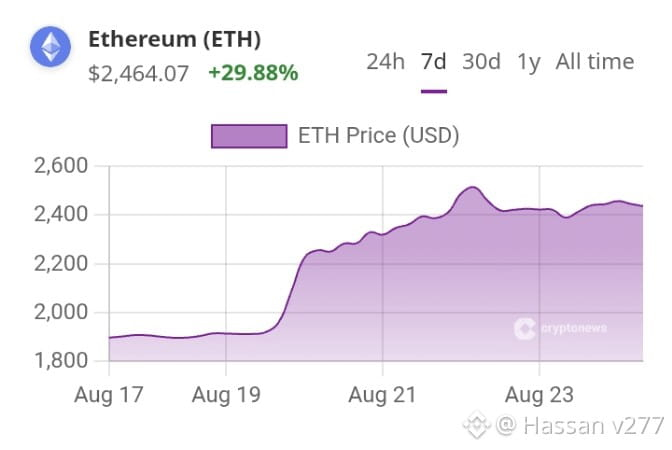
Ethereum price is trading at $2,465, steady and calm on the surface. Underneath it, the network is being asked a much harder question: can it actually deliver post-quantum cryptography at scale, or is this another roadmap promise that outruns its execution timeline?
The catalyst is EIP-8288, a proposal from Vitalik Buterin introducing a recursive STARK aggregation mempool framework designed to make Ethereum more quantum-resistant and more efficient at processing cryptographic proofs. The proposal merged into the official EIP repository on September 9, 2026.
Can Ethereum Price Hit $2,600 This Week?
ETH sits at $2,465, essentially flat on the day, with volume holding near $15.82 billion across major venues. Technically, the setup is a coiled range: resistance clusters around $2,544–$2,600, with a breakout above $2,600 needed to open a run toward $2,800. Support sits at $2,438–$2,440, reinforced by the 50-week moving average and a Fibonacci cluster.
The bull case sees EIP-8288 gaining developer traction while softer CPI data helps ETH clear $2,550, opening targets at $2,656 and $2,786. The base case has ETH chopping between $2,440 and $2,550 as traders wait for clearer roadmap signals.
Ethereum Price Faces a Reality Check as EIP-8288 Puts Its Technology to the Test
Ethereum price is trading at $2,465, steady and calm on the surface. Underneath it, the network is being asked a much harder question: can it actually deliver post-quantum cryptography at scale, or is this another roadmap promise that outruns its execution timeline?
The catalyst is EIP-8288, a proposal from Vitalik Buterin introducing a recursive STARK aggregation mempool framework designed to make Ethereum more quantum-resistant and more efficient at processing cryptographic proofs. The proposal merged into the official EIP repository on September 9, 2026.
Can Ethereum Price Hit $2,600 This Week?
ETH sits at $2,465, essentially flat on the day, with volume holding near $15.82 billion across major venues. Technically, the setup is a coiled range: resistance clusters around $2,544–$2,600, with a breakout above $2,600 needed to open a run toward $2,800. Support sits at $2,438–$2,440, reinforced by the 50-week moving average and a Fibonacci cluster.
The bull case sees EIP-8288 gaining developer traction while softer CPI data helps ETH clear $2,550, opening targets at $2,656 and $2,786. The base case has ETH chopping between $2,440 and $2,550 as traders wait for clearer roadmap signals.
Ethereum price is trading at $2,465, steady and calm on the surface. Underneath it, the network is being asked a much harder question: can it actually deliver post-quantum cryptography at scale, or is this another roadmap promise that outruns its execution timeline?
The catalyst is EIP-8288, a proposal from Vitalik Buterin introducing a recursive STARK aggregation mempool framework designed to make Ethereum more quantum-resistant and more efficient at processing cryptographic proofs. The proposal merged into the official EIP repository on September 9, 2026.
Can Ethereum Price Hit $2,600 This Week?
ETH sits at $2,465, essentially flat on the day, with volume holding near $15.82 billion across major venues. Technically, the setup is a coiled range: resistance clusters around $2,544–$2,600, with a breakout above $2,600 needed to open a run toward $2,800. Support sits at $2,438–$2,440, reinforced by the 50-week moving average and a Fibonacci cluster.
The bull case sees EIP-8288 gaining developer traction while softer CPI data helps ETH clear $2,550, opening targets at $2,656 and $2,786. The base case has ETH chopping between $2,440 and $2,550 as traders wait for clearer roadmap signals.

54
·
--
See translation
Bitcoin tests critical $76,000 support cluster during macro energy shock
Bitcoin fell below $77,000 on Sept. 10 as oil rose above $100, and a global bond selloff pushed traders toward another Fed hike.
$BTC reached an intraday low of $76,676.07, Nasdaq 100 futures fell 0.7%, and the 10-year Treasury yield climbed to 4.93% while the 30-year touched 5.35%, its highest level in 19 years.
The moves followed another acceleration in US producer prices and a renewed surge in crude, pushing rate markets to price in about a 76% chance of a quarter-point Federal Reserve increase next week.
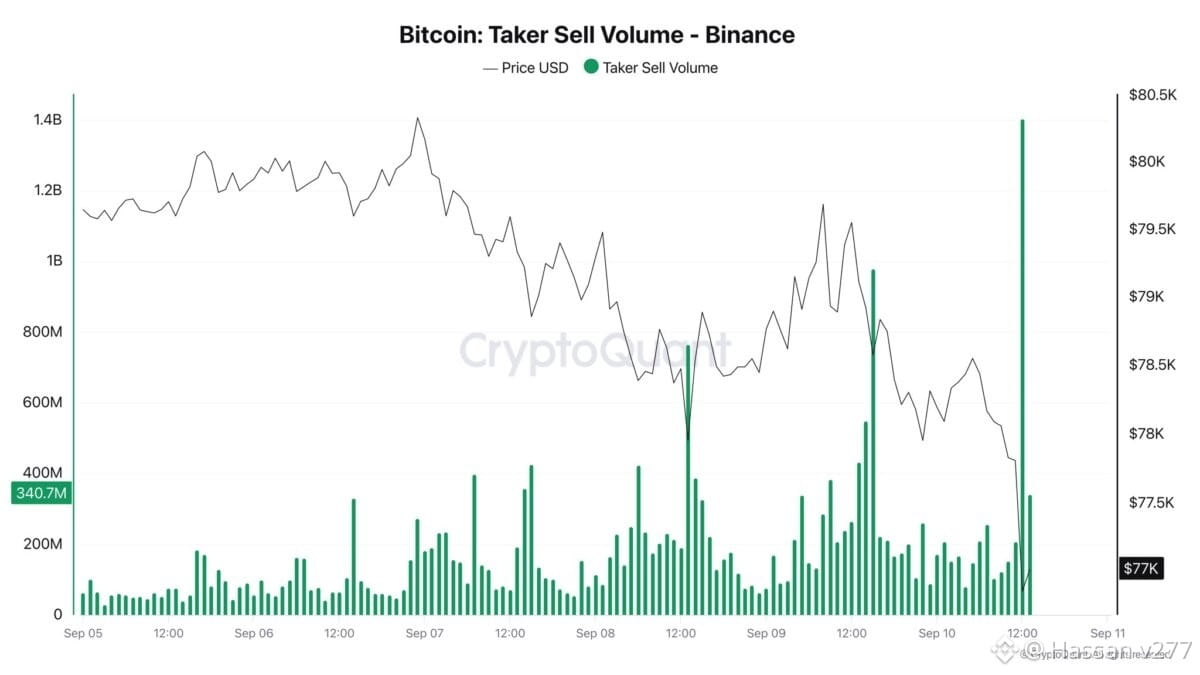
Chart shows Bitcoin’s Binance taker sell volume spiking near $1.4 billion as its price fell toward $77,000 on Sept. 10. Source: CryptoQuant
The selloff has also pushed Bitcoin back into a price zone where recent buyers had been accumulating coins.
Glassnode data show supply building between roughly $76,000 and $82,000 beneath a much heavier long-term-holder block between $83,000 and $86,000, where about 1.07 million $BTC were acquired.
That leaves the Sept. 10 decline testing a support cluster that formed during the latest recovery.
Bitcoin tests critical $76,000 support cluster during macro energy shock
Bitcoin fell below $77,000 on Sept. 10 as oil rose above $100, and a global bond selloff pushed traders toward another Fed hike.
$BTC reached an intraday low of $76,676.07, Nasdaq 100 futures fell 0.7%, and the 10-year Treasury yield climbed to 4.93% while the 30-year touched 5.35%, its highest level in 19 years.
The moves followed another acceleration in US producer prices and a renewed surge in crude, pushing rate markets to price in about a 76% chance of a quarter-point Federal Reserve increase next week.
Chart shows Bitcoin’s Binance taker sell volume spiking near $1.4 billion as its price fell toward $77,000 on Sept. 10. Source: CryptoQuant
The selloff has also pushed Bitcoin back into a price zone where recent buyers had been accumulating coins.
Glassnode data show supply building between roughly $76,000 and $82,000 beneath a much heavier long-term-holder block between $83,000 and $86,000, where about 1.07 million $BTC were acquired.
That leaves the Sept. 10 decline testing a support cluster that formed during the latest recovery.
Bitcoin fell below $77,000 on Sept. 10 as oil rose above $100, and a global bond selloff pushed traders toward another Fed hike.
$BTC reached an intraday low of $76,676.07, Nasdaq 100 futures fell 0.7%, and the 10-year Treasury yield climbed to 4.93% while the 30-year touched 5.35%, its highest level in 19 years.
The moves followed another acceleration in US producer prices and a renewed surge in crude, pushing rate markets to price in about a 76% chance of a quarter-point Federal Reserve increase next week.
Chart shows Bitcoin’s Binance taker sell volume spiking near $1.4 billion as its price fell toward $77,000 on Sept. 10. Source: CryptoQuant
The selloff has also pushed Bitcoin back into a price zone where recent buyers had been accumulating coins.
Glassnode data show supply building between roughly $76,000 and $82,000 beneath a much heavier long-term-holder block between $83,000 and $86,000, where about 1.07 million $BTC were acquired.
That leaves the Sept. 10 decline testing a support cluster that formed during the latest recovery.

58
·
--
See translation
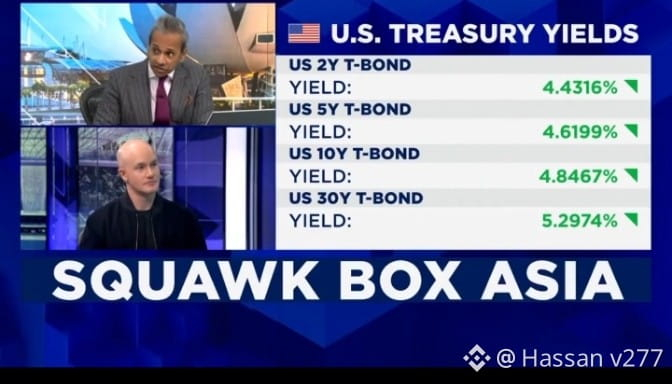
🚨JUST IN: Coinbase CEO Brian Armstrong says crypto wins no matter how the CLARITY Act vote turns out.
“If it passes, we get legislation,”
“If it doesn’t pass, the SEC and CFTC are ready to issue rules.”
Armstrong said the Sept. 15 Senate vote will bring regulatory clarity regardless of the outcome while speaking on CNBC early Thursday morning.
He added that the bill is “ready to get a YES vote,” saying the senators he has spoken with are on board.
Armstrong said the main issue still standing in the way is ethics rules for government officials holding digital assets.
🚨JUST IN: Coinbase CEO Brian Armstrong says crypto wins no matter how the CLARITY Act vote turns out.
“If it passes, we get legislation,”
“If it doesn’t pass, the SEC and CFTC are ready to issue rules.”
Armstrong said the Sept. 15 Senate vote will bring regulatory clarity regardless of the outcome while speaking on CNBC early Thursday morning.
He added that the bill is “ready to get a YES vote,” saying the senators he has spoken with are on board.
Armstrong said the main issue still standing in the way is ethics rules for government officials holding digital assets.
“If it passes, we get legislation,”
“If it doesn’t pass, the SEC and CFTC are ready to issue rules.”
Armstrong said the Sept. 15 Senate vote will bring regulatory clarity regardless of the outcome while speaking on CNBC early Thursday morning.
He added that the bill is “ready to get a YES vote,” saying the senators he has spoken with are on board.
Armstrong said the main issue still standing in the way is ethics rules for government officials holding digital assets.

Best Wishes!
From Hassan v277
4
·
--
See translation
🚨🇮🇷💥IRAN GOES CRYPTO💥 🇮🇷🚨
Iran is turning to crypto to keep cross-border trade moving under U.S. sanctions, according to the Financial Times.
USDT and Bitcoin are being used for settlements.
Sanctions are closing doors.
CRYPTO IS OPENING NEW ONES. 🌎🔥
🚨🇮🇷💥IRAN GOES CRYPTO💥 🇮🇷🚨
Iran is turning to crypto to keep cross-border trade moving under U.S. sanctions, according to the Financial Times.
USDT and Bitcoin are being used for settlements.
Sanctions are closing doors.
CRYPTO IS OPENING NEW ONES. 🌎🔥
Iran is turning to crypto to keep cross-border trade moving under U.S. sanctions, according to the Financial Times.
USDT and Bitcoin are being used for settlements.
Sanctions are closing doors.
CRYPTO IS OPENING NEW ONES. 🌎🔥


Best Wishes!
From Hassan v277
3
·
--
See translation
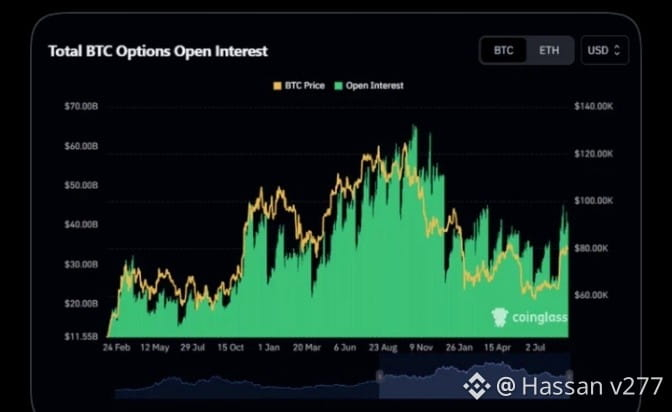
🐋 WHALE WATCH : $BTC options open interest is rebounding quite strongly. Looking at the chart the total Bitcoin Options OI has now turned back up to the range of about 40 to 45 billion USD after having dropped significantly from the peak above 60 billion USD. Notably OI is recovering while BTC is also bouncing back around the 80000 USD level. This indicates that activity in the options market is heating up and more positions are being opened. However an increase in OI doesnt automatically mean BTC will rise. It just shows that capital and positions are accumulating more substantially meaning the subsequent fluctuations are even more worth watching. Is BTC gearing up for a major breakout or is the derivatives market just getting too crowded again ?
🐋 WHALE WATCH : $BTC options open interest is rebounding quite strongly. Looking at the chart the total Bitcoin Options OI has now turned back up to the range of about 40 to 45 billion USD after having dropped significantly from the peak above 60 billion USD. Notably OI is recovering while BTC is also bouncing back around the 80000 USD level. This indicates that activity in the options market is heating up and more positions are being opened. However an increase in OI doesnt automatically mean BTC will rise. It just shows that capital and positions are accumulating more substantially meaning the subsequent fluctuations are even more worth watching. Is BTC gearing up for a major breakout or is the derivatives market just getting too crowded again ?
65
·
--
See translation
Institutional Interest in Cryptocurrencies is Increasing; $6.7 Billion in Institutional Capital Injected into the Crypto Market in the Last 30 Days! Here Are the...
BIT, the cryptocurrency options trading platform formerly known as Matrixport, announced that institutional investors injected a total of $6.7 billion into the cryptocurrency market over the past 30 days. The data indicates that the market has returned to a net buying trend after experiencing significant capital outflows in June.
BIT’s calculations reveal this capital inflow based on the sum of Strategy’s Bitcoin purchases, net inflows into spot Bitcoin ETFs, and new stablecoin issuances. A combined assessment of these three indicators suggests that institutional capital is beginning to redirect itself towards crypto assets.
In June, the cryptocurrency market experienced a net capital outflow of approximately $13 billion. However, the $6.7 billion inflow over the last 30 days indicates a significant shift in market dynamics. This suggests that the predominantly selling trend is gradually being replaced by a net buying and capital inflow trend.
BIT stated that the improvement in capital inflows has supported the recent recovery in market sentiment. The return of institutional funds to the market is particularly contributing to limiting downward movements in the Bitcoin price and creating support at certain levels.
However, BIT stated that for Bitcoin to exhibit a stronger and more sustained upward trend, the current pace of capital inflows needs to accelerate further. According to the company, while the $6.7 billion inflow supports the market outlook, a more comprehensive rally requires an acceleration of institutional capital flows.
Institutional Interest in Cryptocurrencies is Increasing; $6.7 Billion in Institutional Capital Injected into the Crypto Market in the Last 30 Days! Here Are the...
BIT, the cryptocurrency options trading platform formerly known as Matrixport, announced that institutional investors injected a total of $6.7 billion into the cryptocurrency market over the past 30 days. The data indicates that the market has returned to a net buying trend after experiencing significant capital outflows in June.
BIT’s calculations reveal this capital inflow based on the sum of Strategy’s Bitcoin purchases, net inflows into spot Bitcoin ETFs, and new stablecoin issuances. A combined assessment of these three indicators suggests that institutional capital is beginning to redirect itself towards crypto assets.
In June, the cryptocurrency market experienced a net capital outflow of approximately $13 billion. However, the $6.7 billion inflow over the last 30 days indicates a significant shift in market dynamics. This suggests that the predominantly selling trend is gradually being replaced by a net buying and capital inflow trend.
BIT stated that the improvement in capital inflows has supported the recent recovery in market sentiment. The return of institutional funds to the market is particularly contributing to limiting downward movements in the Bitcoin price and creating support at certain levels.
However, BIT stated that for Bitcoin to exhibit a stronger and more sustained upward trend, the current pace of capital inflows needs to accelerate further. According to the company, while the $6.7 billion inflow supports the market outlook, a more comprehensive rally requires an acceleration of institutional capital flows.
BIT, the cryptocurrency options trading platform formerly known as Matrixport, announced that institutional investors injected a total of $6.7 billion into the cryptocurrency market over the past 30 days. The data indicates that the market has returned to a net buying trend after experiencing significant capital outflows in June.
BIT’s calculations reveal this capital inflow based on the sum of Strategy’s Bitcoin purchases, net inflows into spot Bitcoin ETFs, and new stablecoin issuances. A combined assessment of these three indicators suggests that institutional capital is beginning to redirect itself towards crypto assets.
In June, the cryptocurrency market experienced a net capital outflow of approximately $13 billion. However, the $6.7 billion inflow over the last 30 days indicates a significant shift in market dynamics. This suggests that the predominantly selling trend is gradually being replaced by a net buying and capital inflow trend.
BIT stated that the improvement in capital inflows has supported the recent recovery in market sentiment. The return of institutional funds to the market is particularly contributing to limiting downward movements in the Bitcoin price and creating support at certain levels.
However, BIT stated that for Bitcoin to exhibit a stronger and more sustained upward trend, the current pace of capital inflows needs to accelerate further. According to the company, while the $6.7 billion inflow supports the market outlook, a more comprehensive rally requires an acceleration of institutional capital flows.

Best Wishes!
From Hassan v277
4
·
--
See translation
Bitcoin recovers toward $79,000 as Zcash records a $500 million ETF haul
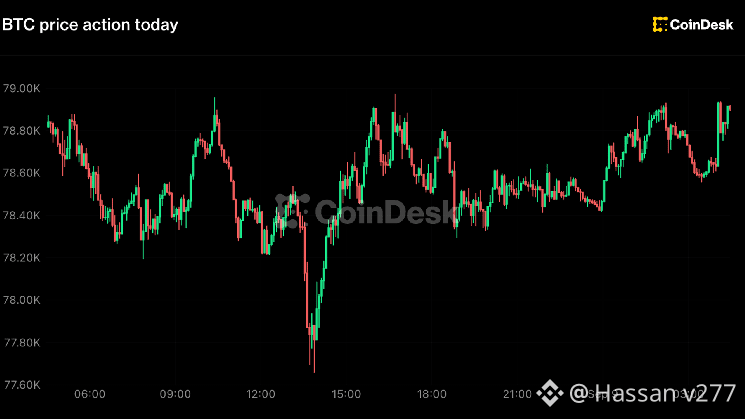
Bitcoin dropped below $78,000 on Tuesday, hitting $77,666 before buyers took it back to nearly $78,900 as of Asian morning hours on Wednesday, according to CoinDesk data.
The round trip left the token little changed over 24 hours and just under 2% higher on the week. The money that moved went to zcash, where Grayscale said its Zcash ETF crossed $500 million in assets two weeks after listing on NYSE Arca.
The fund, trading under ZCSH, took in more than $70 million of cumulative inflows since its Aug. 25 debut on top of a $100 million investment from DCG International Investments, according to Grayscale
We're proud to share The Zcash ETF $ZCSH has crossed $500M+ in AUM.
The only $ZEC fund in the world now holds over 550,000 $ZEC.
This milestone reflects continued investor conviction in Zcash and the demand for privacy in the digital asset ecosystem.
Full announcement… pic.twitter.com/mnaVl5d3tV
— The Zcash ETF 🛡️ (@ZcashETF) September 8, 2026
It now holds more than 550,000 $ZEC, or roughly 3% of the token's 16.9 million circulating supply, pulled out of float in a fortnight. $ZEC traded past $1,180 on the day, up more than 4%, with about $1 billion in 24-hour volume against a $20 billion market value that has carried it to tenth largest in the past week.
BNB was the standout among the rest at about $755, up nearly 2%, while tron added more than 1% to roughly 34 cents and XRP gained about 1% to $1.42. Ether held near $2,490 and solana near $103, both close to unchanged. Dogecoin sat near 9 cents and hyperliquid's HYPE edged up to almost $86. Total market value stood at about $2.8 trillion.
Bitcoin recovers toward $79,000 as Zcash records a $500 million ETF haul
Bitcoin dropped below $78,000 on Tuesday, hitting $77,666 before buyers took it back to nearly $78,900 as of Asian morning hours on Wednesday, according to CoinDesk data.
The round trip left the token little changed over 24 hours and just under 2% higher on the week. The money that moved went to zcash, where Grayscale said its Zcash ETF crossed $500 million in assets two weeks after listing on NYSE Arca.
The fund, trading under ZCSH, took in more than $70 million of cumulative inflows since its Aug. 25 debut on top of a $100 million investment from DCG International Investments, according to Grayscale
We're proud to share The Zcash ETF $ZCSH has crossed $500M+ in AUM.
The only $ZEC fund in the world now holds over 550,000 $ZEC.
This milestone reflects continued investor conviction in Zcash and the demand for privacy in the digital asset ecosystem.
Full announcement… pic.twitter.com/mnaVl5d3tV
— The Zcash ETF 🛡️ (@ZcashETF) September 8, 2026
It now holds more than 550,000 $ZEC, or roughly 3% of the token's 16.9 million circulating supply, pulled out of float in a fortnight. $ZEC traded past $1,180 on the day, up more than 4%, with about $1 billion in 24-hour volume against a $20 billion market value that has carried it to tenth largest in the past week.
BNB was the standout among the rest at about $755, up nearly 2%, while tron added more than 1% to roughly 34 cents and XRP gained about 1% to $1.42. Ether held near $2,490 and solana near $103, both close to unchanged. Dogecoin sat near 9 cents and hyperliquid's HYPE edged up to almost $86. Total market value stood at about $2.8 trillion.
Bitcoin dropped below $78,000 on Tuesday, hitting $77,666 before buyers took it back to nearly $78,900 as of Asian morning hours on Wednesday, according to CoinDesk data.
The round trip left the token little changed over 24 hours and just under 2% higher on the week. The money that moved went to zcash, where Grayscale said its Zcash ETF crossed $500 million in assets two weeks after listing on NYSE Arca.
The fund, trading under ZCSH, took in more than $70 million of cumulative inflows since its Aug. 25 debut on top of a $100 million investment from DCG International Investments, according to Grayscale
We're proud to share The Zcash ETF $ZCSH has crossed $500M+ in AUM.
The only $ZEC fund in the world now holds over 550,000 $ZEC.
This milestone reflects continued investor conviction in Zcash and the demand for privacy in the digital asset ecosystem.
Full announcement… pic.twitter.com/mnaVl5d3tV
— The Zcash ETF 🛡️ (@ZcashETF) September 8, 2026
It now holds more than 550,000 $ZEC, or roughly 3% of the token's 16.9 million circulating supply, pulled out of float in a fortnight. $ZEC traded past $1,180 on the day, up more than 4%, with about $1 billion in 24-hour volume against a $20 billion market value that has carried it to tenth largest in the past week.
BNB was the standout among the rest at about $755, up nearly 2%, while tron added more than 1% to roughly 34 cents and XRP gained about 1% to $1.42. Ether held near $2,490 and solana near $103, both close to unchanged. Dogecoin sat near 9 cents and hyperliquid's HYPE edged up to almost $86. Total market value stood at about $2.8 trillion.
Best Wishes!
From Hassan v277
9
Log in to explore more content
Join global crypto users on Binance Square
⚡️ Get latest and useful information about crypto.
💬 Trusted by the world’s largest crypto exchange.
👍 Discover real insights from verified creators.
Email / Phone number
Trending Topics
ADAGains10%Above$0.27
5,755 views
127 Discussing
$ADA is making a strong move today jumping over 10 percent to around 027 and breaking into a new 90 day high
Trading volume has also surged above 1 billion showing strong market activity
The move comes as $ADA continues its recovery from the June lows while its recent technical structure has turned more bullish
The 027 to 028 zone is now the key area to watch A sustained breakout could open the door toward higher resistance levels
But after such a sharp daily move volatility could remain high
#ADAGains10%Above$0.27 #crypto #ADA #Cardano #crypto #Write2Earn
AbdullahAbid_7
·0 Likes
·254 views
ETHUp70%InQ3ButLiquidityFalls
69,313 views
732 Discussing
EthStakingExitQueueHits2026High
25,658 views
586 Discussing