
Bitcoin is trading at $118,573 on August 10, 2025, with a market cap of $2.35 trillion and daily trading volume of $31.06 billion. The price has stayed within a tight range between $116,494 and $118,639, showing that traders are waiting for the next big move.
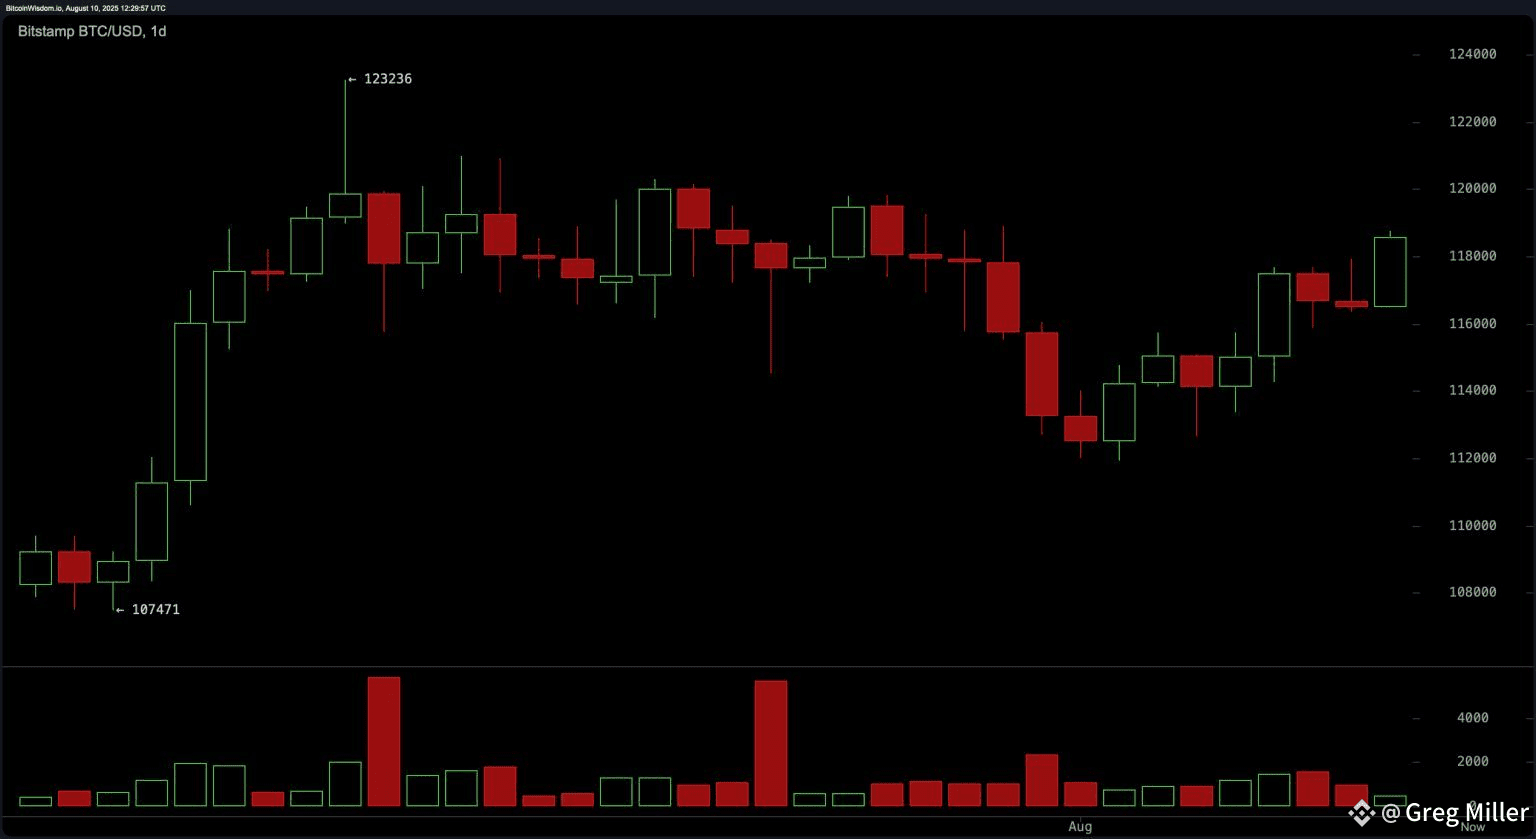
Daily Chart: Consolidation in a Wide Range
On the daily chart, Bitcoin has bounced from around $112,000 and is now trading near the upper end of its range. The key levels remain $112,000 support and $123,000 resistance.
RSI: 59 (neutral)
Stochastic: 68 (neutral)
CCI: 56 (neutral)
MACD: Sell signal
This shows the market is balanced but leaning slightly bullish, with some caution from traders.
4-Hour Chart: Higher Highs but Weak Trend Strength
Bitcoin has been making higher highs and higher lows since the bounce from $112,660. The price recently touched $118,760 on strong buying volume but faces a key hurdle at $119,000.
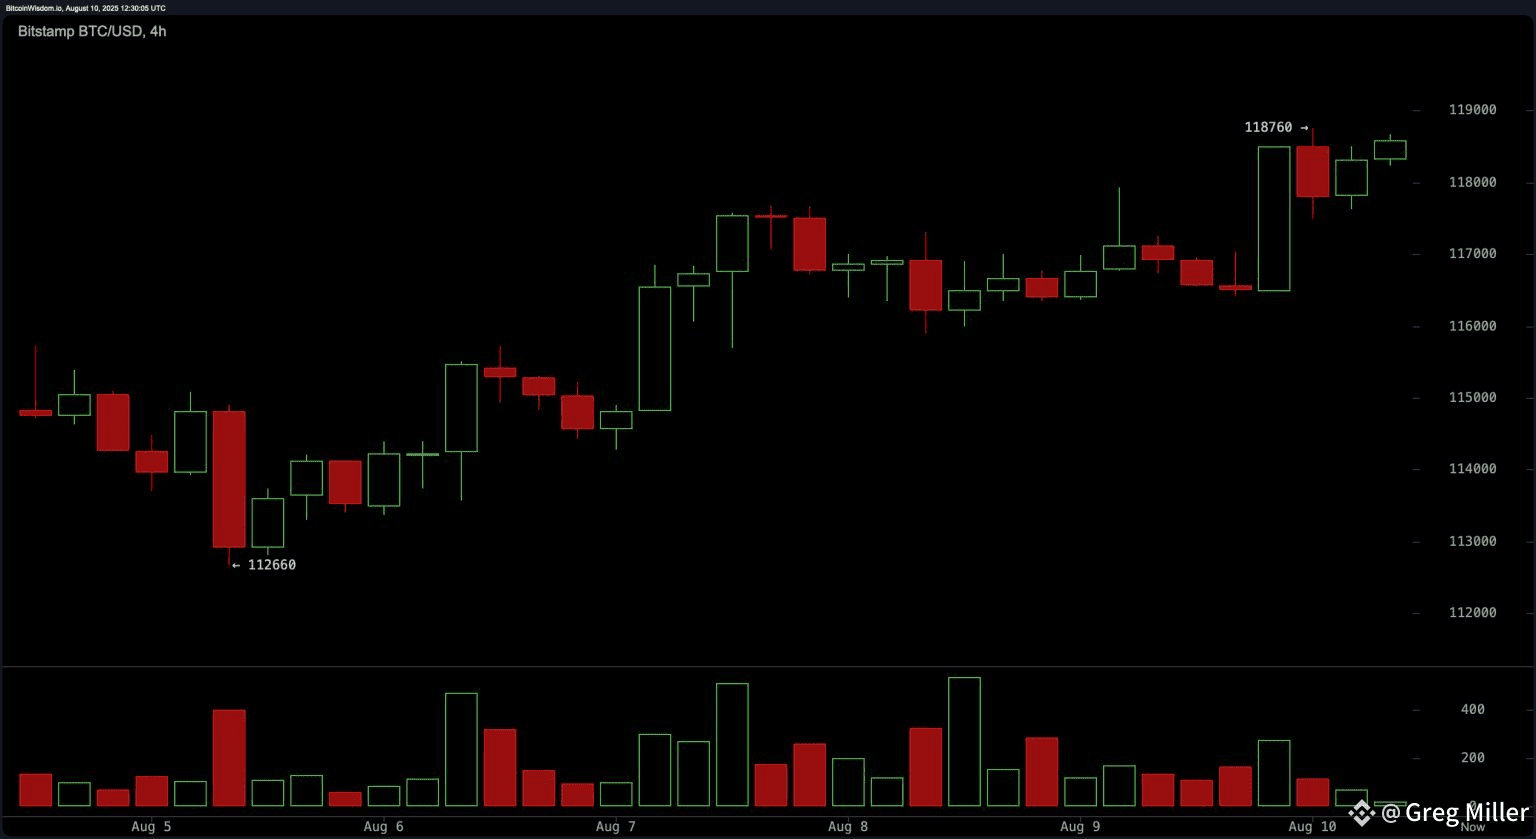
ADX: 16 (weak trend)
This means a breakout or pullback is possible. Traders may look for buys near $117,000 and take profits around $119,000, unless strong volume pushes the price higher.
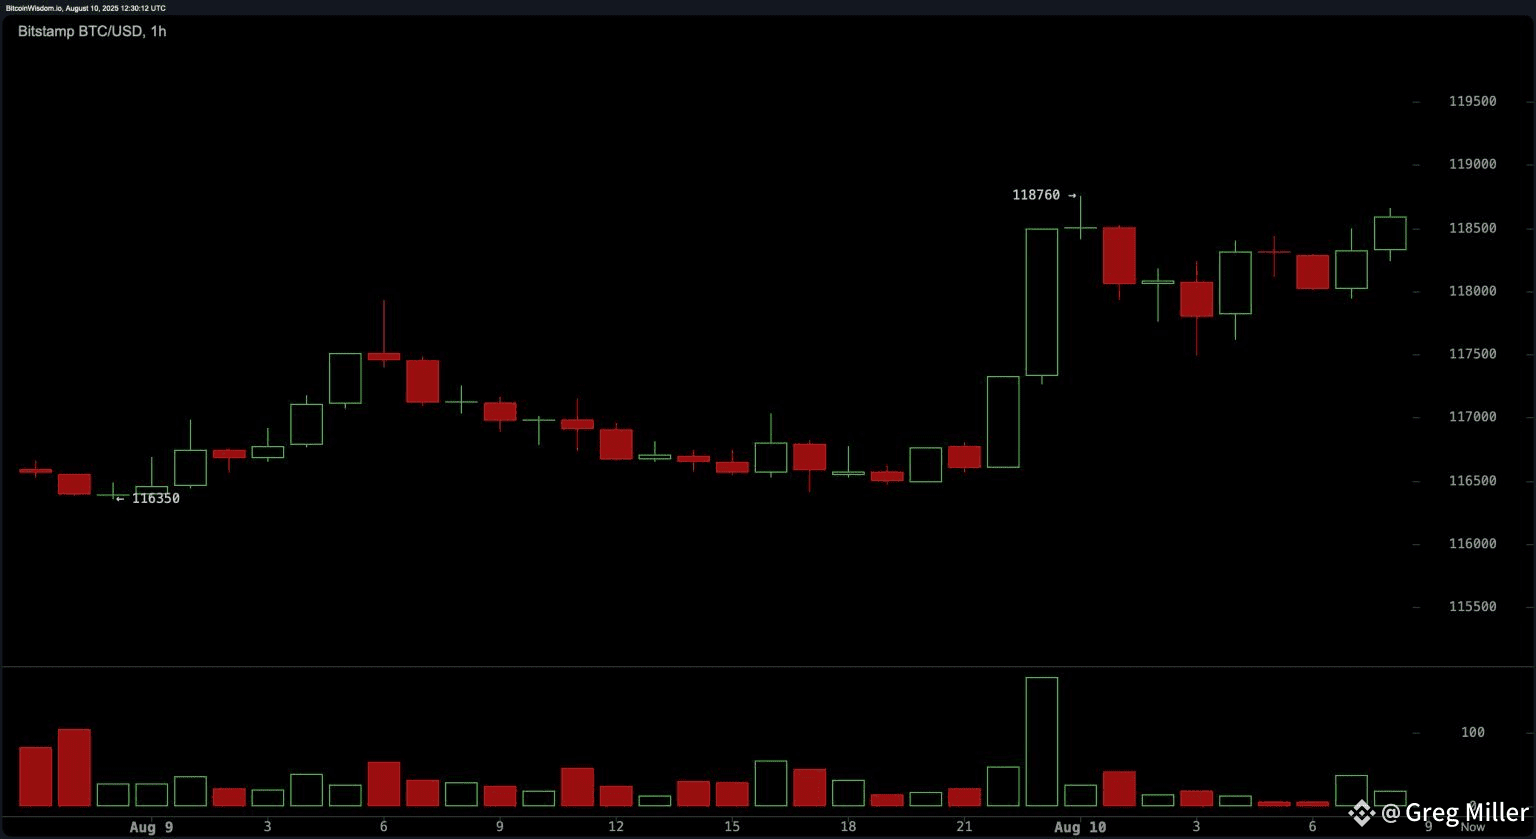
1-Hour Chart: Pennant Pattern After Breakout
On the short-term chart, Bitcoin jumped from $116,350 to $118,760, then moved sideways in a pennant-like shape. This could lead to another upward move if buying returns.
A break above $118,800 with strong volume could trigger quick gains.
A weak breakout may send the price back toward $117,000.
Moving Averages: Long-Term Trend Still Bullish
All major EMAs and SMAs, from the 10-period to the 200-period, are signaling buy. This shows the long-term uptrend is intact, even though short-term momentum is mixed.
Key Takeaways
Range: $112,000–$123,000
Bullish Case: Clearing $119,000 with strong volume could open the way to $123,000.
Bearish Case: Failing to hold above $117,000 could lead to a drop toward $116,000.
