---
📌 1. Detailed Technical Analysis
A. 🔎 Trend Analysis — Macro Picture
ETH remains in a macro bearish structure, but the short-term momentum is turning strongly bullish.
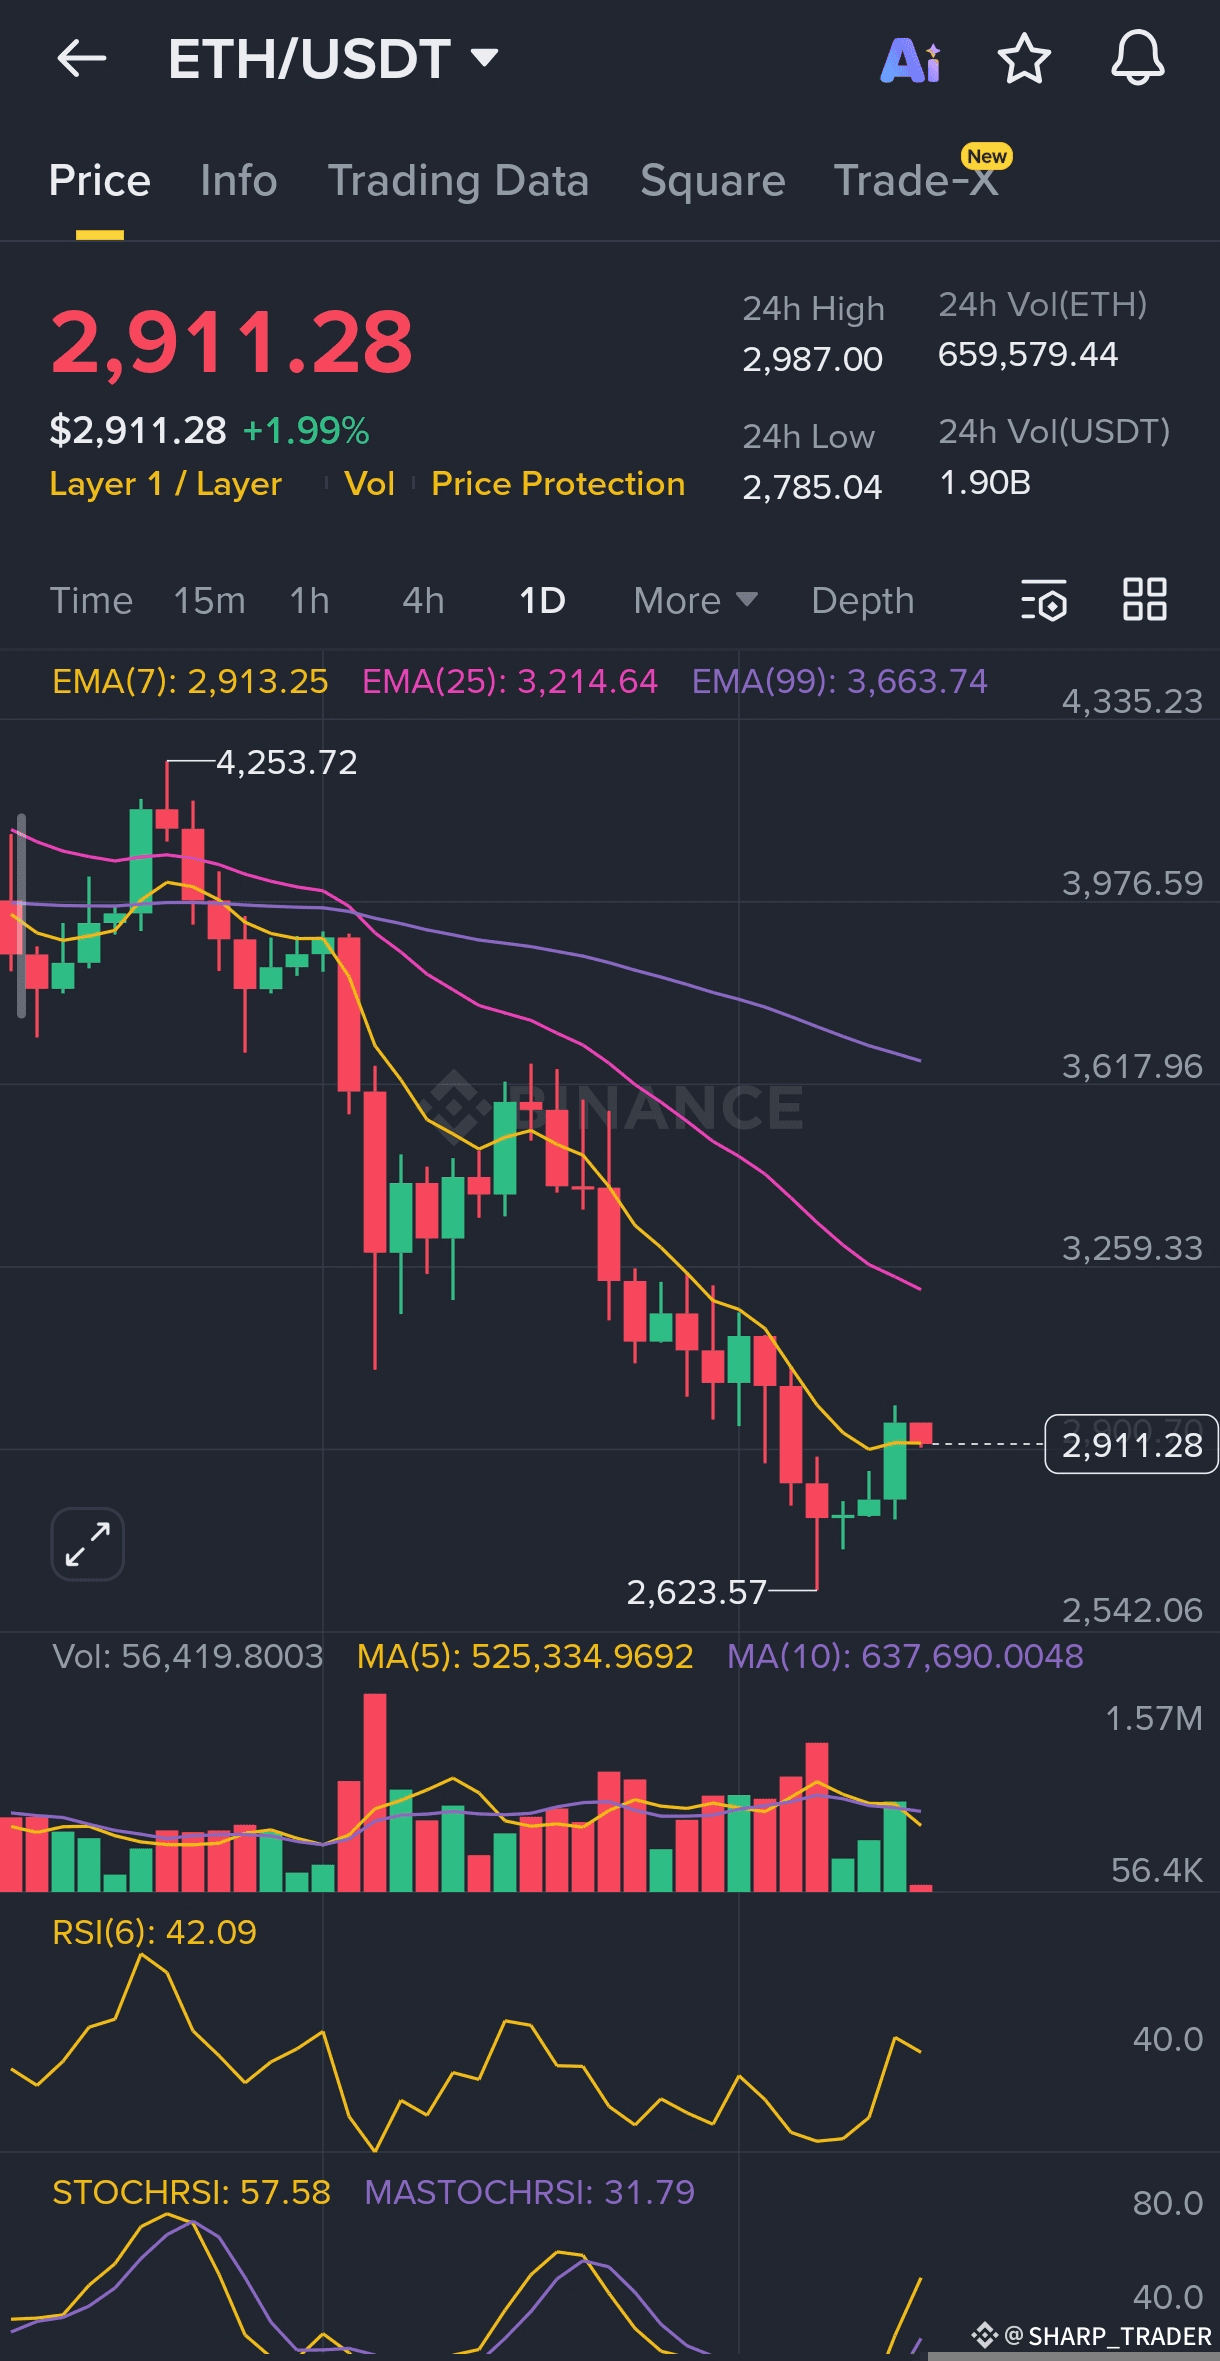
Current Price: $2,911.28
EMA Alignment (Bearish):
Price < EMA 7 ($2,913)
EMA 7 < EMA 25 ($3,214)
EMA 25 < EMA 99 ($3,663)
📉 Interpretation:
ETH is still locked in a downtrend, but…
👉 Price is ONLY $2 below EMA 7, meaning a breakout attempt is literally at the doorstep.
This is far tighter than previous ETH readings and signals a direct bull–bear battle.
---
B. ⚡ Momentum & Oscillator Analysis
RSI (6): 42.09 — Neutral with Bullish Bias
No longer oversold
Still not overbought
Plenty of room for upside expansion 🚀
🔥 Stochastic RSI: Very Strong Bullish Crossover
StochRSI: 57.58
MA StochRSI: 31.79
➡️ Major bullish signal
➡️ Stronger than BTC’s momentum
➡️ Already above 50 midline → trending bull momentum activation
This is one of the strongest short-term bullish signals ETH has printed recently.
📉 Volume: Extremely Low
Current: 56,419
MA 5 Volume: 525,334
MA 10 Volume: 637,690
➡️ Ultra-low volume =
Sellers are exhausted 😴
Buyers waiting for breakout trigger
Often appears before sharp upside moves
Supports the bullish scenario.
---
C. 📊 Support & Resistance Levels
🚧 Immediate Resistance
1. R1: $2,913 (EMA 7) – breakout trigger
2. R2: $2,987 (24h High) – confirmation level
3. R3: $3,214 (EMA 25) – medium-term trend shift zone
🛡 Immediate Support
1. S1: $2,785.04 (24h Low) – critical invalidation
2. S2: $2,623.57 – major chart support
---
📌 2. Detailed Price Prediction
A. 🟦 Short-Term (24–48H): Bullish Breakout Is Imminent
Why?
Very strong StochRSI crossover ☑️
Price pressing against EMA 7 ☑️
Volume collapse = sell exhaustion ☑️
🎯 Primary Target: Break & hold above $2,913 (EMA 7)
🎯 Next Target: Test $2,987 (24h High)
🔔 If ETH breaks $2,987 with rising volume:
It may quickly run to:
➡️ $3,100 (psychological + former support)
---
B. 🟨 Medium-Term (1–2 Weeks): Relief Rally Inside a Downtrend
ETH is still bearish below EMA 25 → $3,214.
This bounce = relief rally, NOT reversal (yet).
Bullish Scenario
Break + retest of EMA 7
Rally toward $3,100 → $3,214 (EMA 25)
Bearish Scenario
Rejection at EMA 7
Break below $2,785 → rapid drop to $2,623
---
📌 3. Comprehensive Trade Plan
ETH is giving a strong tactical long setup due to momentum + EMA squeeze.
---
Trade Idea 1 — 🟢 Buying the Breakout (Primary Plan)
Entry
4H candle close above $2,913 (EMA 7)
Enter on small dip after breakout
Stop-Loss
Below $2,785
Best SL: $2,775
Take-Profit
TP1: $2,987 (24h High)
TP2: $3,100
TP3: $3,200 (just below EMA 25)
---
Trade Idea 2 — 🟡 Aggressive Long on Dip Before Breakout
Entry Zone
$2,860 – $2,880
Stop-Loss
Below $2,775
Take-Profit
Same as Trade Idea 1 (2,987 → 3,100 → 3,200)
---
Trade Idea 3 — 🔴 Trend-Following Short (If Breakout Fails)
Only if rejection occurs.
Entry Trigger
4H candle close below $2,785
Entry
Retest of $2,790 as resistance
Stop-Loss
Above $2,920 (above EMA 7)
Take-Profit
TP1: $2,623
TP2: $2,540
---
📌 Summary & Action Points
🎯 Dominant Trend:
Macro bearish
Short-term strong bullish momentum
🔥 Most Important Signal:
StochRSI crossover (57.58 > 31.79) = powerful upside momentum
Stronger than BTC’s signal
📈 Bullish Trigger:
$2,913 (EMA 7) → must break & hold
📉 Bearish Trigger:
$2,785 (24h Low) → break = bearish continuation
💡 Optimal Strategy (High R/R):
➡️ Wait for 4H close above $2,913
➡️ Enter long
➡️ SL below $2,785
➡️ Targets: $2,987 → $3,100 → $3,200
---

