

ETH forms a 6 year ascending triangle, nearing breakout with July's 50% surge closing at $3,746.90.
$4K resistance aligns with long term channel support and ascending patterns, supporting bullish momentum.
On-chain data shows institutional interest rising despite low retail sentiment, supporting a $6K–$8K target.
Ethereum is edging closer to a major technical breakout, with analyst pointing to a long forming bullish pattern that is now nearing maturity. A key monthly setup has developed since late 2018, an ascending triangle bounded by rising support and a flat $4,000 resistance line.
Price rejections near this level occurred in 2021, 2022, and 2024. However, the recent July 2025 candle posted a 50.51% gain, closing near $3,746.90 and pushing ETH closer to the triangle apex.
Long Term Triangle Breakout Nears
The ascending triangle pattern is defined by two major technical features. The horizontal resistance at around $4,000 shows repeated seller pressure, while the diagonal support traces higher lows from approximately $90 in 2018 to $2,800 in mid 2025.
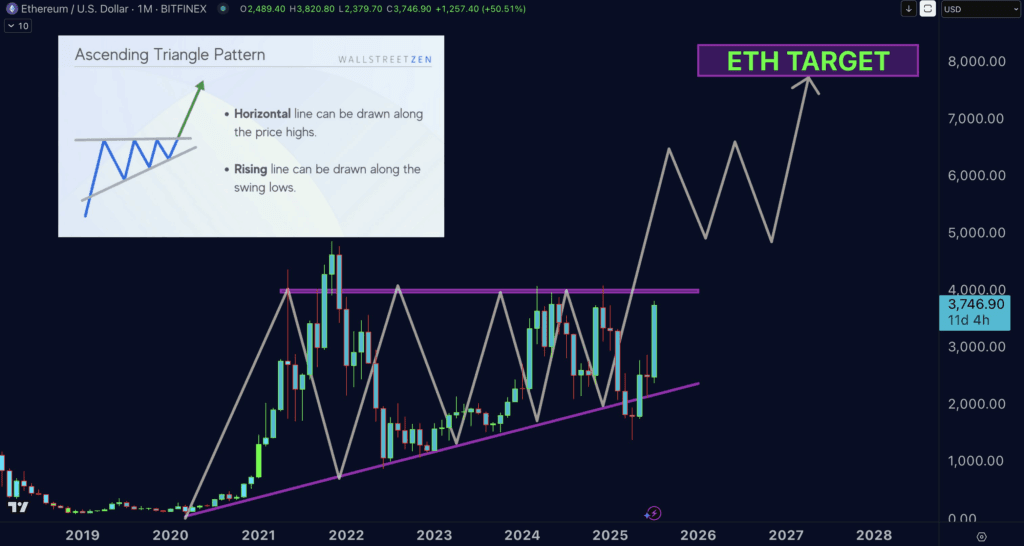 ETH/USDT 1-month price chart, Source: Dr Profit on X
This tightening range suggests mounting bullish pressure. ETH has consolidated in this zone for over four years. In July 2025, a sharp monthly surge brought it closer to the breakout point, forming a possible launch zone for a larger move.
If ETH breaks and closes above the $4,000 resistance line, the projected upside based on the triangle height is roughly $8,000. This aligns with standard technical measurements for ascending triangle patterns.
Technical Alignments Support the Outlook
The $4,000 resistance zone overlaps with two other bullish indicators from high timeframes. Ethereum continues to respect a long term ascending channel that began forming in 2020. ETH now trades near the channel’s lower support, a level where strong rebounds have previously occurred.
In addition, the weekly chart shows another ascending triangle that has developed since 2020. This secondary pattern supports the bullish continuation thesis, adding similar outlook to the existing breakout expectation above $4,000.
Also important is Ethereum’s proximity to its 200 week EMA, a historically strong support level. The last two times ETH dropped below it were during the 2020 crash and the 2022 bear phase. It rebounded strongly after both instances. As of February 2025, ETH was only 18% above this moving average.
Market Liquidity and Sentiment Align with Price Setup
The $4,000 region holds substantial market liquidity. This liquidity cluster, together with the long term triangle and channel structures, suggests a strong technical alignment zone.
ETF inflows and on-chain withdrawals indicate institutional interest has been building, despite retail disinterest and widespread negative sentiment. Historical patterns show ETH typically reverses near major support zones, especially when retail attention is low.
Ethereum’s present price structure is at a decisive zone. If key levels hold and momentum sustains, technical projections suggest an extended upside phase toward $6,000 to $8,000.
The post “Ethereum’s Pump Hasn’t Even Started Yet, Price is Approaching a Critical Breakout Point” Says Analyst appears on Crypto Front News. Visit our website to read more interesting articles about cryptocurrency, blockchain technology, and digital assets.
