Every Bitcoin cycle creates a new story.
New narratives. New hype. New reasons why “this time is different.”
But eventually, the market strips away emotion and forces traders back to reality.
Right now, crypto Twitter is flooded with endless bottom predictions. Some are calling for massive crashes. Others believe Bitcoin will never revisit deep bear market territory again because institutions, ETFs, and sovereign adoption have changed the game.
Maybe they have.
But when you zoom out far enough, one thing continues to stand out across every major cycle in Bitcoin history:
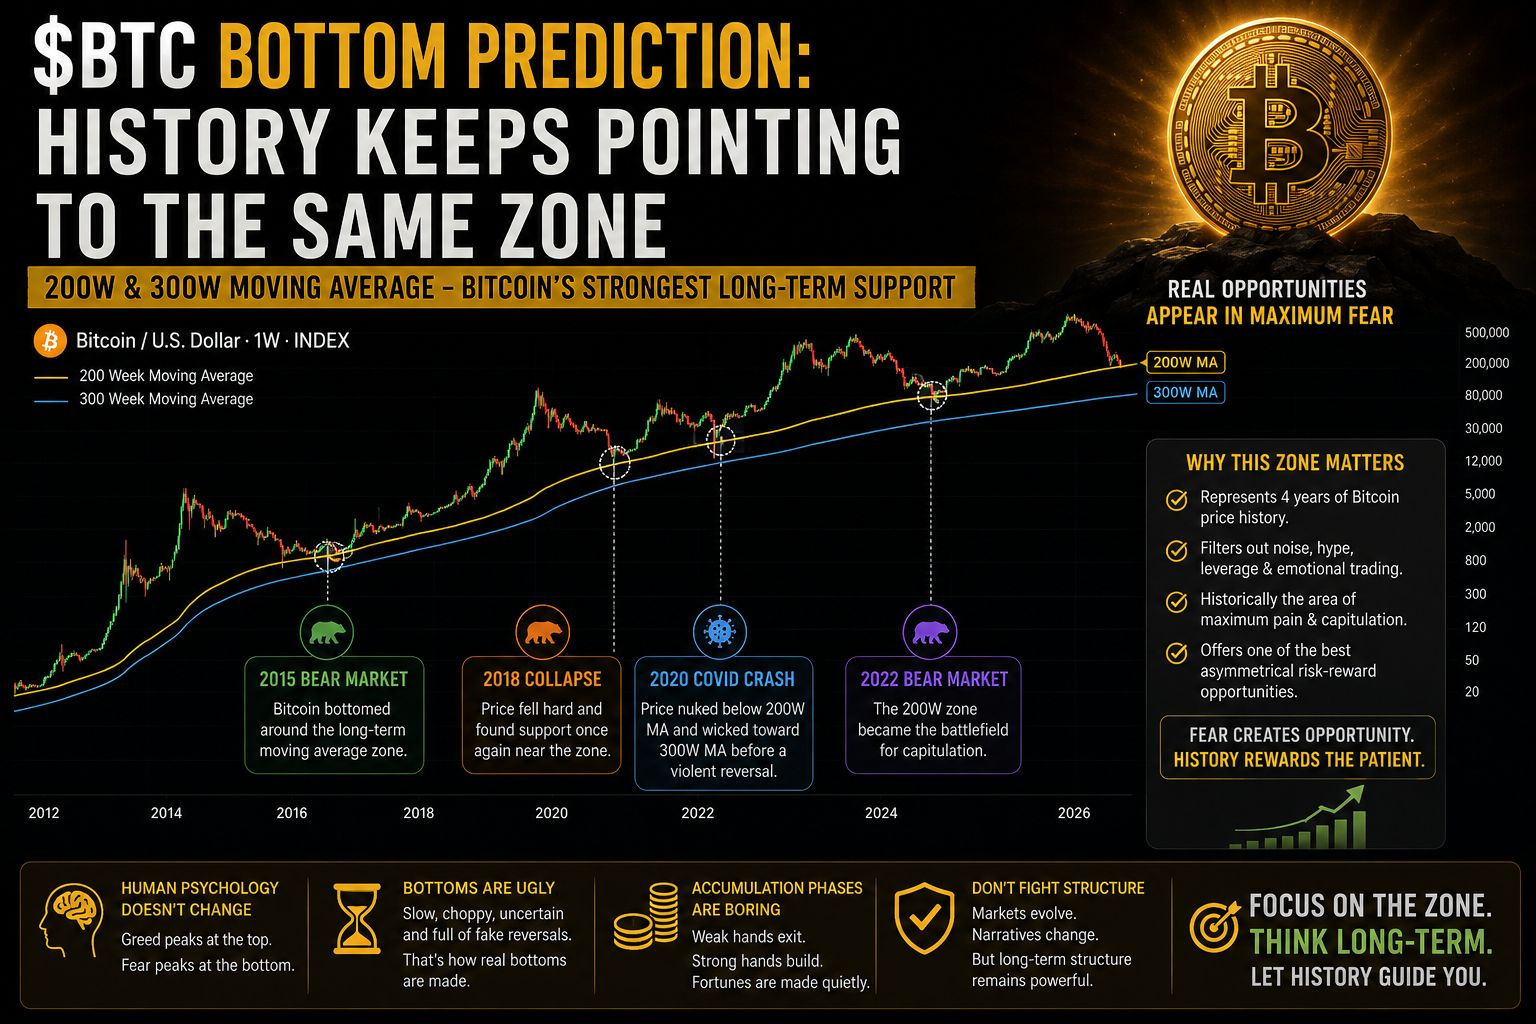
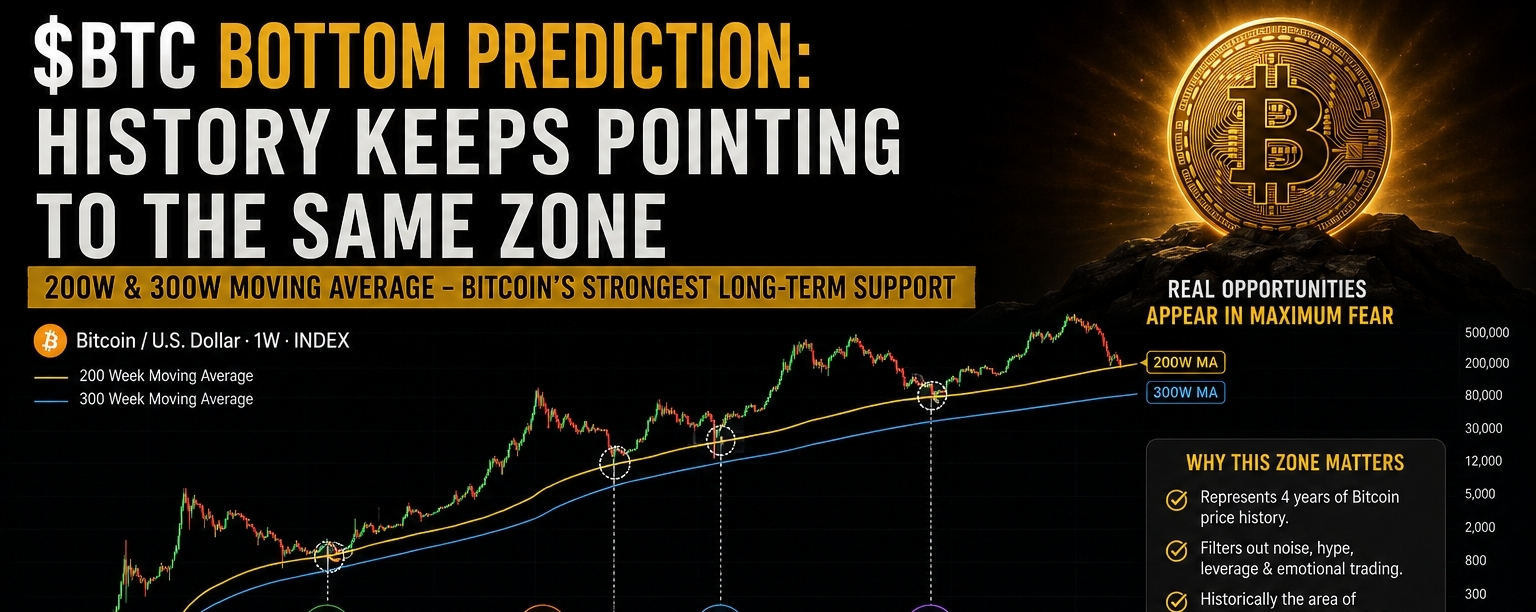
Bitcoin repeatedly finds its strongest long-term support around the 200-week moving average, and during extreme panic events, near the 300-week moving average.
That zone has become one of the most respected structural areas in Bitcoin’s entire history.
And honestly, ignoring that history has destroyed more traders than most people realize.
Why the 200-Week Moving Average Matters So Much
The 200-week moving average is not just another random indicator traders throw on charts.
It represents nearly four years of Bitcoin price history compressed into one long-term trendline.
Four full years.
An entire market cycle.
That’s important because it removes almost all short-term noise from the market:
leverage-driven volatility
influencer hype
panic headlines
ETF excitement
emotional retail trading
liquidation cascades
What remains is Bitcoin’s deeper long-term structural trend.
Historically, when $BTC approaches that zone, it usually means the market has already experienced severe pain and widespread capitulation.
And that’s exactly why experienced investors monitor it so closely.
Bitcoin’s Historical Bottom Pattern
Bitcoin has repeatedly respected this area during the most brutal phases of previous bear markets.
🔹 2015 Bear Market
After the massive post-2013 collapse, Bitcoin eventually found stability near the long-term moving average region before beginning a slow recovery phase.
🔹 2018 Capitulation
During the brutal breakdown from the $20K euphoric top, Bitcoin again gravitated toward the same structural support area before forming a macro bottom.
🔹 2020 COVID Crash
This was one of the most violent panic events in global market history.
BTC temporarily nuked below the 200W moving average and wicked toward the 300W MA before reversing aggressively.
That moment proved something critical: Even during extreme fear, Bitcoin still respected the same historical compression zone.
🔹 2022 Bear Market
As leverage collapsed across the crypto ecosystem, the 200-week moving average once again became the key battlefield for capitulation and long-term accumulation.
Different cycles. Different headlines. Different macro conditions.
Yet Bitcoin kept returning to the same structural region.
That consistency is difficult to ignore.
The Market Changes — Human Psychology Doesn’t
A lot of traders believe institutional adoption changes everything.
Maybe partially.
Today we have:
Spot Bitcoin ETFs
institutional custody
sovereign interest
public company treasury accumulation
deeper derivatives markets
Wall Street exposure
Structurally, the market is evolving.
But human psychology has not changed at all.
Greed still dominates near tops.
Fear still dominates near bottoms.
And capitulation still happens when the majority becomes convinced Bitcoin is finished forever.
That emotional cycle keeps repeating because markets are ultimately driven by human behavior.
And human behavior remains cyclical.
Why Most Traders Misunderstand Bottoms
One of the biggest mistakes newer traders make is expecting bottoms to look bullish.
Historically, Bitcoin bottoms are ugly.
They are:
slow
exhausting
choppy
emotionally draining
filled with fake reversals
loaded with uncertainty
The market never rings a bell saying:
“Congratulations. The bottom is officially in.”
Instead, true bottoms usually create maximum confusion.
At cycle tops, everyone talks about financial freedom and generational wealth.
Near real bottoms, people talk about leaving crypto forever.
That emotional transition is usually what creates long-term opportunity.
The 300W Moving Average: The Extreme Fear Zone
The 300-week moving average has historically acted as Bitcoin’s deepest panic support region.
Bitcoin $BTC rarely reaches it.
But when it does, it usually happens during extreme liquidity crises or black swan events.
That’s why many long-term investors consider the area between the 200W and 300W moving averages one of the most important asymmetrical risk-reward zones in crypto.
Could Bitcoin briefly overshoot below the 200W MA again in a future liquidity panic?
Absolutely.
History already showed that possibility during the COVID crash.
But historically, that entire region has represented:
maximum fear
forced liquidations
weak-hand capitulation
long-term accumulation opportunity
And that distinction matters.
Accumulation Phases Are Designed to Feel Boring
This is another part most traders fail to understand.
Even if Bitcoin forms a macro bottom near these levels, it does not mean price instantly enters a massive bull run.
Historically, accumulation phases can last for months.
Sometimes longer.
That period is intentionally frustrating because markets need time to:
remove weak hands
reset leverage
rebuild confidence
create new positioning structures
The smartest long-term positions are usually built quietly during periods where nobody cares anymore.
Not during euphoric headlines.
Why Long-Term Structure Still Matters
Personally, one of the biggest mistakes traders make is trying to outsmart long-term historical structure.
Every cycle, people convince themselves that history no longer matters.
Until the cycle humbles them again.
The 200W and 300W moving averages remain relevant because they survived multiple Bitcoin cycles without completely breaking down as structural indicators.
That alone gives them significance.
No indicator is perfect.
No level is guaranteed.
But ignoring one of Bitcoin’s most historically respected support regions simply because the current narrative feels different can become extremely dangerous.
Final Thoughts
Bitcoin may continue evolving.
ETFs may change capital flow dynamics.
Institutions may create stronger long-term demand.
Governments may eventually compete for exposure.
But fear and greed are still driving this market underneath everything else.
And historically, Bitcoin’s deepest opportunities appeared precisely when the majority lost faith.
That’s why the 200W and 300W moving averages continue attracting attention from serious long-term investors.
Not because they are magical.
But because history keeps pulling Bitcoin back toward the same structural zone whenever the market experiences maximum pain.
I’m not interested in fighting history.
#BTC #bitcoin #SECPausesNewETFApplicationReview #trading #Investing