✅ What $101.5 K might indicate
Here are a few observations from recent analyses:
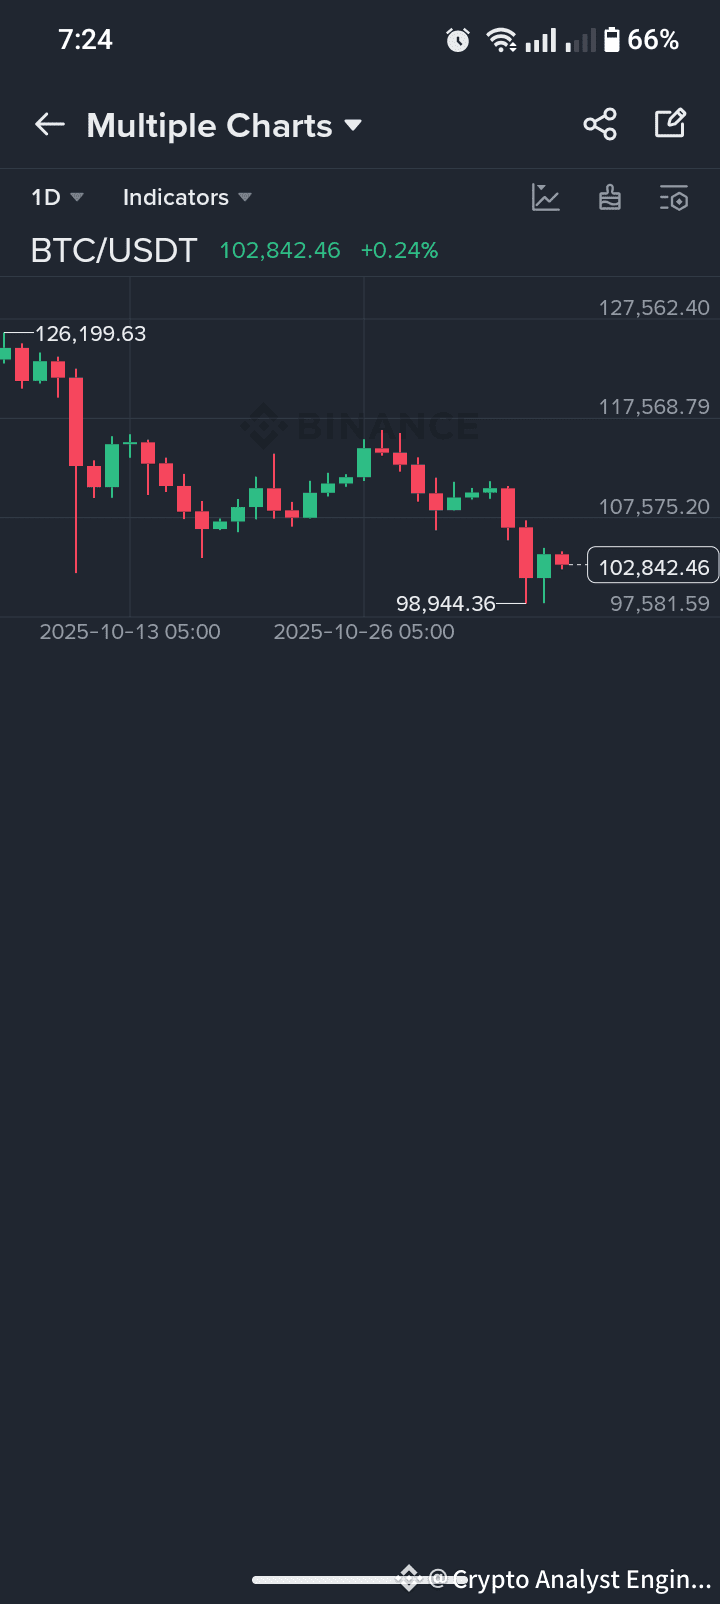
Some analysts consider the $100 K–$101.5 K range as a critical resistance or support zone for Bitcoin. For example, one report says: “If Bitcoin breaks through resistance between $100-101.5 K it is expected to retest the range between $106-108 K. If unable to break new highs then $90 K will become key support.”
this price is psychologically and technically important—it’s not just a number, but one of the “make-or-break” zones in market sentiment.
Recognize that a breakout above ~$101.5 K could lead to bullish momentum (towards ~$106-108K or higher).Recognize that failure to hold above ~$101.5 K could signal a deeper correction or shift.
Therefore, treat this level as a “decision point” in your thinking
“If BTC breaks above 101.5K and holds for X days with volume, I’ll increase learning/depth in bullish case.”
“If BTC fails below 101.5K, shift to defensive or caution mode: focus on loss-prevention, deeper research Balance view between short-term vs long-term
Because $101.5K is an intermediate term point:
For short-term: It might mean immediate trading opportunities or alerts.
For long-term: Understand that even if BTC moves through this zone, the larger cycle (halving, adoption, macro factors) still matter.
⚠️ Things to watch out / risks
Just because BTC hits $101.5K doesn’t guarantee anything; markets can reverse quickly.
#NOTE 👇
Protect this prediction from Donald trump
