
Crypto Journey1
22.2k Beiträge

Crypto Journey1
Melden
Nutzer blockieren
🚀 Passionate Crypto Enthusiast | Blockchain Advocate 🌐
📰 Delivering the Latest Crypto News & Insights 💡
🔍 Exploring the Depths of Decentralized Finance
Trade eröffnen
Regelmäßiger Trader
4.4 Jahre
49 Following
68.3K+ Follower
90.7K+ Like gegeben
Beiträge
Portfolio
Alle
Zitierungen
Videos
Live
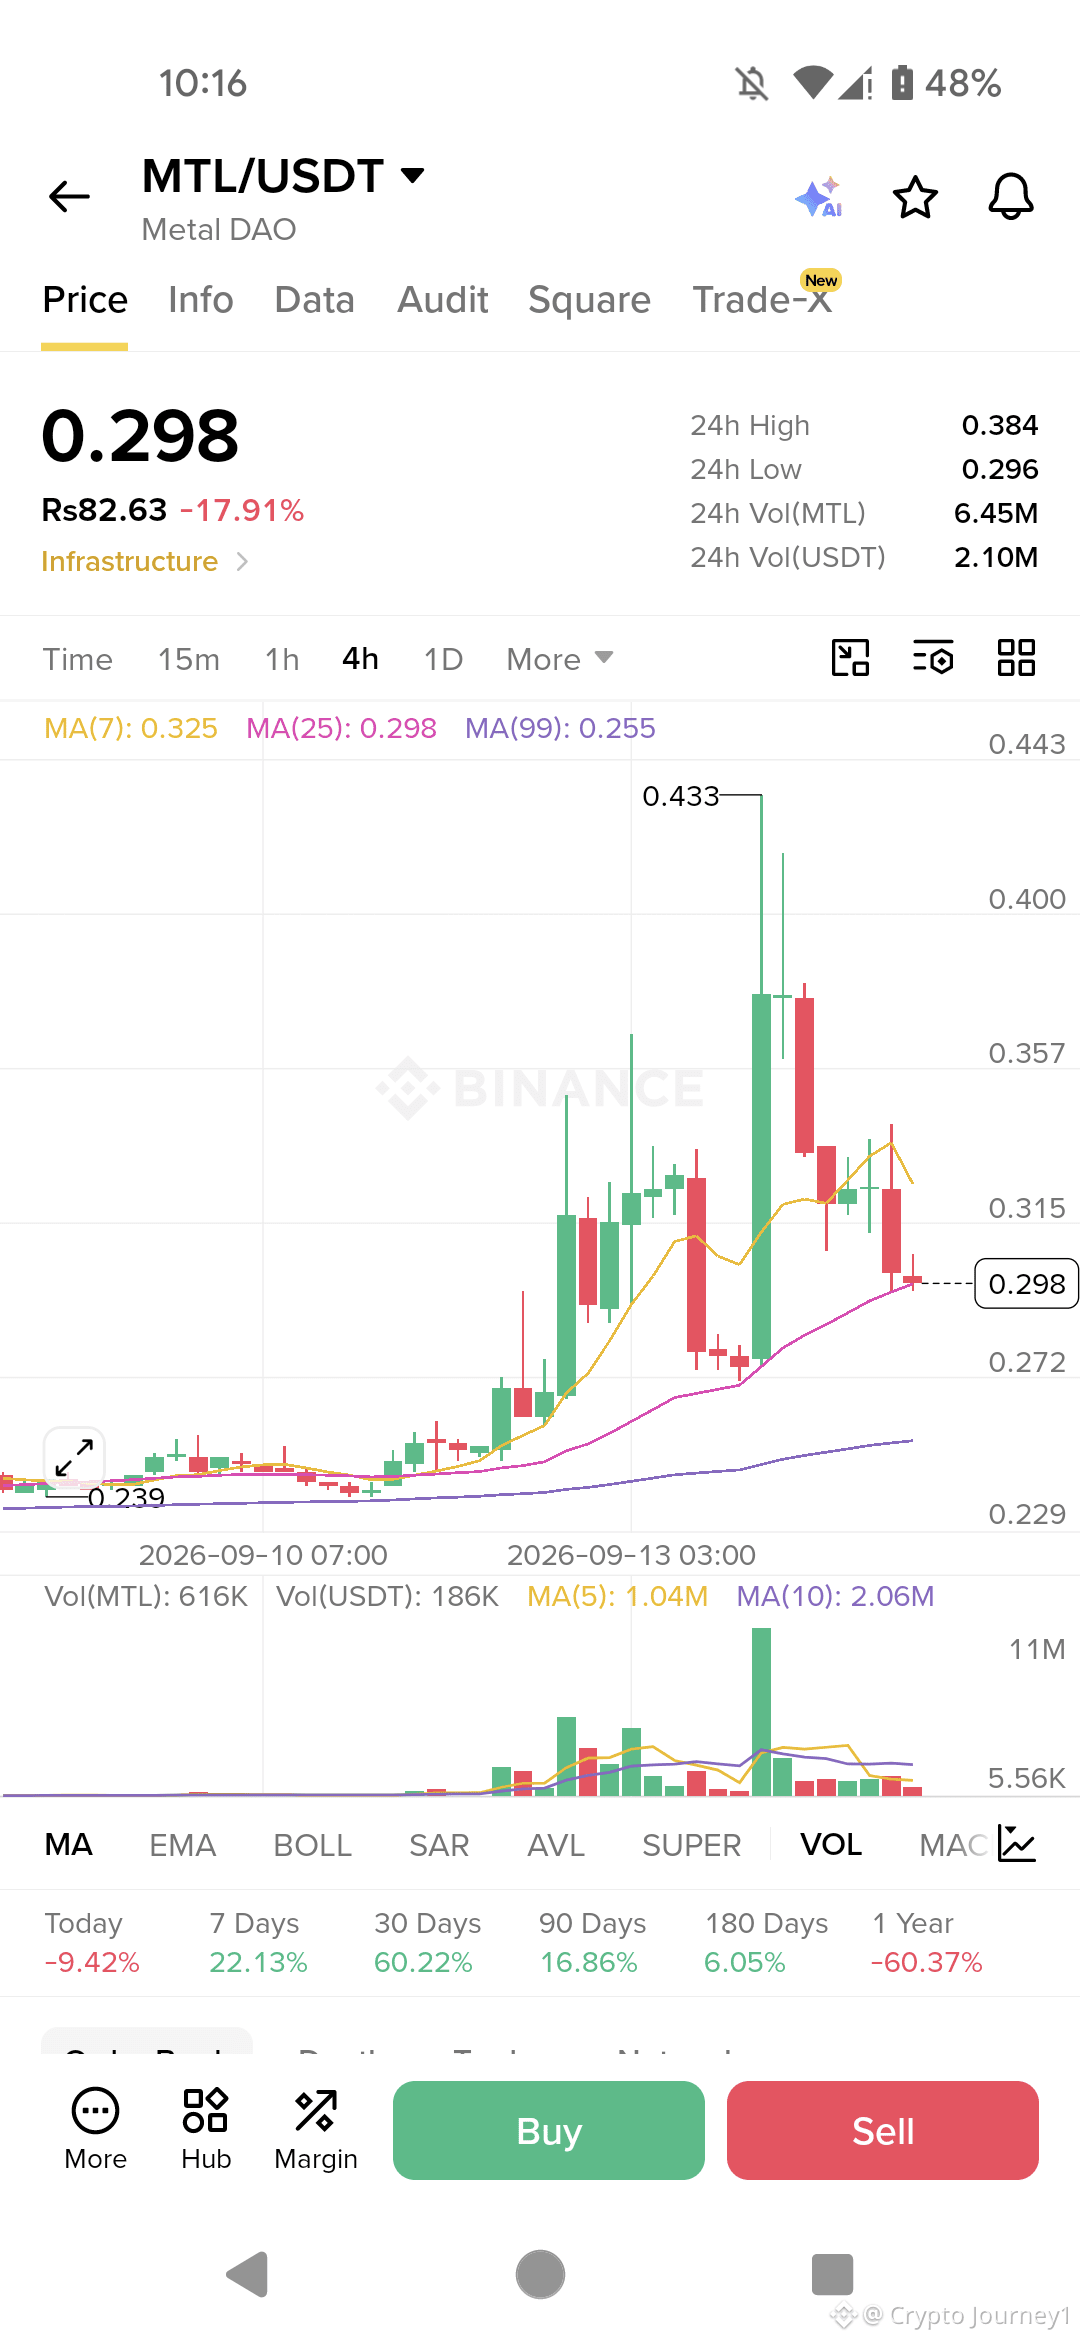
$MTL auf 0.433 gepumpt und dann auf 0.298 abgeladen. Klassisches Pump-and-Dump. Kurzes Setup-Laden.
KURZ:
Entry: 0.298 – 0.305
SL: 0.330
TP1: 0.270
TP2: 0.240
TP3: 0.210
TP4: 0.180
Wenn es 0.330 mit Volumen zurückerobert, gehe long.
LONG-Ziele: 0.380 – 0.430 – 0.500
Nicht hinterherjagen. Auf Bestätigung warten. Risiko managen.
$MTL auf 0.433 gepumpt und dann auf 0.298 abgeladen. Klassisches Pump-and-Dump. Kurzes Setup-Laden.
KURZ:
Entry: 0.298 – 0.305
SL: 0.330
TP1: 0.270
TP2: 0.240
TP3: 0.210
TP4: 0.180
Wenn es 0.330 mit Volumen zurückerobert, gehe long.
LONG-Ziele: 0.380 – 0.430 – 0.500
Nicht hinterherjagen. Auf Bestätigung warten. Risiko managen.
KURZ:
Entry: 0.298 – 0.305
SL: 0.330
TP1: 0.270
TP2: 0.240
TP3: 0.210
TP4: 0.180
Wenn es 0.330 mit Volumen zurückerobert, gehe long.
LONG-Ziele: 0.380 – 0.430 – 0.500
Nicht hinterherjagen. Auf Bestätigung warten. Risiko managen.
249
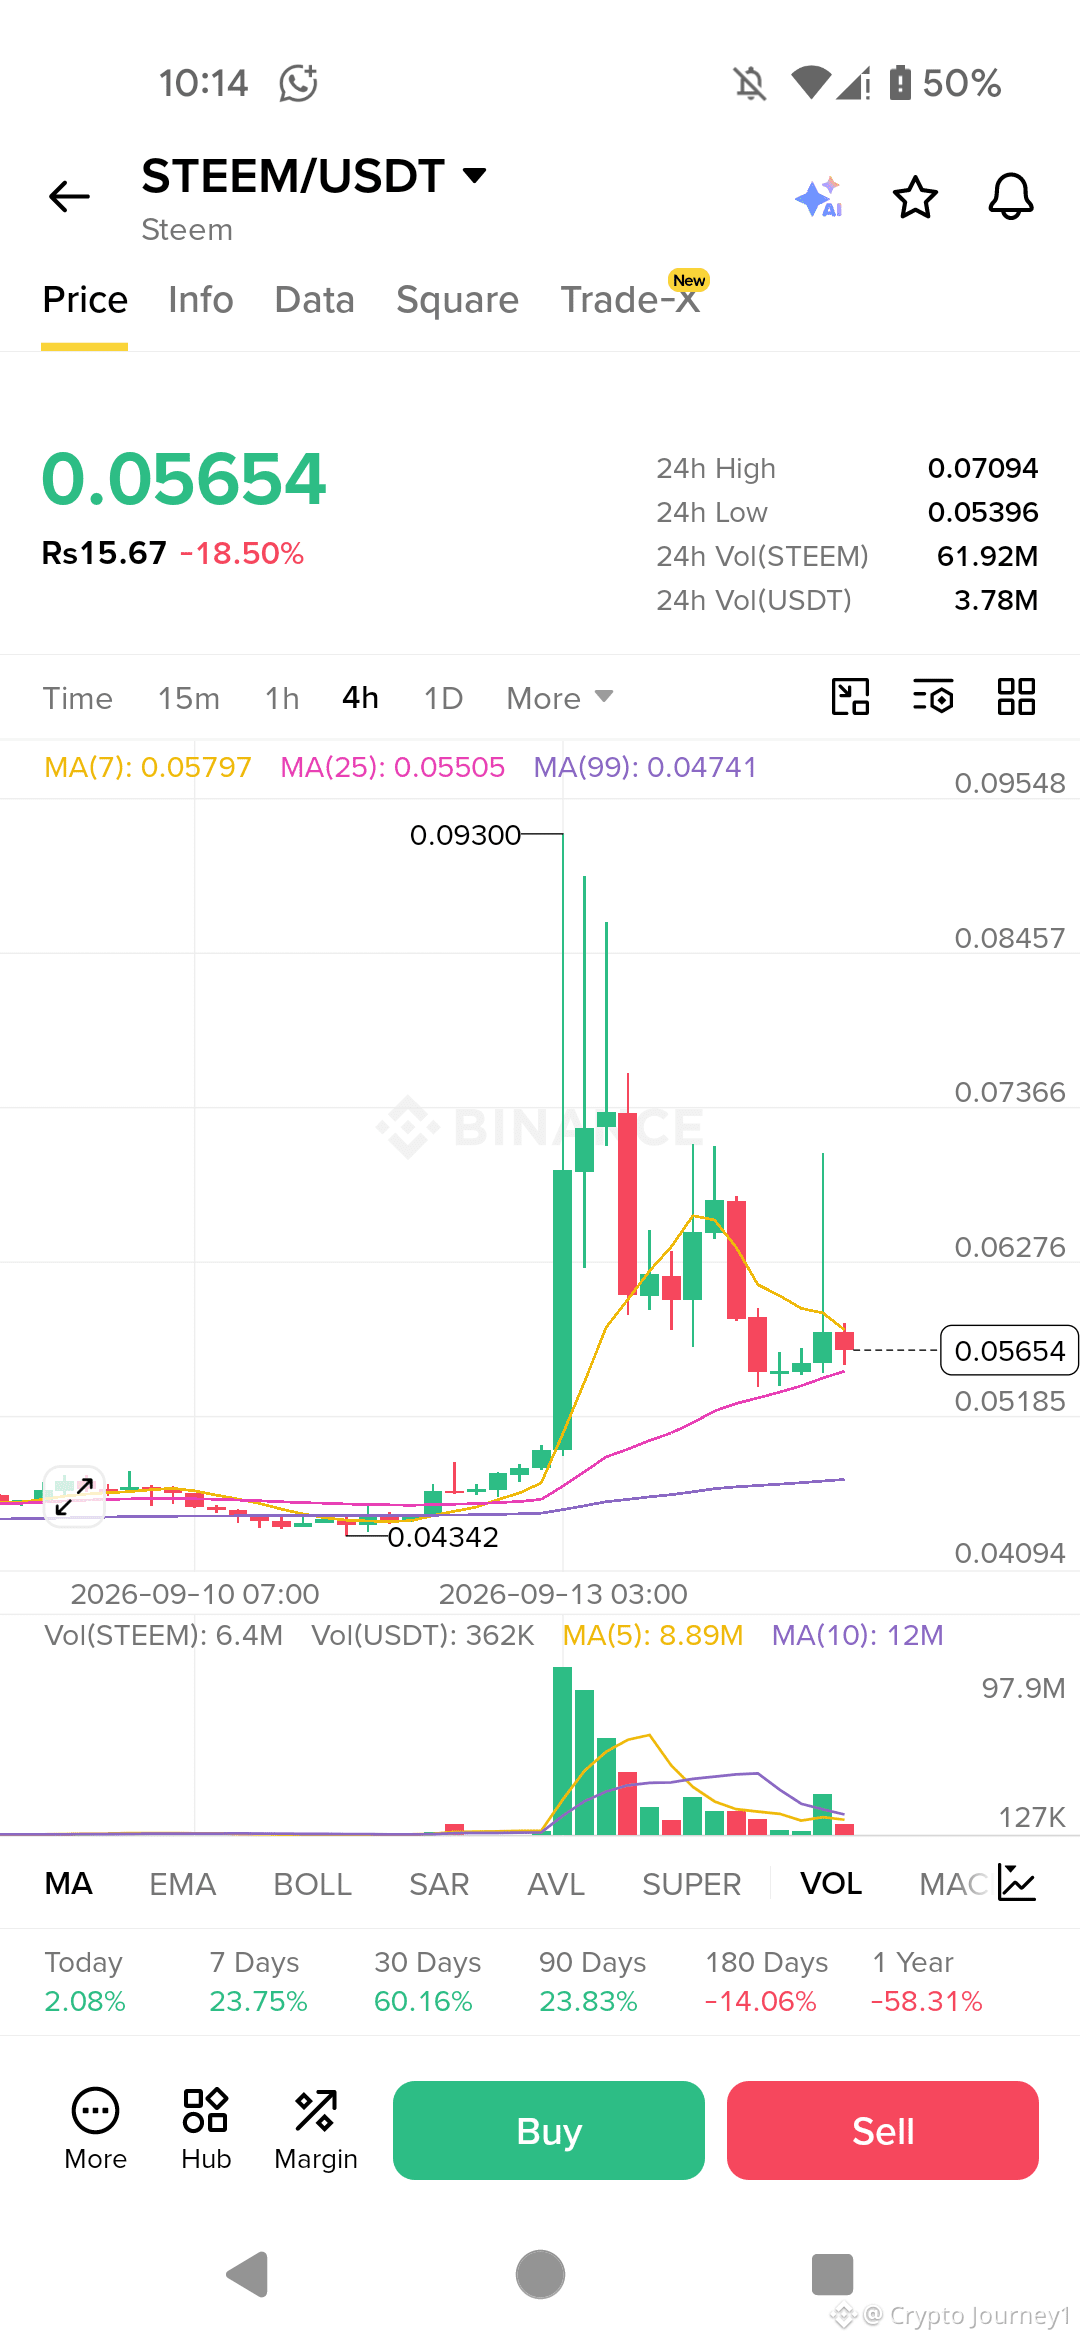
$STEEM — BIS ZU 0.093 HOCHGEPUFFT, BIS ZU 0.0565 ABGELASSEN! KURZE EINSTELLUNG!
Preis hart abgelehnt von 0.093, jetzt bei 0.0565 (-18.5%). Volumen nimmt ab. Unter MA7. Bärisch.
SHORT:
Entry: 0.0565 – 0.058
SL: 0.062
TP1: 0.052
TP2: 0.048
TP3: 0.044
TP4: 0.040
Wenn es 0.060 mit Volumen zurückerobert, wechsel auf LONG.
LONG-Ziele: 0.070 – 0.080 – 0.093
Nicht hinterherjagen. Auf Bestätigung warten. Risiko managen.
$STEEM — BIS ZU 0.093 HOCHGEPUFFT, BIS ZU 0.0565 ABGELASSEN! KURZE EINSTELLUNG!
Preis hart abgelehnt von 0.093, jetzt bei 0.0565 (-18.5%). Volumen nimmt ab. Unter MA7. Bärisch.
SHORT:
Entry: 0.0565 – 0.058
SL: 0.062
TP1: 0.052
TP2: 0.048
TP3: 0.044
TP4: 0.040
Wenn es 0.060 mit Volumen zurückerobert, wechsel auf LONG.
LONG-Ziele: 0.070 – 0.080 – 0.093
Nicht hinterherjagen. Auf Bestätigung warten. Risiko managen.
Preis hart abgelehnt von 0.093, jetzt bei 0.0565 (-18.5%). Volumen nimmt ab. Unter MA7. Bärisch.
SHORT:
Entry: 0.0565 – 0.058
SL: 0.062
TP1: 0.052
TP2: 0.048
TP3: 0.044
TP4: 0.040
Wenn es 0.060 mit Volumen zurückerobert, wechsel auf LONG.
LONG-Ziele: 0.070 – 0.080 – 0.093
Nicht hinterherjagen. Auf Bestätigung warten. Risiko managen.
327
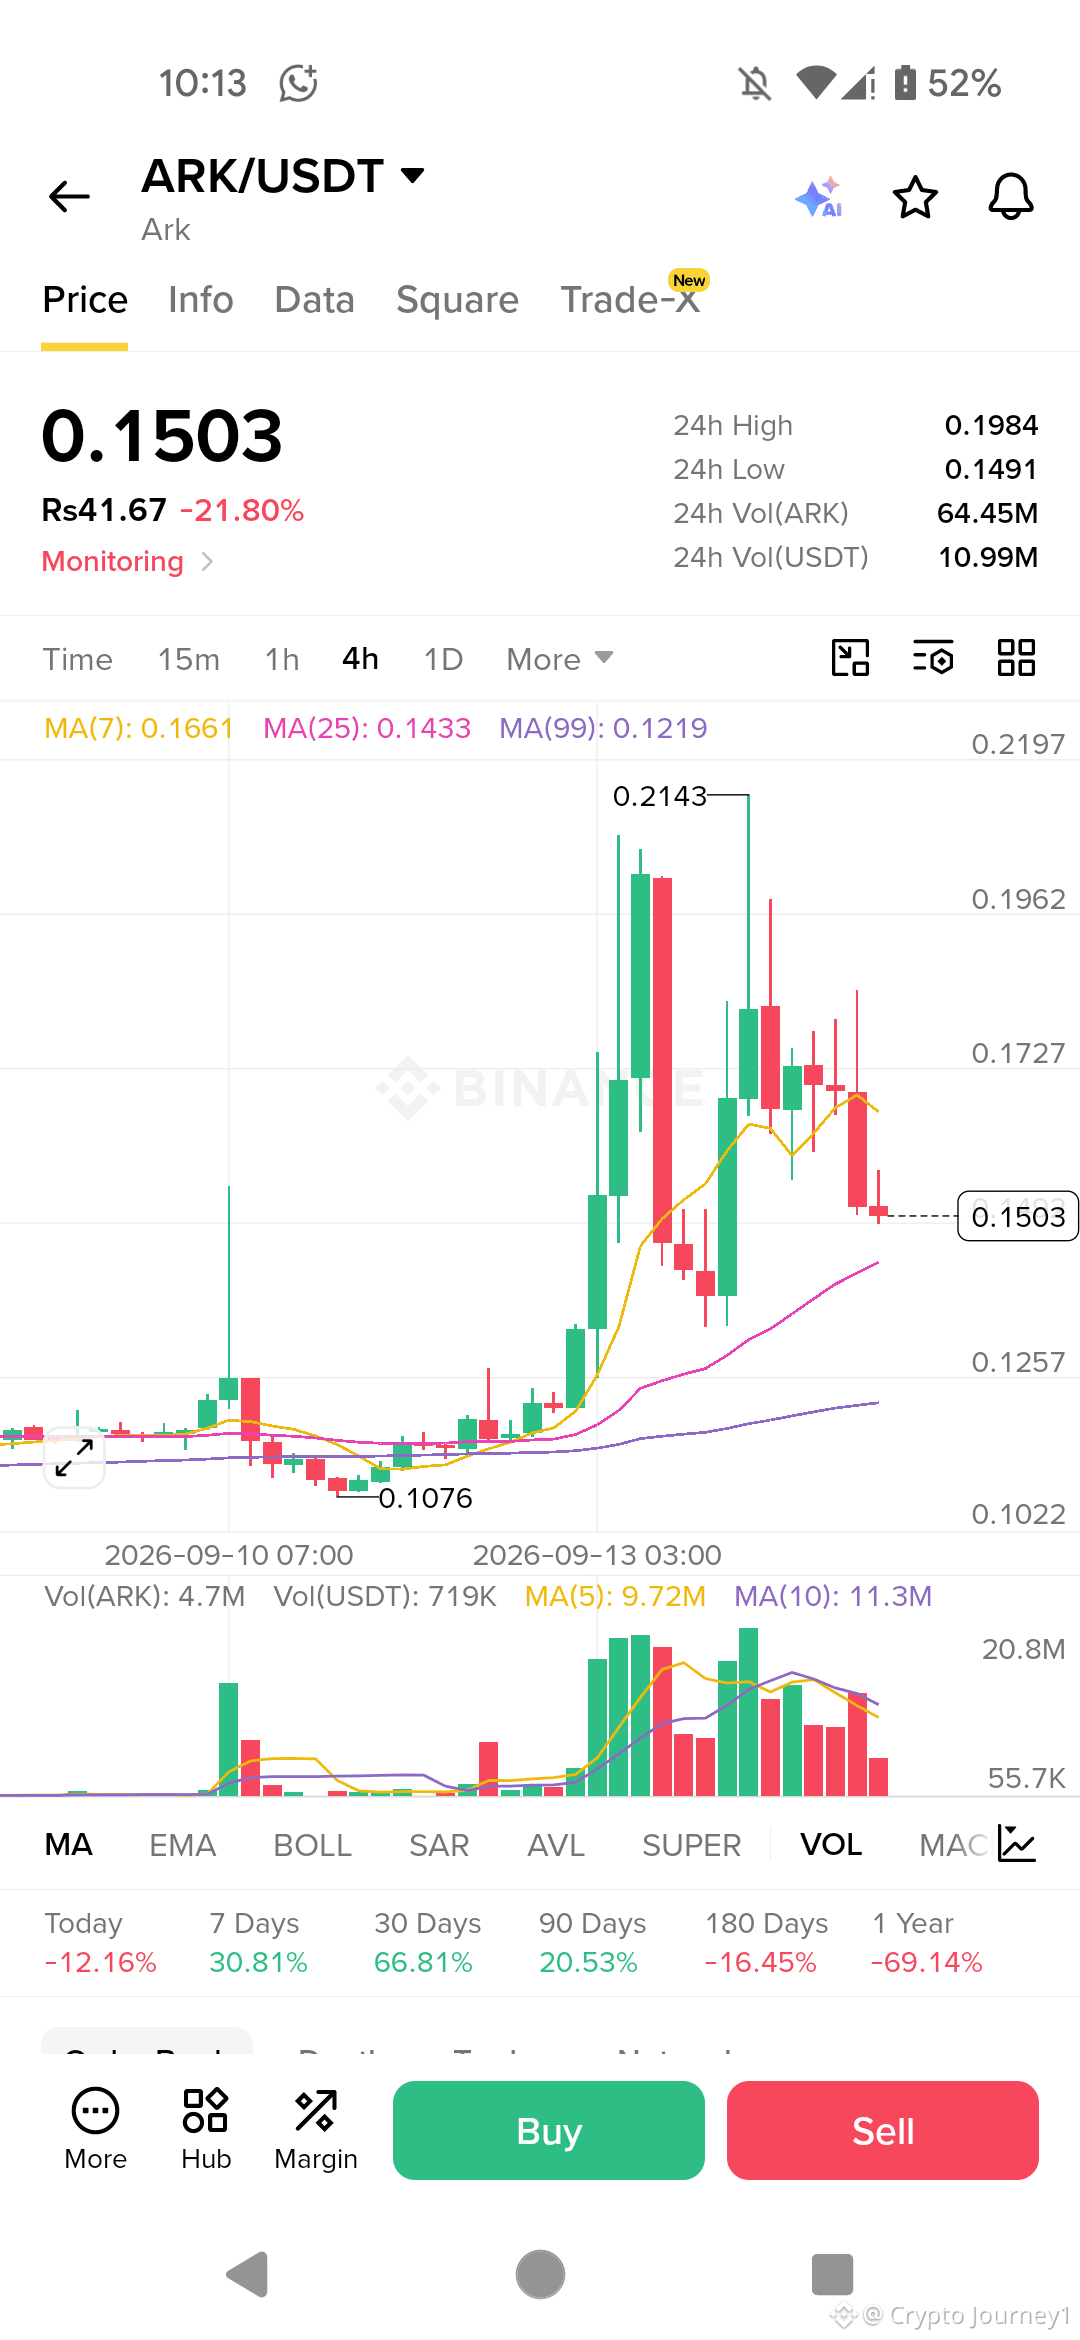
$ARK von 0,214 gepumpt und dann hart abverkauft. Jetzt bei 0,1503, minus 21,8%. Der Kurs liegt unter dem MA7, was Schwäche zeigt. Das Volumen nimmt ab. Sieht nach mehr Abwärtsdruck aus.
SHORT: Einstieg 0,150 – 0,155. SL 0,170. TP1 0,143, TP2 0,130, TP3 0,122, TP4 0,110.
Wenn es 0,170 mit Volumen zurückerobert, auf Long wechseln. Long-Ziele: 0,200, 0,214, 0,250.
Nicht hinterherjagen. Auf Bestätigung warten. Risiko steuern.
$ARK von 0,214 gepumpt und dann hart abverkauft. Jetzt bei 0,1503, minus 21,8%. Der Kurs liegt unter dem MA7, was Schwäche zeigt. Das Volumen nimmt ab. Sieht nach mehr Abwärtsdruck aus.
SHORT: Einstieg 0,150 – 0,155. SL 0,170. TP1 0,143, TP2 0,130, TP3 0,122, TP4 0,110.
Wenn es 0,170 mit Volumen zurückerobert, auf Long wechseln. Long-Ziele: 0,200, 0,214, 0,250.
Nicht hinterherjagen. Auf Bestätigung warten. Risiko steuern.
SHORT: Einstieg 0,150 – 0,155. SL 0,170. TP1 0,143, TP2 0,130, TP3 0,122, TP4 0,110.
Wenn es 0,170 mit Volumen zurückerobert, auf Long wechseln. Long-Ziele: 0,200, 0,214, 0,250.
Nicht hinterherjagen. Auf Bestätigung warten. Risiko steuern.
1
303
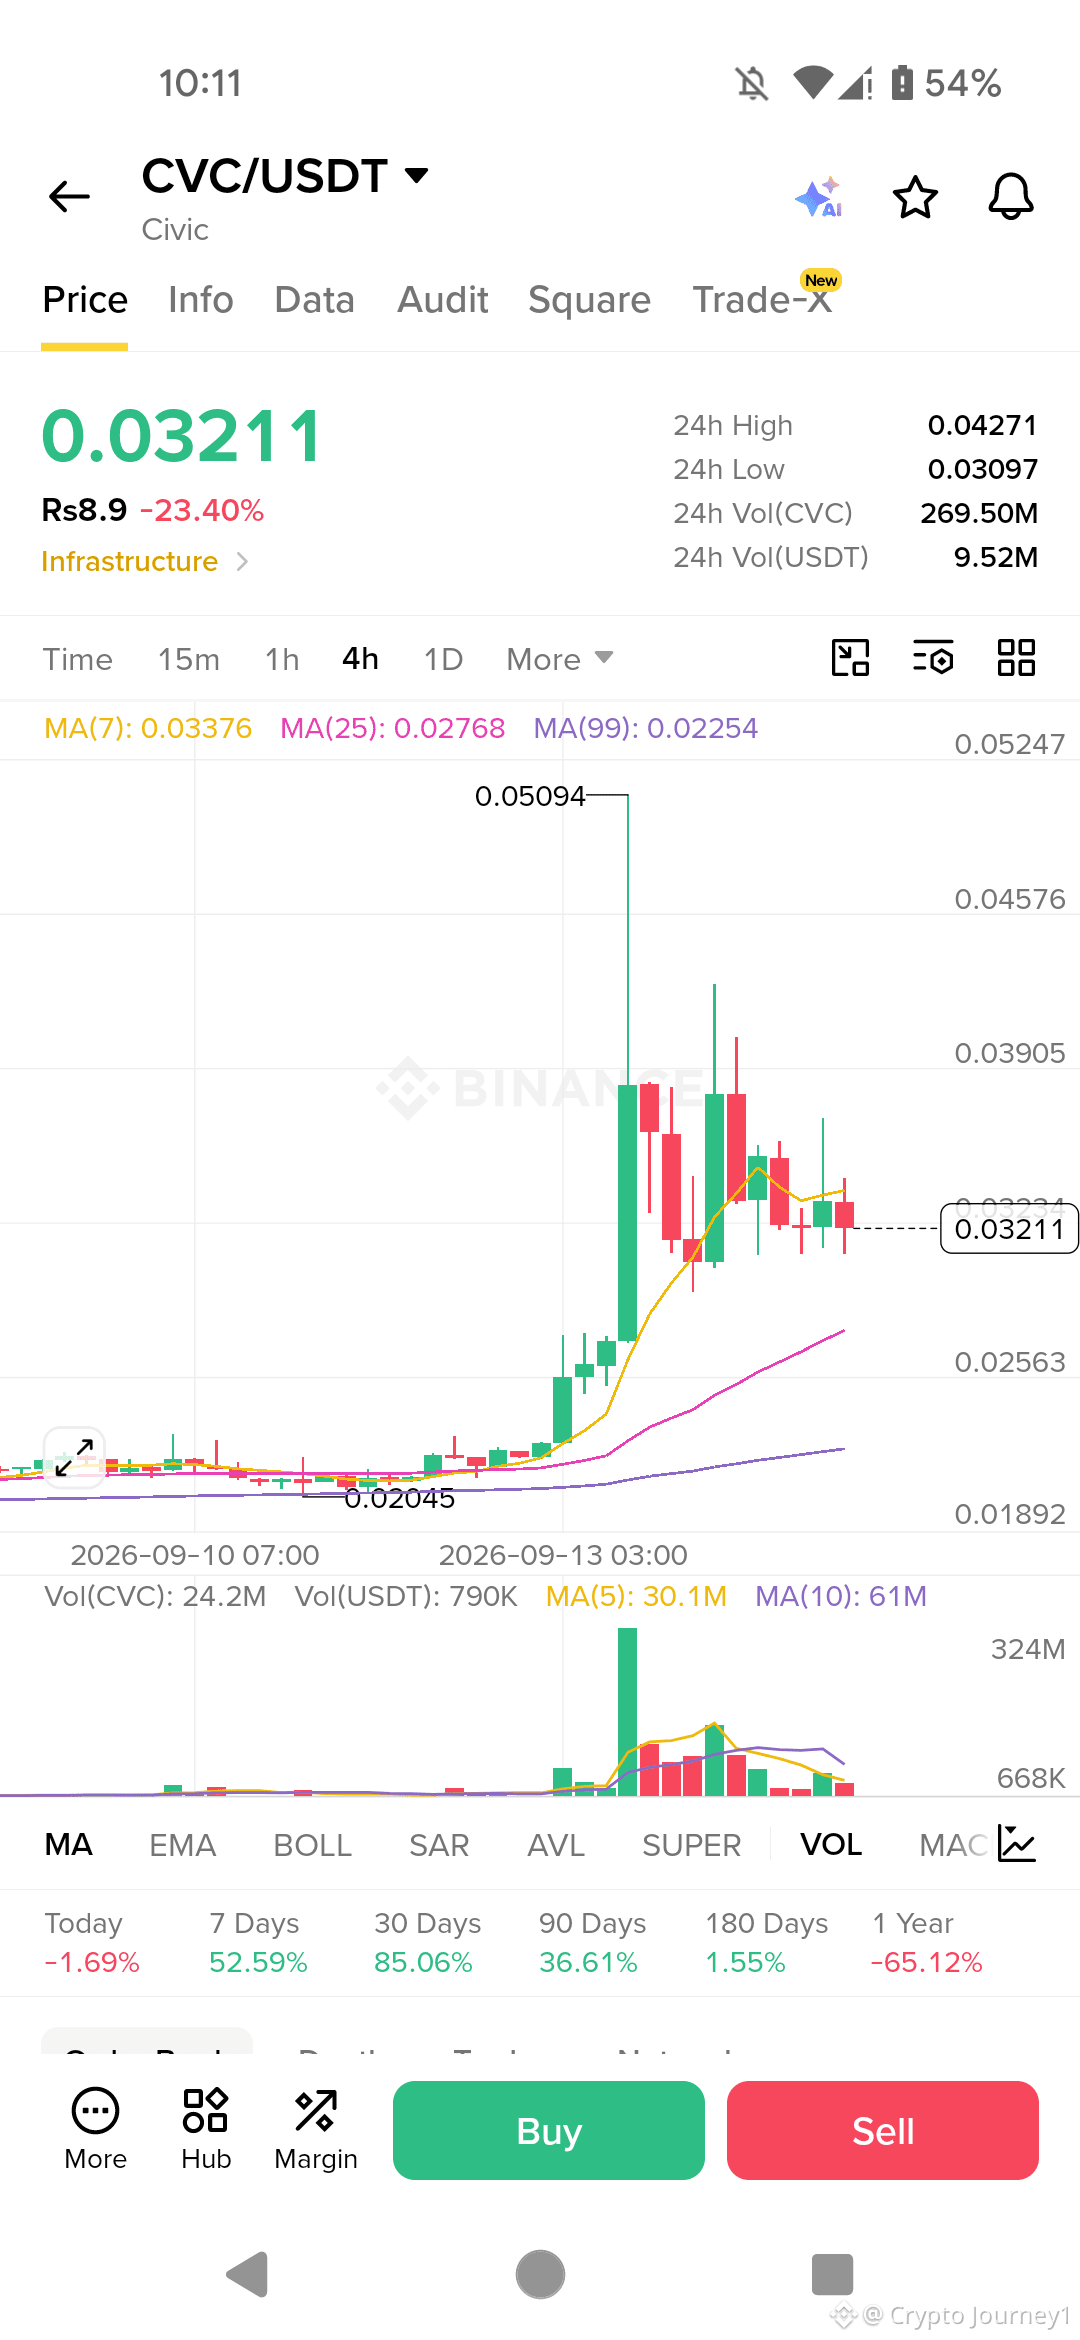
$CVC — Gepumpt & gedumpt! Kurzes Setup!
CVC stieg auf 0.05094, wurde nun hart abgewiesen bei 0.03211 (-23.4%). Kurs unter MA7, bärisch.
SHORT:
Einstieg: 0.032 – 0.034
SL: 0.040
TP1: 0.025
TP2: 0.020
TP3: 0.015
TP4: 0.010
Wenn 0.040 mit Volumen durchbrochen wird, drehe auf LONG.
LONG-Ziele: 0.060 – 0.080 – 0.100 – 0.150
Nicht hinterherjagen. Auf Bestätigung warten.
$CVC — Gepumpt & gedumpt! Kurzes Setup!
CVC stieg auf 0.05094, wurde nun hart abgewiesen bei 0.03211 (-23.4%). Kurs unter MA7, bärisch.
SHORT:
Einstieg: 0.032 – 0.034
SL: 0.040
TP1: 0.025
TP2: 0.020
TP3: 0.015
TP4: 0.010
Wenn 0.040 mit Volumen durchbrochen wird, drehe auf LONG.
LONG-Ziele: 0.060 – 0.080 – 0.100 – 0.150
Nicht hinterherjagen. Auf Bestätigung warten.
CVC stieg auf 0.05094, wurde nun hart abgewiesen bei 0.03211 (-23.4%). Kurs unter MA7, bärisch.
SHORT:
Einstieg: 0.032 – 0.034
SL: 0.040
TP1: 0.025
TP2: 0.020
TP3: 0.015
TP4: 0.010
Wenn 0.040 mit Volumen durchbrochen wird, drehe auf LONG.
LONG-Ziele: 0.060 – 0.080 – 0.100 – 0.150
Nicht hinterherjagen. Auf Bestätigung warten.
1
1
566
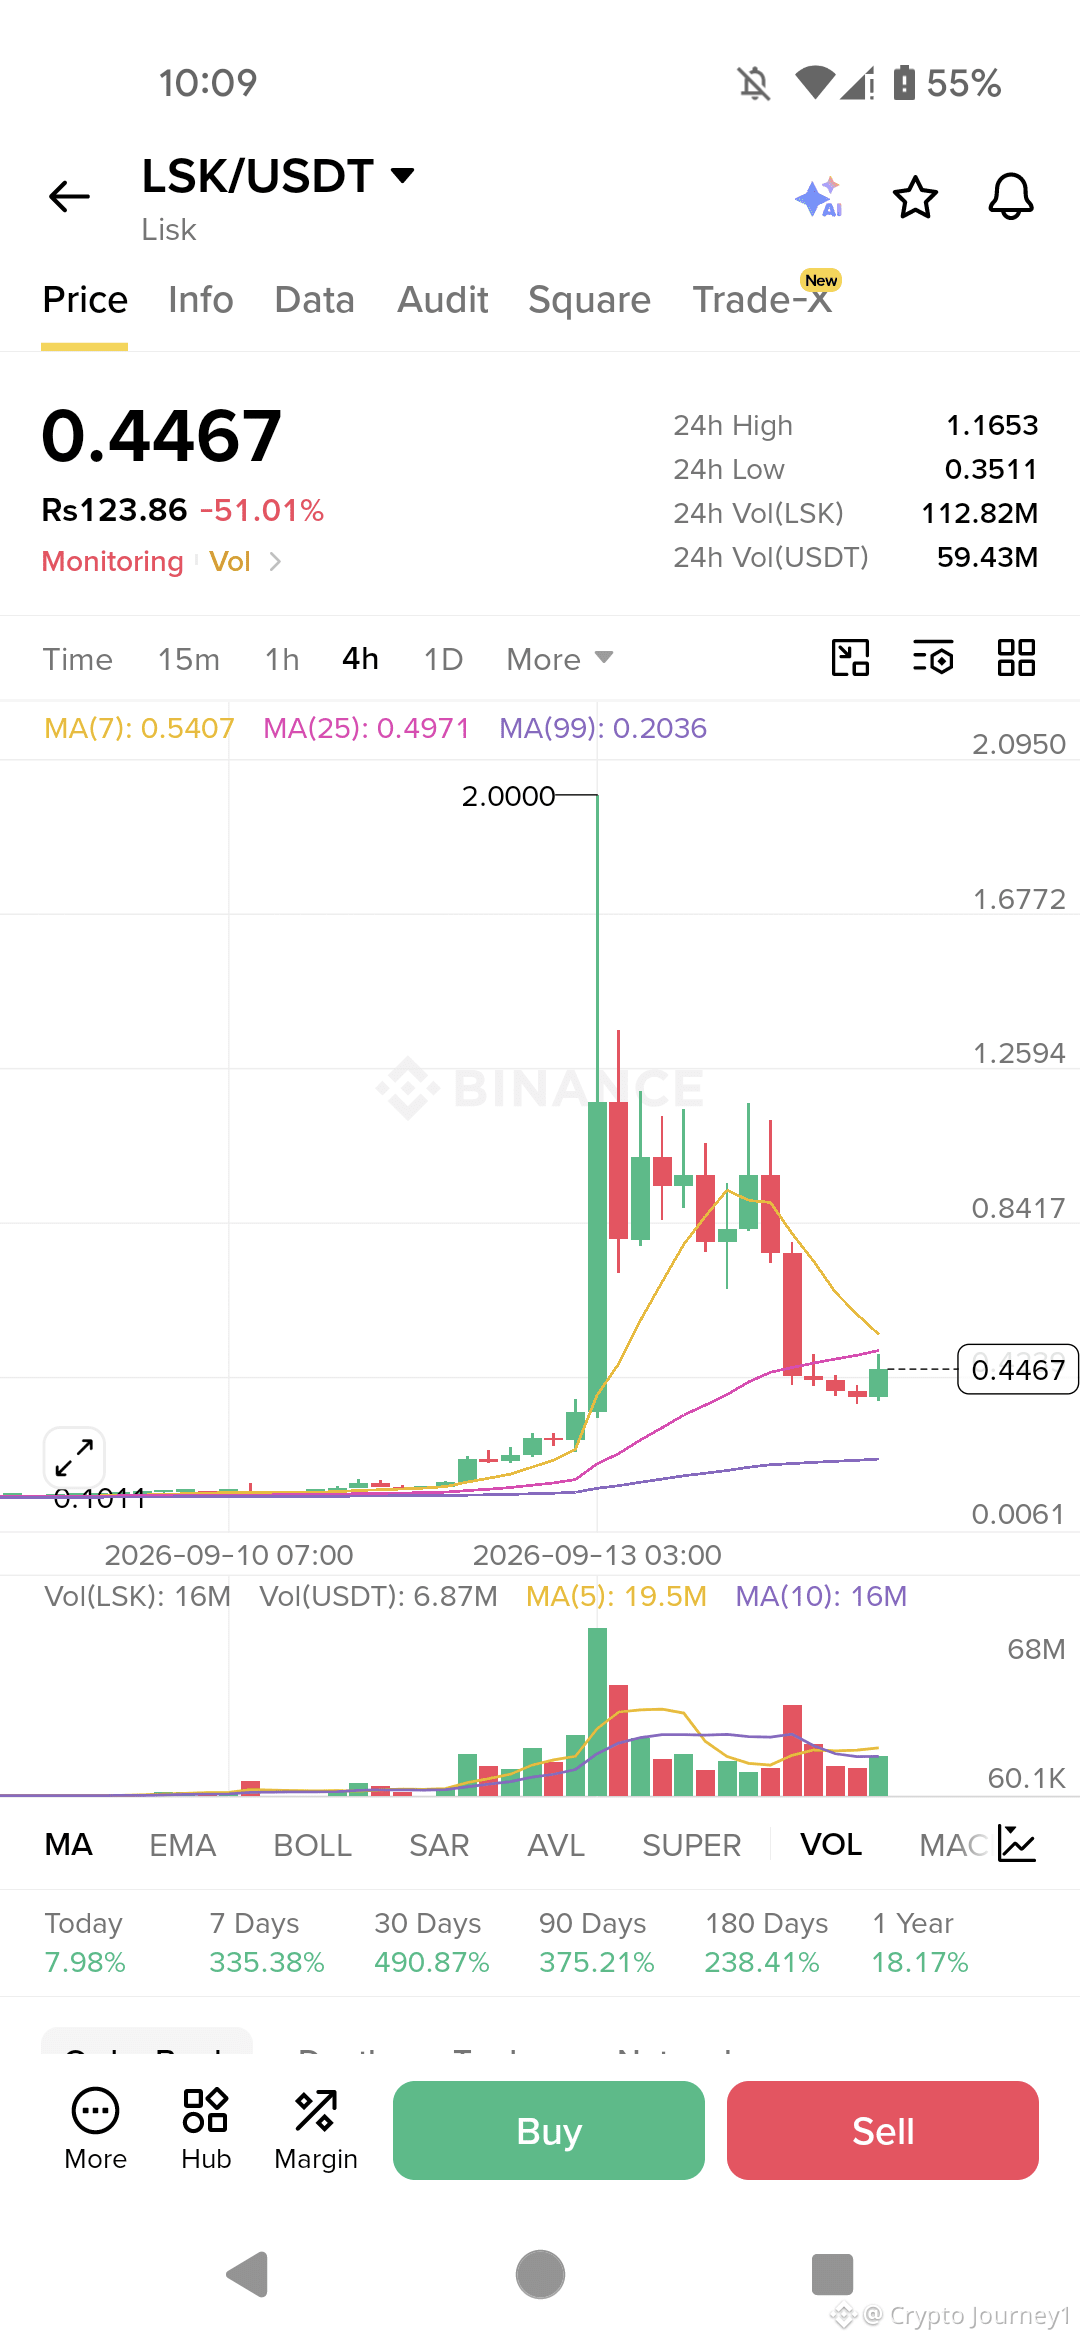
$LSK — AUF 2 GEHEDRÜCKT, AUF 0,44 ABGELASSEN! KURZE EINSTIEGSPHASE!
LSK schoss parabolisch auf $2,00 und stürzte dann um 78% auf $0,4467 ab. Das ist ein klassischer Pump-and-Dump. Der Kurs liegt jetzt unter MA7 (0,5407) und MA25 (0,4971) — bärisch. MA99 liegt bei 0,2036, weit darunter, daher könnte der langfristige Trend immer noch bullisch sein, aber kurzfristig blutet es.
SHORT:
Einstieg: 0,45 – 0,50
SL: 0,60
TP1: 0,35
TP2: 0,30
TP3: 0,25
TP4: 0,20
TP5: 0,15
Wenn er über 0,55 ausbricht und das mit Volumen, dann long wechseln.
LONG-Ziele: 0,70 – 0,90 – 1,20 – 1,50
Nicht hinterherjagen. Abwarten und Bestätigung holen. Risiko managen.
$LSK — AUF 2 GEHEDRÜCKT, AUF 0,44 ABGELASSEN! KURZE EINSTIEGSPHASE!
LSK schoss parabolisch auf $2,00 und stürzte dann um 78% auf $0,4467 ab. Das ist ein klassischer Pump-and-Dump. Der Kurs liegt jetzt unter MA7 (0,5407) und MA25 (0,4971) — bärisch. MA99 liegt bei 0,2036, weit darunter, daher könnte der langfristige Trend immer noch bullisch sein, aber kurzfristig blutet es.
SHORT:
Einstieg: 0,45 – 0,50
SL: 0,60
TP1: 0,35
TP2: 0,30
TP3: 0,25
TP4: 0,20
TP5: 0,15
Wenn er über 0,55 ausbricht und das mit Volumen, dann long wechseln.
LONG-Ziele: 0,70 – 0,90 – 1,20 – 1,50
Nicht hinterherjagen. Abwarten und Bestätigung holen. Risiko managen.
LSK schoss parabolisch auf $2,00 und stürzte dann um 78% auf $0,4467 ab. Das ist ein klassischer Pump-and-Dump. Der Kurs liegt jetzt unter MA7 (0,5407) und MA25 (0,4971) — bärisch. MA99 liegt bei 0,2036, weit darunter, daher könnte der langfristige Trend immer noch bullisch sein, aber kurzfristig blutet es.
SHORT:
Einstieg: 0,45 – 0,50
SL: 0,60
TP1: 0,35
TP2: 0,30
TP3: 0,25
TP4: 0,20
TP5: 0,15
Wenn er über 0,55 ausbricht und das mit Volumen, dann long wechseln.
LONG-Ziele: 0,70 – 0,90 – 1,20 – 1,50
Nicht hinterherjagen. Abwarten und Bestätigung holen. Risiko managen.
746
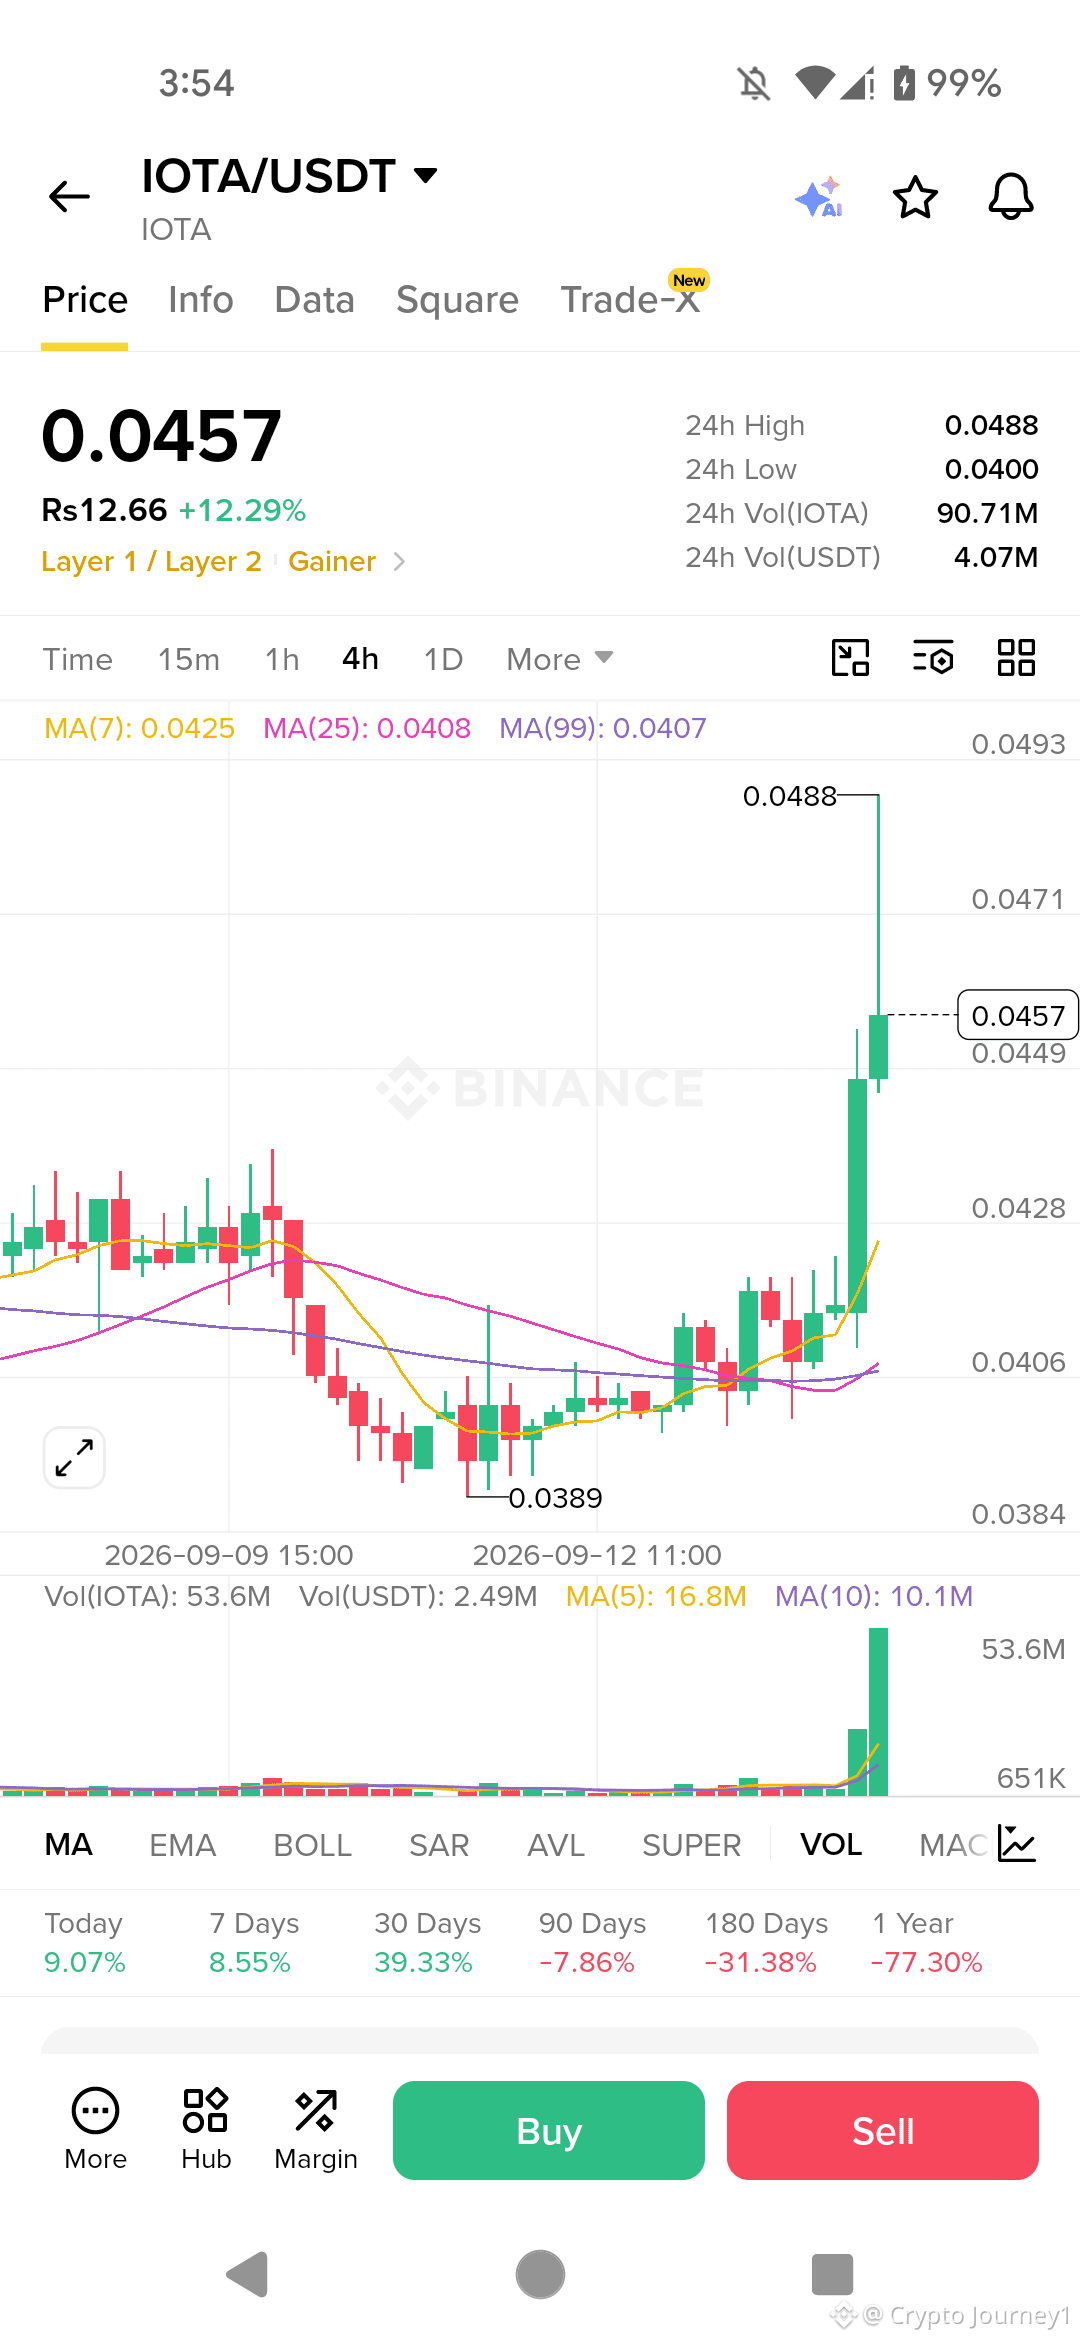
$IOTA — Bullisher Ausbruch! Jetzt große Long-FOMO.
Der Chart zeigt einen starken Pump von 0.0389 auf 0.0488, das Volumen ist massiv. Der Preis liegt über allen MAs. Ein Pullback auf 0.0457 ist eine Kaufgelegenheit.
LONG:
Entry: 0.0440 – 0.0460
SL: 0.0400
TP1: 0.0500
TP2: 0.0550
TP3: 0.0600
TP4: 0.0700
Wenn es unter 0.0400 bricht, short gehen (umdrehen).
SHORT-Ziele: 0.0380 – 0.0350 – 0.0300
Abwarten und auf Bestätigung warten. Nicht hinterherlaufen.
$IOTA — Bullisher Ausbruch! Jetzt große Long-FOMO.
Der Chart zeigt einen starken Pump von 0.0389 auf 0.0488, das Volumen ist massiv. Der Preis liegt über allen MAs. Ein Pullback auf 0.0457 ist eine Kaufgelegenheit.
LONG:
Entry: 0.0440 – 0.0460
SL: 0.0400
TP1: 0.0500
TP2: 0.0550
TP3: 0.0600
TP4: 0.0700
Wenn es unter 0.0400 bricht, short gehen (umdrehen).
SHORT-Ziele: 0.0380 – 0.0350 – 0.0300
Abwarten und auf Bestätigung warten. Nicht hinterherlaufen.
Der Chart zeigt einen starken Pump von 0.0389 auf 0.0488, das Volumen ist massiv. Der Preis liegt über allen MAs. Ein Pullback auf 0.0457 ist eine Kaufgelegenheit.
LONG:
Entry: 0.0440 – 0.0460
SL: 0.0400
TP1: 0.0500
TP2: 0.0550
TP3: 0.0600
TP4: 0.0700
Wenn es unter 0.0400 bricht, short gehen (umdrehen).
SHORT-Ziele: 0.0380 – 0.0350 – 0.0300
Abwarten und auf Bestätigung warten. Nicht hinterherlaufen.
376
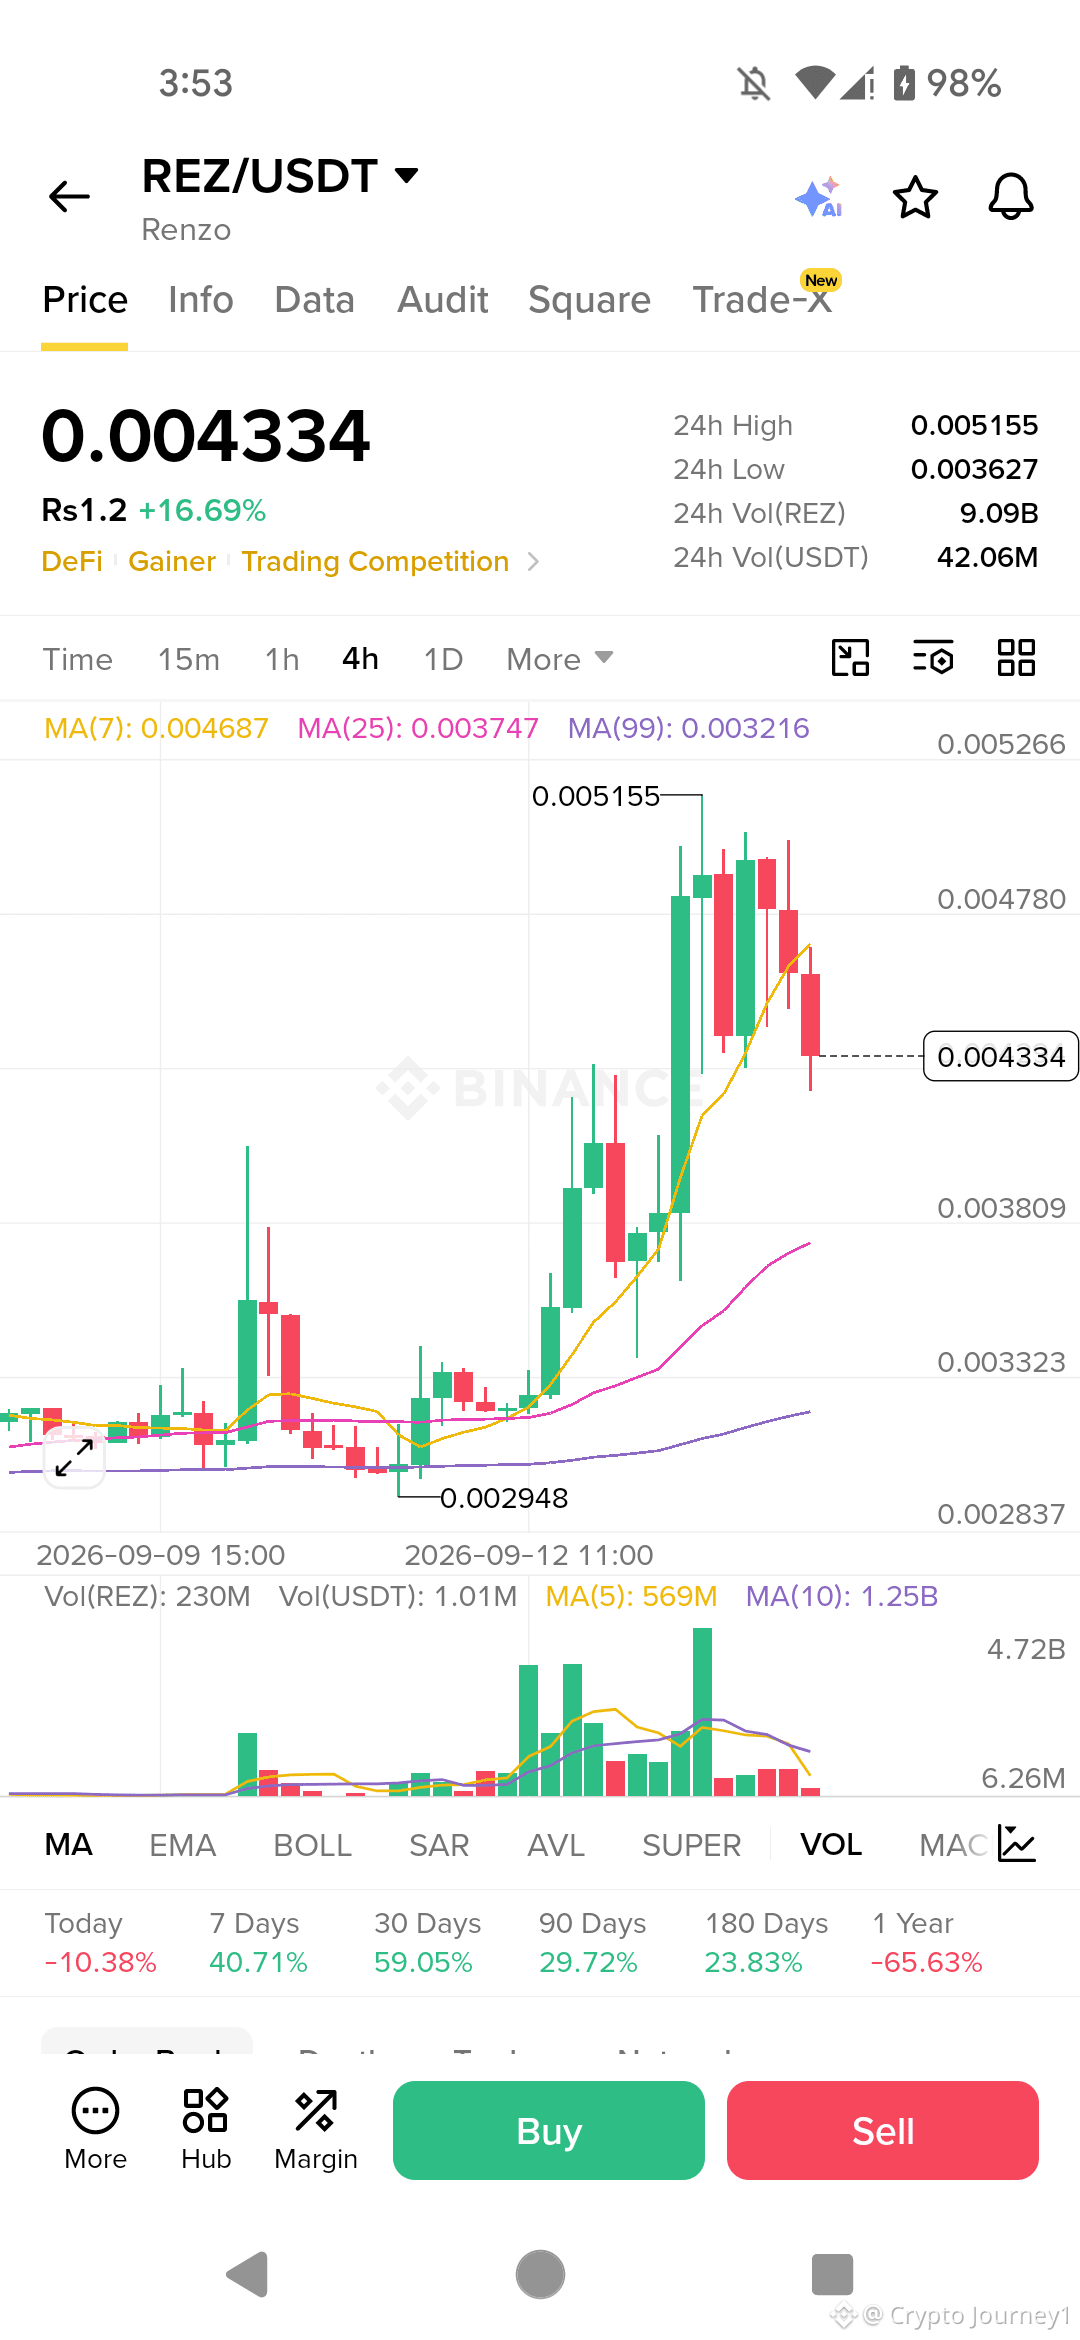
$REZ — Auf 0.005155 gepumpt, jetzt abgewiesen und zieht sich auf 0.004334 zurück. Unter MA7 kurzfristig bärisch.
SHORT:
Einstieg: 0.00435 – 0.00445
SL: 0.00470
TP1: 0.00400
TP2: 0.00350
TP3: 0.00300
TP4: 0.00250
Wenn es mit Volumen über 0.00470 ausbricht, gehe long.
LONG-Ziele: 0.00550 – 0.00650 – 0.00800 – 0.01000
Das Volumen ist beim Pump gestiegen, jetzt flacht es ab. Warte auf Bestätigung. Nicht hinterherlaufen.
⚠️ Nur persönliche Analyse — keine Finanzberatung. Bitte immer eigene Recherche (DYOR) durchführen.
$REZ — Auf 0.005155 gepumpt, jetzt abgewiesen und zieht sich auf 0.004334 zurück. Unter MA7 kurzfristig bärisch.
SHORT:
Einstieg: 0.00435 – 0.00445
SL: 0.00470
TP1: 0.00400
TP2: 0.00350
TP3: 0.00300
TP4: 0.00250
Wenn es mit Volumen über 0.00470 ausbricht, gehe long.
LONG-Ziele: 0.00550 – 0.00650 – 0.00800 – 0.01000
Das Volumen ist beim Pump gestiegen, jetzt flacht es ab. Warte auf Bestätigung. Nicht hinterherlaufen.
⚠️ Nur persönliche Analyse — keine Finanzberatung. Bitte immer eigene Recherche (DYOR) durchführen.
SHORT:
Einstieg: 0.00435 – 0.00445
SL: 0.00470
TP1: 0.00400
TP2: 0.00350
TP3: 0.00300
TP4: 0.00250
Wenn es mit Volumen über 0.00470 ausbricht, gehe long.
LONG-Ziele: 0.00550 – 0.00650 – 0.00800 – 0.01000
Das Volumen ist beim Pump gestiegen, jetzt flacht es ab. Warte auf Bestätigung. Nicht hinterherlaufen.
⚠️ Nur persönliche Analyse — keine Finanzberatung. Bitte immer eigene Recherche (DYOR) durchführen.
300
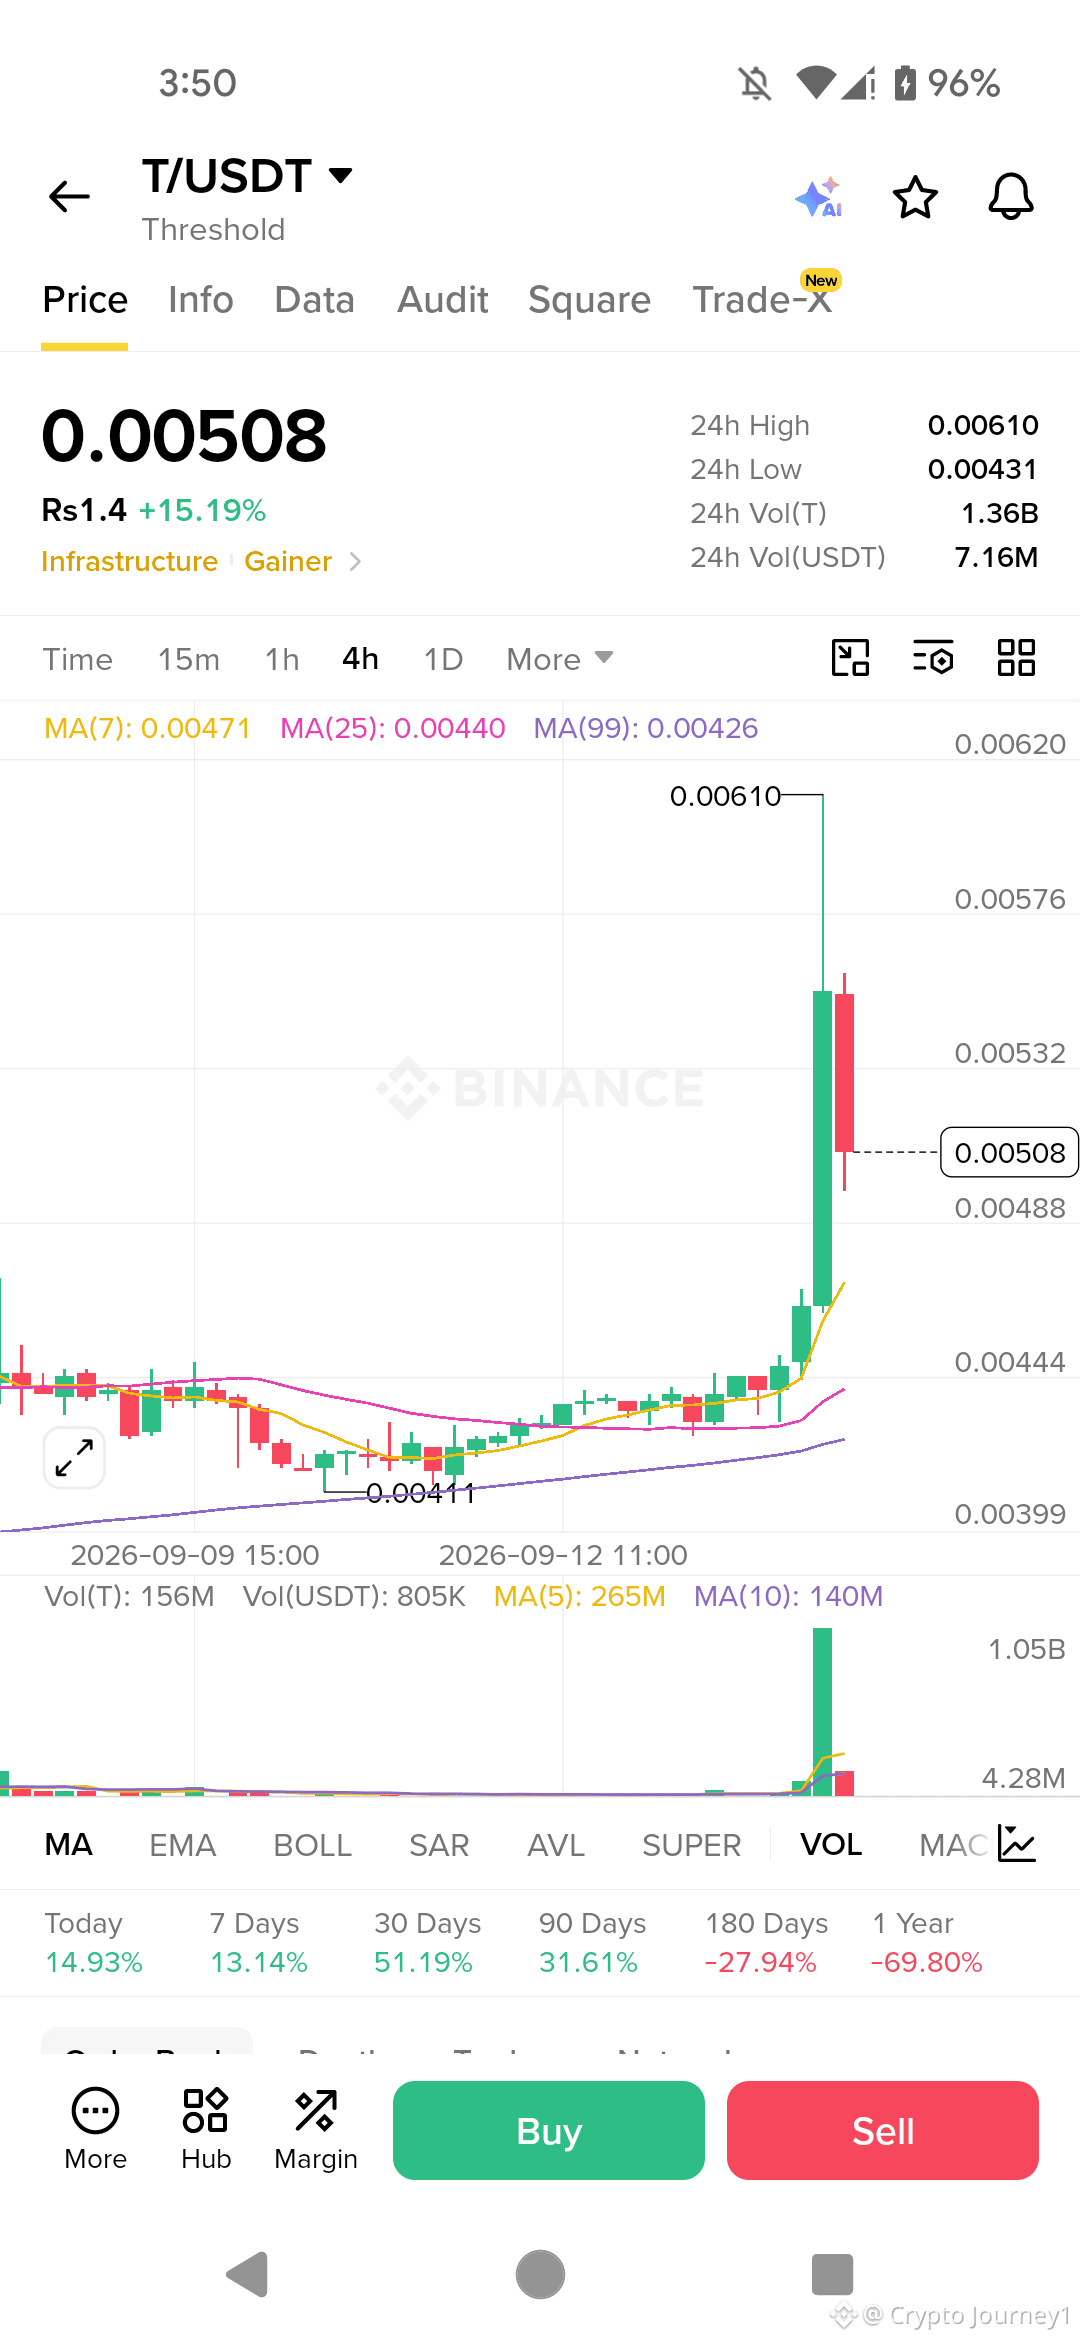
$T — Auf 0.00610 gepumpt, jetzt Rückzug auf 0.00508. Ablehnung am Hoch. Achte auf die nächste Bewegung.
Wenn es über 0.00471 (MA7) hält:
LONG
Einstieg: 0.00480 – 0.00500
SL: 0.00440
TP1: 0.00610
TP2: 0.00700
TP3: 0.00800
TP4: 0.01000
Wenn es unter 0.00440 (MA25) bricht:
SHORT
Einstieg: 0.00440 – 0.00450
SL: 0.00480
TP1: 0.00400
TP2: 0.00350
TP3: 0.00300
Das Volumen ist beim Pump kurzzeitig stark angestiegen, jetzt nimmt es ab. Warte auf Bestätigung. Nicht hinterherlaufen.
⚠️ Nur persönliche Analyse — keine Finanzberatung. Immer selbst recherchieren (DYOR).
$T — Auf 0.00610 gepumpt, jetzt Rückzug auf 0.00508. Ablehnung am Hoch. Achte auf die nächste Bewegung.
Wenn es über 0.00471 (MA7) hält:
LONG
Einstieg: 0.00480 – 0.00500
SL: 0.00440
TP1: 0.00610
TP2: 0.00700
TP3: 0.00800
TP4: 0.01000
Wenn es unter 0.00440 (MA25) bricht:
SHORT
Einstieg: 0.00440 – 0.00450
SL: 0.00480
TP1: 0.00400
TP2: 0.00350
TP3: 0.00300
Das Volumen ist beim Pump kurzzeitig stark angestiegen, jetzt nimmt es ab. Warte auf Bestätigung. Nicht hinterherlaufen.
⚠️ Nur persönliche Analyse — keine Finanzberatung. Immer selbst recherchieren (DYOR).
Wenn es über 0.00471 (MA7) hält:
LONG
Einstieg: 0.00480 – 0.00500
SL: 0.00440
TP1: 0.00610
TP2: 0.00700
TP3: 0.00800
TP4: 0.01000
Wenn es unter 0.00440 (MA25) bricht:
SHORT
Einstieg: 0.00440 – 0.00450
SL: 0.00480
TP1: 0.00400
TP2: 0.00350
TP3: 0.00300
Das Volumen ist beim Pump kurzzeitig stark angestiegen, jetzt nimmt es ab. Warte auf Bestätigung. Nicht hinterherlaufen.
⚠️ Nur persönliche Analyse — keine Finanzberatung. Immer selbst recherchieren (DYOR).
274
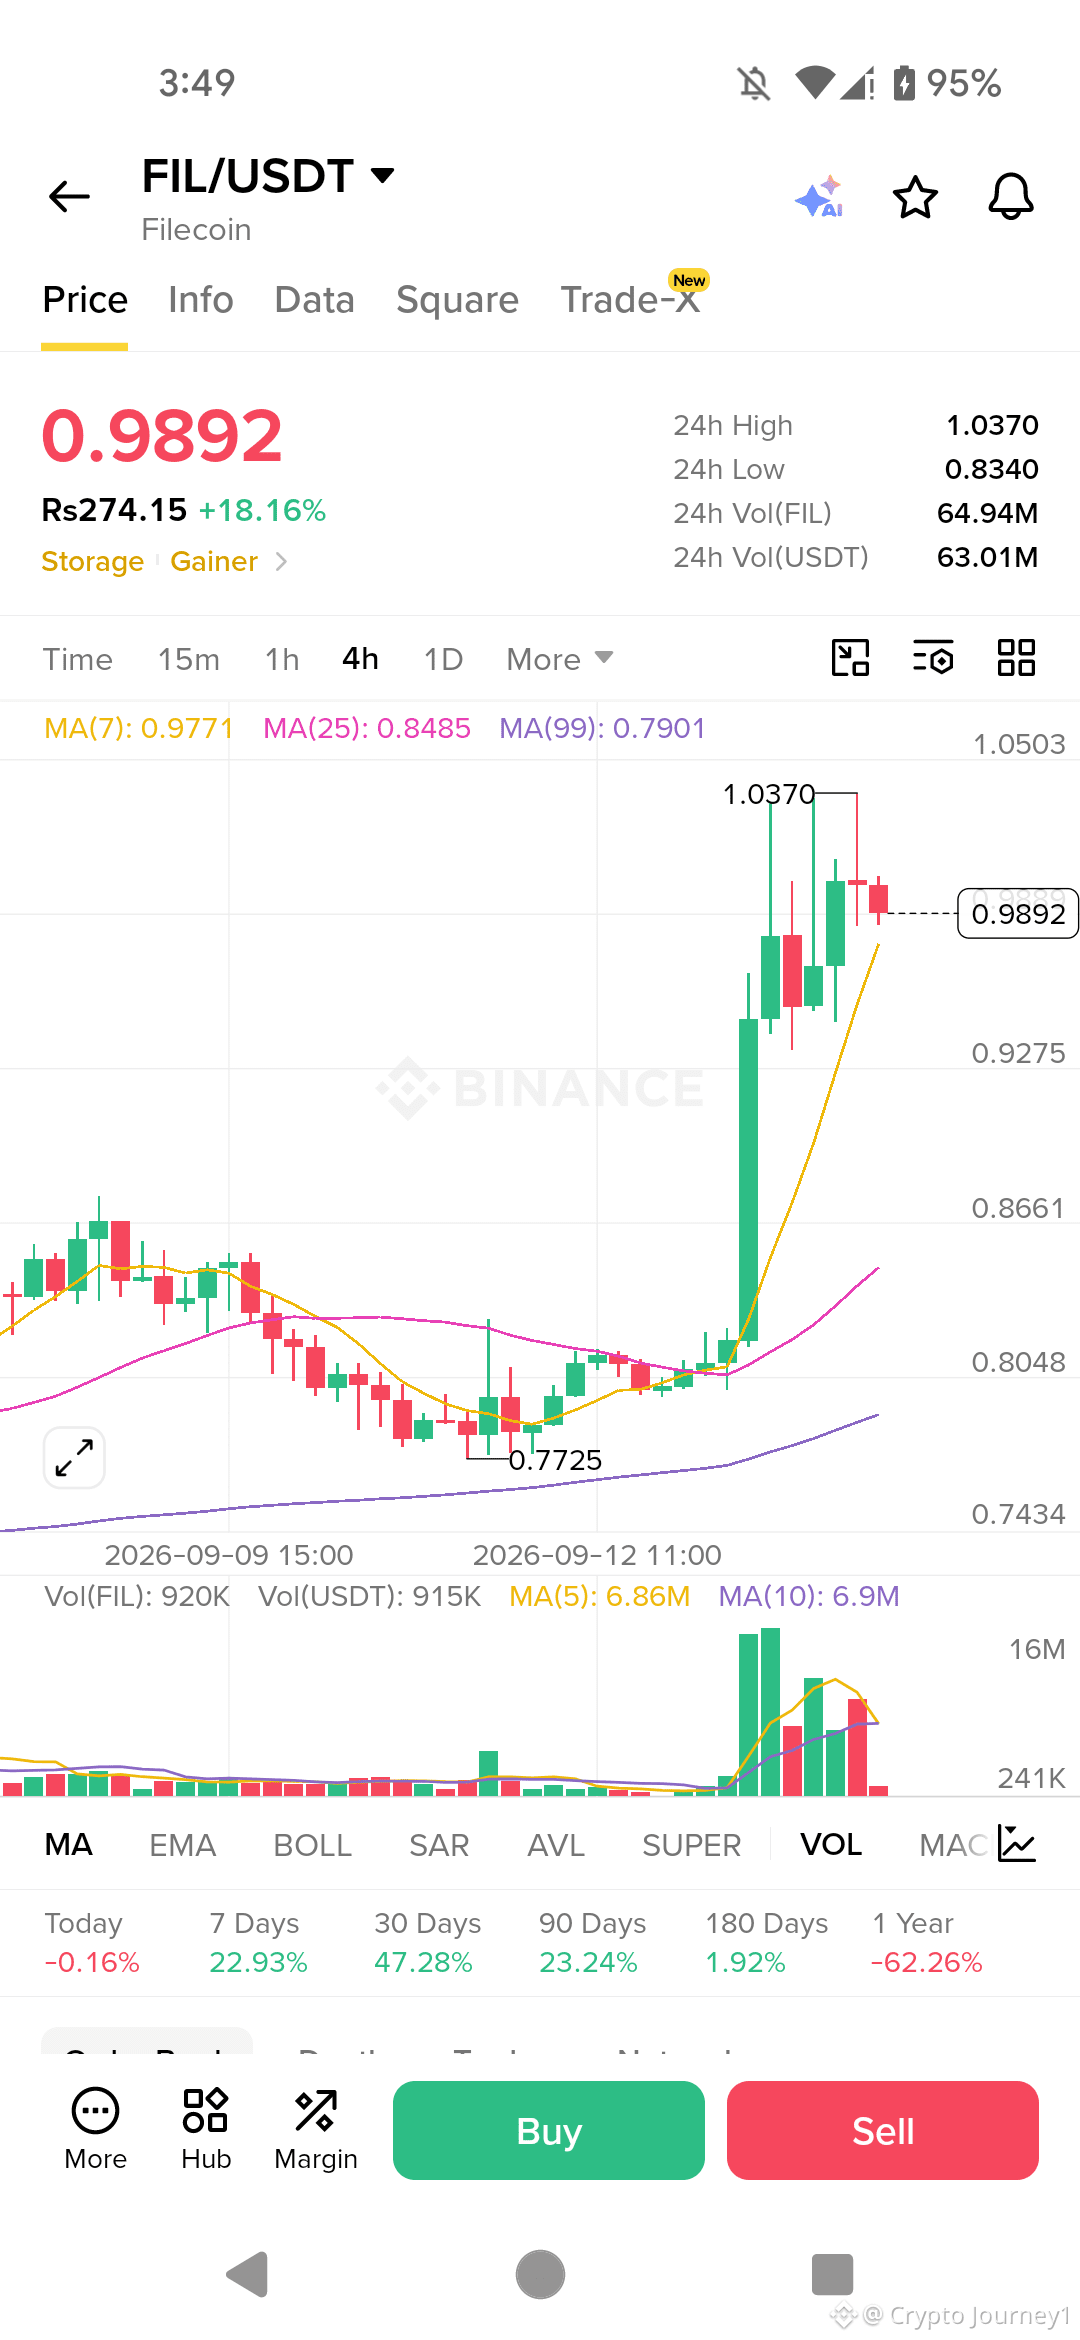
$FIL — Auf 1,03 gepumpt, zieht jetzt auf 0,99 zurück. Bullischer Trend ist weiterhin intakt. Kauf die Rücksetzer.
LONG:
Einstieg: 0,96 – 0,98
SL: 0,90
TP1: 1,10
TP2: 1,25
TP3: 1,50
TP4: 2,00
Wenn es unter 0,90 bricht, auf Short drehen.
SHORT-Ziele: 0,85 – 0,80 – 0,75
Abwarten und Bestätigung holen. Nicht hinterherjagen.
⚠️ Nur persönliche Analyse — keine finanzielle Beratung. Mach immer DYOR.
$FIL — Auf 1,03 gepumpt, zieht jetzt auf 0,99 zurück. Bullischer Trend ist weiterhin intakt. Kauf die Rücksetzer.
LONG:
Einstieg: 0,96 – 0,98
SL: 0,90
TP1: 1,10
TP2: 1,25
TP3: 1,50
TP4: 2,00
Wenn es unter 0,90 bricht, auf Short drehen.
SHORT-Ziele: 0,85 – 0,80 – 0,75
Abwarten und Bestätigung holen. Nicht hinterherjagen.
⚠️ Nur persönliche Analyse — keine finanzielle Beratung. Mach immer DYOR.
LONG:
Einstieg: 0,96 – 0,98
SL: 0,90
TP1: 1,10
TP2: 1,25
TP3: 1,50
TP4: 2,00
Wenn es unter 0,90 bricht, auf Short drehen.
SHORT-Ziele: 0,85 – 0,80 – 0,75
Abwarten und Bestätigung holen. Nicht hinterherjagen.
⚠️ Nur persönliche Analyse — keine finanzielle Beratung. Mach immer DYOR.
1
592
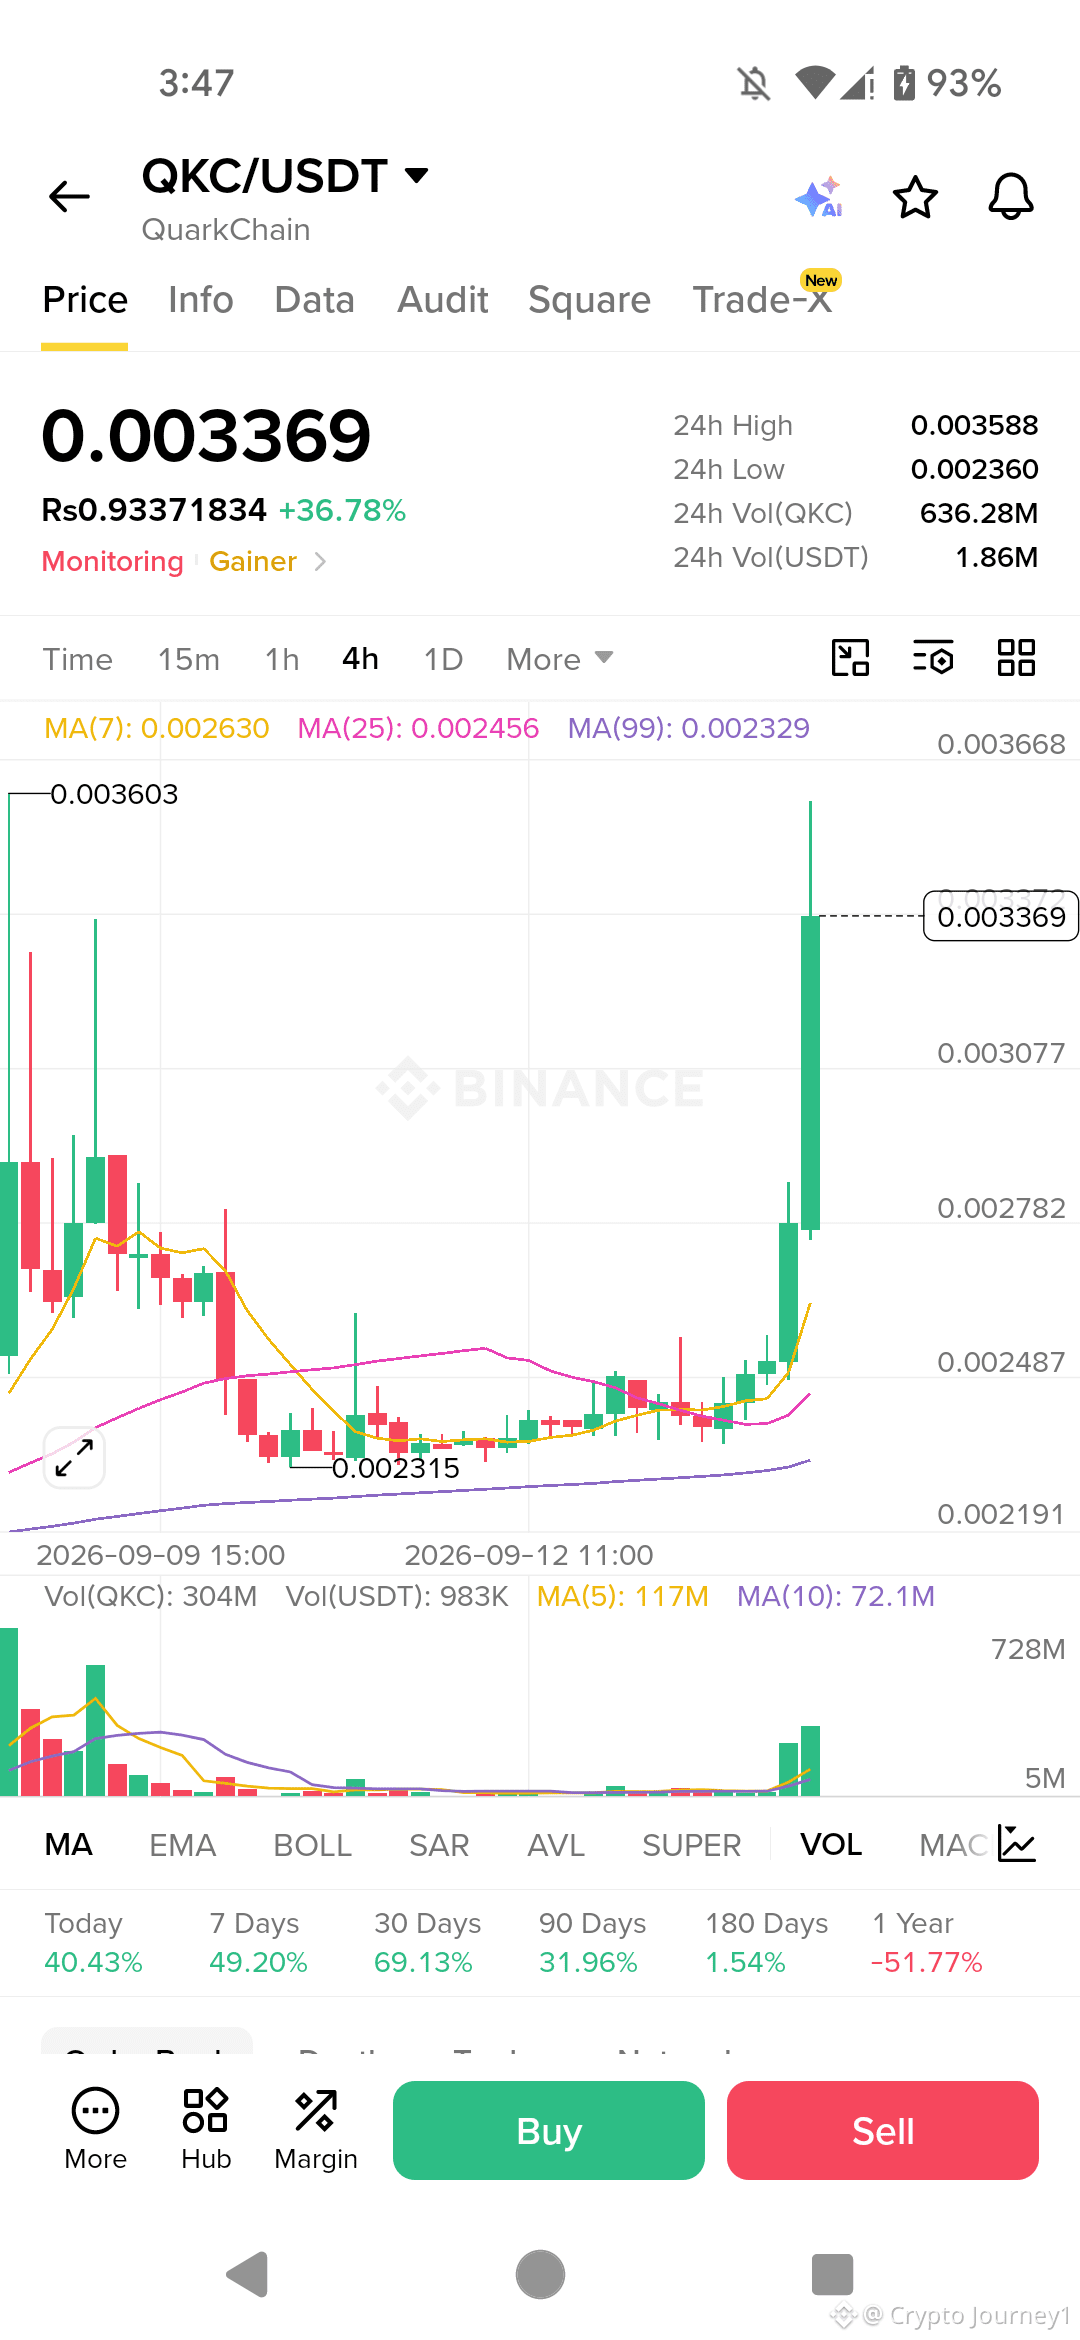
$QKC — Großer Pump +36%! Volumenexplosion. Preis bei 0.003369, 24h-Hoch 0.003588.
Wenn Ausbruch über 0.00360 mit Volumen:
LONG
Einstieg: 0.00335 – 0.00345
SL: 0.00315
TP1: 0.00400
TP2: 0.00450
TP3: 0.00500
TP4: 0.00600
Wenn Ablehnung bei 0.00360:
SHORT
Einstieg: 0.00355 – 0.00365
SL: 0.00380
TP1: 0.00300
TP2: 0.00260
TP3: 0.00230
Auf Bestätigung warten. Nicht hinterherjagen.
Nur persönliche Analyse — keine Finanzberatung. Immer DYOR.
$QKC — Großer Pump +36%! Volumenexplosion. Preis bei 0.003369, 24h-Hoch 0.003588.
Wenn Ausbruch über 0.00360 mit Volumen:
LONG
Einstieg: 0.00335 – 0.00345
SL: 0.00315
TP1: 0.00400
TP2: 0.00450
TP3: 0.00500
TP4: 0.00600
Wenn Ablehnung bei 0.00360:
SHORT
Einstieg: 0.00355 – 0.00365
SL: 0.00380
TP1: 0.00300
TP2: 0.00260
TP3: 0.00230
Auf Bestätigung warten. Nicht hinterherjagen.
Nur persönliche Analyse — keine Finanzberatung. Immer DYOR.
Wenn Ausbruch über 0.00360 mit Volumen:
LONG
Einstieg: 0.00335 – 0.00345
SL: 0.00315
TP1: 0.00400
TP2: 0.00450
TP3: 0.00500
TP4: 0.00600
Wenn Ablehnung bei 0.00360:
SHORT
Einstieg: 0.00355 – 0.00365
SL: 0.00380
TP1: 0.00300
TP2: 0.00260
TP3: 0.00230
Auf Bestätigung warten. Nicht hinterherjagen.
Nur persönliche Analyse — keine Finanzberatung. Immer DYOR.
1
343
Artikel
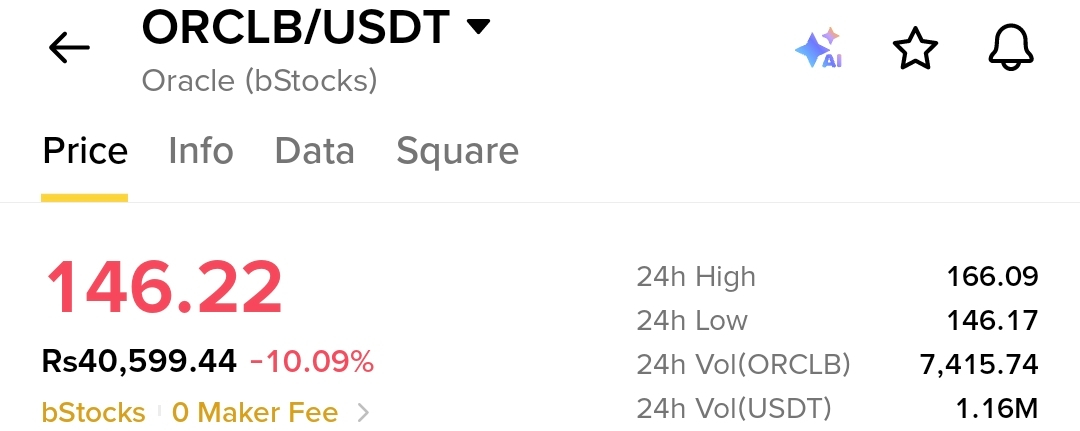
DER HANDEL MIT TOKENISIERTEN AKTIEN RISS — GEWINNE ÜBERTRIFFEN ERWARTUNGEN UND EIN REORGANISATIONSPLAN IM WERT VON 700 MILLIONEN US-DOLLAR KANN ES NICHT RETTEN$ORCL Das tokenisierte Oracle-Aktie blutet. Heute um 10,09% gefallen auf 146,22 US-Dollar, nachdem sie zuvor ein Hoch von 166,09 US-Dollar erreicht hatte. Die zugrunde liegende Aktie (ORCL) ist nur um 1,84% gefallen und liegt bei 150,09 US-Dollar. Diese Divergenz ist die eigentliche Geschichte.
WARUM DIE DIVERGENZ?
ORCLB bildet Oracle Corp (ORCL) ab, die gerade am 10. September überaus starke Q1-Gewinne für das Geschäftsjahr 2027 gemeldet hat. Der Umsatz erreichte 19,35 Milliarden US-Dollar, ein Plus von 30% im Jahresvergleich, und lag damit über den Erwartungen. Das bereinigte EPS von 1,92 US-Dollar übertraf die Konsensschätzung von 1,74 US-Dollar deutlich. Der Umsatz aus Cloud-Infrastruktur hat sich mehr als verdoppelt. Die verbleibenden Performance Obligations (RPO) erreichten mit 664 Milliarden US-Dollar einen neuen Rekord. Die Aktie stieg am Freitag um 2,5% auf 157,18 US-Dollar.
DER HANDEL MIT TOKENISIERTEN AKTIEN RISS — GEWINNE ÜBERTRIFFEN ERWARTUNGEN UND EIN REORGANISATIONSPLAN IM WERT VON 700 MILLIONEN US-DOLLAR KANN ES NICHT RETTEN
$ORCL Das tokenisierte Oracle-Aktie blutet. Heute um 10,09% gefallen auf 146,22 US-Dollar, nachdem sie zuvor ein Hoch von 166,09 US-Dollar erreicht hatte. Die zugrunde liegende Aktie (ORCL) ist nur um 1,84% gefallen und liegt bei 150,09 US-Dollar. Diese Divergenz ist die eigentliche Geschichte.
WARUM DIE DIVERGENZ?
ORCLB bildet Oracle Corp (ORCL) ab, die gerade am 10. September überaus starke Q1-Gewinne für das Geschäftsjahr 2027 gemeldet hat. Der Umsatz erreichte 19,35 Milliarden US-Dollar, ein Plus von 30% im Jahresvergleich, und lag damit über den Erwartungen. Das bereinigte EPS von 1,92 US-Dollar übertraf die Konsensschätzung von 1,74 US-Dollar deutlich. Der Umsatz aus Cloud-Infrastruktur hat sich mehr als verdoppelt. Die verbleibenden Performance Obligations (RPO) erreichten mit 664 Milliarden US-Dollar einen neuen Rekord. Die Aktie stieg am Freitag um 2,5% auf 157,18 US-Dollar.
WARUM DIE DIVERGENZ?
ORCLB bildet Oracle Corp (ORCL) ab, die gerade am 10. September überaus starke Q1-Gewinne für das Geschäftsjahr 2027 gemeldet hat. Der Umsatz erreichte 19,35 Milliarden US-Dollar, ein Plus von 30% im Jahresvergleich, und lag damit über den Erwartungen. Das bereinigte EPS von 1,92 US-Dollar übertraf die Konsensschätzung von 1,74 US-Dollar deutlich. Der Umsatz aus Cloud-Infrastruktur hat sich mehr als verdoppelt. Die verbleibenden Performance Obligations (RPO) erreichten mit 664 Milliarden US-Dollar einen neuen Rekord. Die Aktie stieg am Freitag um 2,5% auf 157,18 US-Dollar.
277
Artikel
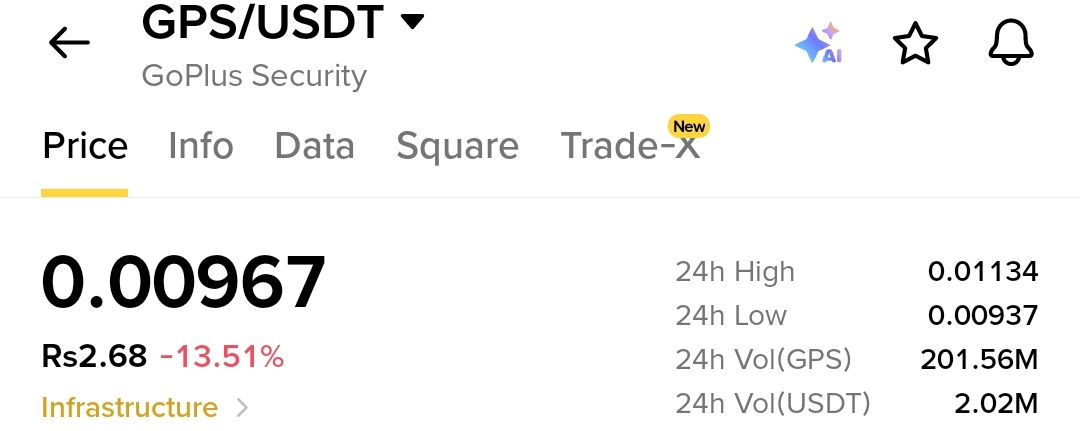
DER SECURITY-TOKEN, DER SEIN EIGENES SICHERHEITSTEST VERFEHLT$GPS Die Security wurde gerade richtig durchgerüttelt. Heute um 13,51 % gefallen auf 0,00967 $. Kurs-Hoch bei 0,01291 $, dann eingebrochen. Das Chart zeigt ein Lehrbuch-Beispiel für ein typisches Verteilungsmuster: Wale verkaufen in die Retail-FOMO hinein.
---
DIE FUNDAMENTALS (ECHT, ABER NICHT GENUG)
GoPlus ist die Web3-Sicherheitsschicht. OKX Wallet hat es integriert. Claw Wallet hat es integriert. Owlto hat es integriert. DeepScan hat im August ein AI-Upgrade bekommen. Echte Produkte. Echte Umsätze. Echte Nutzer.
Aber das ist das Problem. Das spielt keine Rolle, wenn das Angebot wächst.
---
DER TOKEN-ENTSPERRUNGSTERMIN IST IN 4 TAGEN
DER SECURITY-TOKEN, DER SEIN EIGENES SICHERHEITSTEST VERFEHLT
$GPS Die Security wurde gerade richtig durchgerüttelt. Heute um 13,51 % gefallen auf 0,00967 $. Kurs-Hoch bei 0,01291 $, dann eingebrochen. Das Chart zeigt ein Lehrbuch-Beispiel für ein typisches Verteilungsmuster: Wale verkaufen in die Retail-FOMO hinein.
---
DIE FUNDAMENTALS (ECHT, ABER NICHT GENUG)
GoPlus ist die Web3-Sicherheitsschicht. OKX Wallet hat es integriert. Claw Wallet hat es integriert. Owlto hat es integriert. DeepScan hat im August ein AI-Upgrade bekommen. Echte Produkte. Echte Umsätze. Echte Nutzer.
Aber das ist das Problem. Das spielt keine Rolle, wenn das Angebot wächst.
---
DER TOKEN-ENTSPERRUNGSTERMIN IST IN 4 TAGEN
---
DIE FUNDAMENTALS (ECHT, ABER NICHT GENUG)
GoPlus ist die Web3-Sicherheitsschicht. OKX Wallet hat es integriert. Claw Wallet hat es integriert. Owlto hat es integriert. DeepScan hat im August ein AI-Upgrade bekommen. Echte Produkte. Echte Umsätze. Echte Nutzer.
Aber das ist das Problem. Das spielt keine Rolle, wenn das Angebot wächst.
---
DER TOKEN-ENTSPERRUNGSTERMIN IST IN 4 TAGEN
781
Artikel
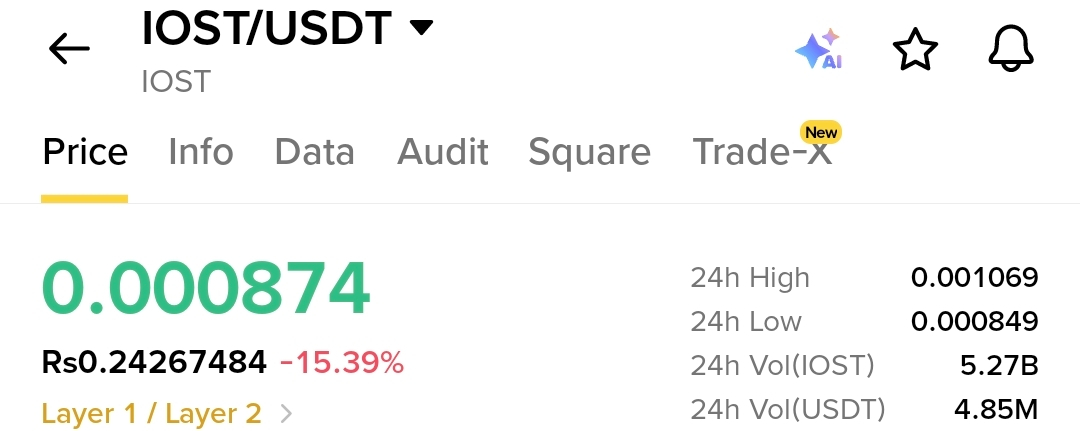
DER SHORT SQUEEZE, DER DIE KURVE ZÜNDETE — JETZT BEGINNT DER ABSTIEG$IOST gerade durch eine der gewalttätigsten Short Squeezes von 2026 gegangen, hat 117,6% von 0,0005$ auf 0,002448$ gesprengt, bevor es wieder einbrach. Jetzt liegt es bei 0,000874$, am Tag 15,39% im Minus. Der Squeeze ist tot. Die Frage ist nur, wie tief die Korrektur geht.
DER ECHTE KATALYSATOR (UND WARUM ES TATSÄCHLICH TREIBSTOFF WAR, NICHT FEUER)
Am 8. September hat die IOST Foundation dauerhaft 70 Millionen Token aus der frühen ERC-20-Ausgabe verbrannt. Aber hier ist die Rechnung: 70 Millionen von einem Hard Cap von 90 Milliarden sind nur 0,2% des Angebots. Das ist ein Rundungsfehler, keine grundlegende Veränderung.
DER SHORT SQUEEZE, DER DIE KURVE ZÜNDETE — JETZT BEGINNT DER ABSTIEG
$IOST gerade durch eine der gewalttätigsten Short Squeezes von 2026 gegangen, hat 117,6% von 0,0005$ auf 0,002448$ gesprengt, bevor es wieder einbrach. Jetzt liegt es bei 0,000874$, am Tag 15,39% im Minus. Der Squeeze ist tot. Die Frage ist nur, wie tief die Korrektur geht.
DER ECHTE KATALYSATOR (UND WARUM ES TATSÄCHLICH TREIBSTOFF WAR, NICHT FEUER)
Am 8. September hat die IOST Foundation dauerhaft 70 Millionen Token aus der frühen ERC-20-Ausgabe verbrannt. Aber hier ist die Rechnung: 70 Millionen von einem Hard Cap von 90 Milliarden sind nur 0,2% des Angebots. Das ist ein Rundungsfehler, keine grundlegende Veränderung.
DER ECHTE KATALYSATOR (UND WARUM ES TATSÄCHLICH TREIBSTOFF WAR, NICHT FEUER)
Am 8. September hat die IOST Foundation dauerhaft 70 Millionen Token aus der frühen ERC-20-Ausgabe verbrannt. Aber hier ist die Rechnung: 70 Millionen von einem Hard Cap von 90 Milliarden sind nur 0,2% des Angebots. Das ist ein Rundungsfehler, keine grundlegende Veränderung.
733
34% PUMP MIT NULL LEVERAGE – DIE FALLE IST GESTELLT
$TFUEL
{spot}(TFUELUSDT)
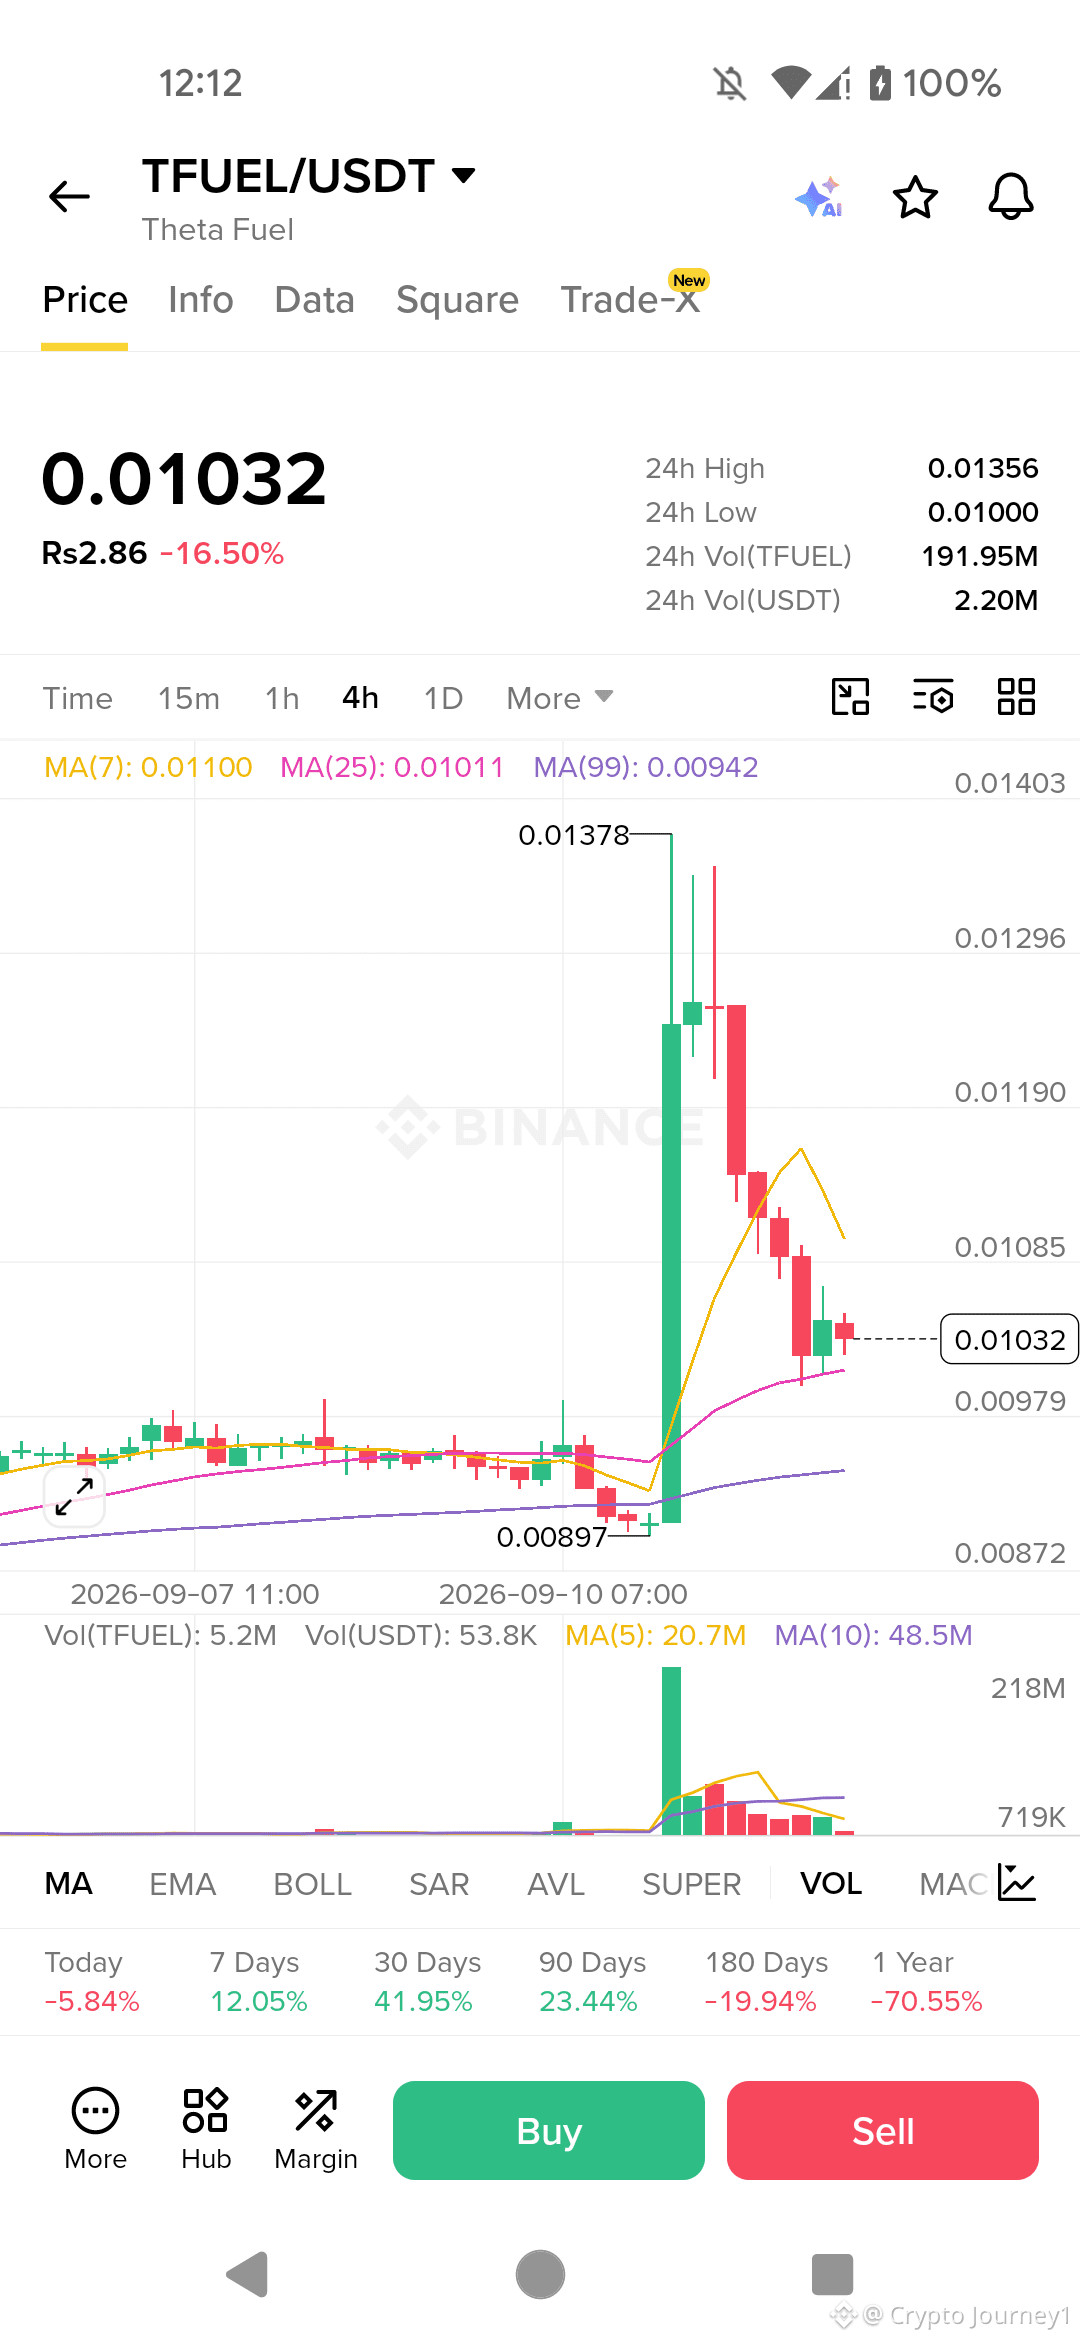
gerade von 0,0090 $ auf 0,01378 $ in Stunden „rausgerissen“. Jetzt bei 0,01262 $. Klassischer Low-Liquidity-Pump.
DIE GRUNDLAGEN (ECHT, ABER LANGSAM)
Theta Labs hat seine Roadmap für 2026 fallen lassen: Fokus auf dezentrale KI und GPU-Infrastruktur. Die EdgeCloud Inference Engine integriert jetzt den RapidAPI-Zugang. TDROP 2.0 kommt als Payment-Layer für KI-Agenten. Reale langfristige Chancen.
Aber hier ist der Haken. Nichts davon ist heute neu. Die Roadmap wurde im Januar veröffentlicht. Kein frischer Auslöser. Dieser Pump ist reine Marktrotation.
DIE TECHNIKS (ÜBERKAUFT UND DÜNN)
Der Preis ist über alle gleitenden Durchschnitte hinaus gedehnt. MA7 bei 0,01061 $. MA25 bei 0,00983 $. MA99 bei 0,00930 $. Überstreckt.
Widerstand: 0,01378 $ (24h-High). Bricht darüber hinaus und 0,015 $ wird möglich.
Unterstützung: 0,01205–0,01224 $ (erste Linie). Wenn das fällt, ist als Nächstes 0,00983 $ dran.
Das Volumen liegt bei 3,83 Mio. USDT. Dünn. Ein Whale kann das abladen.
DER DUNKLE TEIL (DAS IST DIE ECHTE STORY)
Der Funding-Rate ist negativ bei -0,0144 %. Shorts zahlen Longs. Das heißt: Kein leveraged Long treibt diese Bewegung. Open Interest ist nur 56.000 $. Winzig.
Das ist kein Short Squeeze. Das ist kein neues Geld. Das ist ein koordinierter Pump bei einem Token mit geringer Liquidität, während der breitere Markt blutet.
DER TRADE
Short-Einstieg: 0,01250 – 0,01320
Stop-Loss: 0,01420
Targets: 0,01061 → 0,00983 → 0,00930
Wenn TFUEL ausbricht und über 0,01378 $ hält – mit Volumen – ist der Short ungültig, nächstes Ziel 0,015. Wenn es unter 0,01205 $ fällt – bestätigte Trendwende.
DAS FAZIT
TFUEL hat legitime langfristige Fundamentals. Aber dieser Pump ist Fake. Negatives Funding. Winziges Open Interest. Kein neuer Auslöser. Der Markt blutet und TFUEL ist ein Rotation-Trade. Wenn die Rotation endet, beginnt der Dump.
34% PUMP MIT NULL LEVERAGE – DIE FALLE IST GESTELLT
$TFUEL
gerade von 0,0090 $ auf 0,01378 $ in Stunden „rausgerissen“. Jetzt bei 0,01262 $. Klassischer Low-Liquidity-Pump.
DIE GRUNDLAGEN (ECHT, ABER LANGSAM)
Theta Labs hat seine Roadmap für 2026 fallen lassen: Fokus auf dezentrale KI und GPU-Infrastruktur. Die EdgeCloud Inference Engine integriert jetzt den RapidAPI-Zugang. TDROP 2.0 kommt als Payment-Layer für KI-Agenten. Reale langfristige Chancen.
Aber hier ist der Haken. Nichts davon ist heute neu. Die Roadmap wurde im Januar veröffentlicht. Kein frischer Auslöser. Dieser Pump ist reine Marktrotation.
DIE TECHNIKS (ÜBERKAUFT UND DÜNN)
Der Preis ist über alle gleitenden Durchschnitte hinaus gedehnt. MA7 bei 0,01061 $. MA25 bei 0,00983 $. MA99 bei 0,00930 $. Überstreckt.
Widerstand: 0,01378 $ (24h-High). Bricht darüber hinaus und 0,015 $ wird möglich.
Unterstützung: 0,01205–0,01224 $ (erste Linie). Wenn das fällt, ist als Nächstes 0,00983 $ dran.
Das Volumen liegt bei 3,83 Mio. USDT. Dünn. Ein Whale kann das abladen.
DER DUNKLE TEIL (DAS IST DIE ECHTE STORY)
Der Funding-Rate ist negativ bei -0,0144 %. Shorts zahlen Longs. Das heißt: Kein leveraged Long treibt diese Bewegung. Open Interest ist nur 56.000 $. Winzig.
Das ist kein Short Squeeze. Das ist kein neues Geld. Das ist ein koordinierter Pump bei einem Token mit geringer Liquidität, während der breitere Markt blutet.
DER TRADE
Short-Einstieg: 0,01250 – 0,01320
Stop-Loss: 0,01420
Targets: 0,01061 → 0,00983 → 0,00930
Wenn TFUEL ausbricht und über 0,01378 $ hält – mit Volumen – ist der Short ungültig, nächstes Ziel 0,015. Wenn es unter 0,01205 $ fällt – bestätigte Trendwende.
DAS FAZIT
TFUEL hat legitime langfristige Fundamentals. Aber dieser Pump ist Fake. Negatives Funding. Winziges Open Interest. Kein neuer Auslöser. Der Markt blutet und TFUEL ist ein Rotation-Trade. Wenn die Rotation endet, beginnt der Dump.
$TFUEL
gerade von 0,0090 $ auf 0,01378 $ in Stunden „rausgerissen“. Jetzt bei 0,01262 $. Klassischer Low-Liquidity-Pump.
DIE GRUNDLAGEN (ECHT, ABER LANGSAM)
Theta Labs hat seine Roadmap für 2026 fallen lassen: Fokus auf dezentrale KI und GPU-Infrastruktur. Die EdgeCloud Inference Engine integriert jetzt den RapidAPI-Zugang. TDROP 2.0 kommt als Payment-Layer für KI-Agenten. Reale langfristige Chancen.
Aber hier ist der Haken. Nichts davon ist heute neu. Die Roadmap wurde im Januar veröffentlicht. Kein frischer Auslöser. Dieser Pump ist reine Marktrotation.
DIE TECHNIKS (ÜBERKAUFT UND DÜNN)
Der Preis ist über alle gleitenden Durchschnitte hinaus gedehnt. MA7 bei 0,01061 $. MA25 bei 0,00983 $. MA99 bei 0,00930 $. Überstreckt.
Widerstand: 0,01378 $ (24h-High). Bricht darüber hinaus und 0,015 $ wird möglich.
Unterstützung: 0,01205–0,01224 $ (erste Linie). Wenn das fällt, ist als Nächstes 0,00983 $ dran.
Das Volumen liegt bei 3,83 Mio. USDT. Dünn. Ein Whale kann das abladen.
DER DUNKLE TEIL (DAS IST DIE ECHTE STORY)
Der Funding-Rate ist negativ bei -0,0144 %. Shorts zahlen Longs. Das heißt: Kein leveraged Long treibt diese Bewegung. Open Interest ist nur 56.000 $. Winzig.
Das ist kein Short Squeeze. Das ist kein neues Geld. Das ist ein koordinierter Pump bei einem Token mit geringer Liquidität, während der breitere Markt blutet.
DER TRADE
Short-Einstieg: 0,01250 – 0,01320
Stop-Loss: 0,01420
Targets: 0,01061 → 0,00983 → 0,00930
Wenn TFUEL ausbricht und über 0,01378 $ hält – mit Volumen – ist der Short ungültig, nächstes Ziel 0,015. Wenn es unter 0,01205 $ fällt – bestätigte Trendwende.
DAS FAZIT
TFUEL hat legitime langfristige Fundamentals. Aber dieser Pump ist Fake. Negatives Funding. Winziges Open Interest. Kein neuer Auslöser. Der Markt blutet und TFUEL ist ein Rotation-Trade. Wenn die Rotation endet, beginnt der Dump.
248

Artikel
DIE SHORT SQUEEZE IST VORBEI — DER FALL HAT SOEBEN BEGONNEN$VTHO Token hat gerade eine der heftigsten Short-Squizes des Septembers 2026 erlebt. Der Kurs schoss in wenigen Stunden um 117% von $0.00039 auf $0.000924, liquidierte $4.18 Millionen in Shorts, und das Handelsvolumen erreichte $717.95 Millionen — über das 11-Fache seiner gesamten Marktkapitalisierung. Jetzt liegt er bei $0.000575, am Tag um 9.59% gefallen. Die Squeeze ist tot. Die Frage ist, wie tief der Rücksetzer geht.
---
DER ECHTE KATALYSATOR (UND WARUM VTHO IHN NICHT BESITZT)
Die tatsächliche Nachricht, die das VeChain-Ökosystem antreibt, ist das InterStellar-Upgrade (VIP-255), das für den 16. September 2026 geplant ist. Dieses Upgrade verbessert die EVM-Kompatibilität und Entwickler-Tools — ein echter Katalysator für VET, den Wert-Token.
DIE SHORT SQUEEZE IST VORBEI — DER FALL HAT SOEBEN BEGONNEN
$VTHO Token hat gerade eine der heftigsten Short-Squizes des Septembers 2026 erlebt. Der Kurs schoss in wenigen Stunden um 117% von $0.00039 auf $0.000924, liquidierte $4.18 Millionen in Shorts, und das Handelsvolumen erreichte $717.95 Millionen — über das 11-Fache seiner gesamten Marktkapitalisierung. Jetzt liegt er bei $0.000575, am Tag um 9.59% gefallen. Die Squeeze ist tot. Die Frage ist, wie tief der Rücksetzer geht.
---
DER ECHTE KATALYSATOR (UND WARUM VTHO IHN NICHT BESITZT)
Die tatsächliche Nachricht, die das VeChain-Ökosystem antreibt, ist das InterStellar-Upgrade (VIP-255), das für den 16. September 2026 geplant ist. Dieses Upgrade verbessert die EVM-Kompatibilität und Entwickler-Tools — ein echter Katalysator für VET, den Wert-Token.
---
DER ECHTE KATALYSATOR (UND WARUM VTHO IHN NICHT BESITZT)
Die tatsächliche Nachricht, die das VeChain-Ökosystem antreibt, ist das InterStellar-Upgrade (VIP-255), das für den 16. September 2026 geplant ist. Dieses Upgrade verbessert die EVM-Kompatibilität und Entwickler-Tools — ein echter Katalysator für VET, den Wert-Token.
1
281

Artikel
DIE 154%-RALLYE, DIE UM IHR ÜBERLEBEN KÄMPFT$PROM ist gerade exponentiell explodiert, hat in 30 Tagen 154% auf ein Hoch von 6,262 $ gerissen. Jetzt wird es niedergeschlagen, -10,19% auf 5,094 $. Die Frage ist ganz einfach — ist das ein gesunder Rücksetzer oder der Beginn einer ausgewachsenen Trendwende?
---
DER KATALYSATOR: DIE ZK-ROLLUP-ERZÄHLUNG IST REAL
PROM ist kein Meme. Es ist ein leistungsstarkes ZK-Netzwerk, das auf Polygon's Chain Development Kit (CDK) basiert und theoretisch bis zu 40.000 Transaktionen pro Sekunde unterstützen kann. Die ZK-Rollup-Erzählung kommt nach einem Jahr Seitwärtsbewegung wieder in Fahrt, und PROM ist der Aushängeschild dieser Wiederbelebung.
DIE 154%-RALLYE, DIE UM IHR ÜBERLEBEN KÄMPFT
$PROM ist gerade exponentiell explodiert, hat in 30 Tagen 154% auf ein Hoch von 6,262 $ gerissen. Jetzt wird es niedergeschlagen, -10,19% auf 5,094 $. Die Frage ist ganz einfach — ist das ein gesunder Rücksetzer oder der Beginn einer ausgewachsenen Trendwende?
---
DER KATALYSATOR: DIE ZK-ROLLUP-ERZÄHLUNG IST REAL
PROM ist kein Meme. Es ist ein leistungsstarkes ZK-Netzwerk, das auf Polygon's Chain Development Kit (CDK) basiert und theoretisch bis zu 40.000 Transaktionen pro Sekunde unterstützen kann. Die ZK-Rollup-Erzählung kommt nach einem Jahr Seitwärtsbewegung wieder in Fahrt, und PROM ist der Aushängeschild dieser Wiederbelebung.
---
DER KATALYSATOR: DIE ZK-ROLLUP-ERZÄHLUNG IST REAL
PROM ist kein Meme. Es ist ein leistungsstarkes ZK-Netzwerk, das auf Polygon's Chain Development Kit (CDK) basiert und theoretisch bis zu 40.000 Transaktionen pro Sekunde unterstützen kann. Die ZK-Rollup-Erzählung kommt nach einem Jahr Seitwärtsbewegung wieder in Fahrt, und PROM ist der Aushängeschild dieser Wiederbelebung.
1
1
486

Artikel
SUPERNOVA- AUSLÖSER TRIFFT ÜBERKAUFTE REALITÄT – EIN KLASSISCHER „BUY THE RUMOR, SELL THE NEWS“-TRADE$EGLD MultiversX hat am 10. September die Supernova-Hardfork aktiviert und senkt die Blockzeiten von 6 Sekunden auf 600 Millisekunden—ein 10-facher Geschwindigkeitsschub, der seit Monaten vorbereitet wird. Der Markt griff hart vor und pumpte den EGLD in einer Woche um 55% auf ein Allzeithoch von 5,778 $. Jetzt liegt er bei 4,501 $, 9,98% im Tagesminus. Der Auslöser ist geliefert. Die Frage ist: Was kommt als Nächstes?
---
DER SUPERNOVA-AUSLÖSER IST REAL
Supernova entkoppelt den Konsens von der Ausführung und ermöglicht erstmals eine Finalität von unter einer Sekunde. Die Mainnet-Aktivierung ging am 10. September um 17:45 UTC live, nachdem die erfolgreichen Rollouts auf Devnet und Testnet abgeschlossen waren. Für EGLD-Inhaber mit Selbstverwahrung war keine Aktion erforderlich—Adressen, Keys und Guthaben blieben vollständig kompatibel, ohne Token-Swap oder Migration. Das Netzwerk wurde während des Upgrades für ungefähr 24 Minuten angehalten, und Börsen wie Bybit setzten vorübergehend Ein- und Auszahlungen aus, um einen reibungslosen Übergang zu gewährleisten.
SUPERNOVA- AUSLÖSER TRIFFT ÜBERKAUFTE REALITÄT – EIN KLASSISCHER „BUY THE RUMOR, SELL THE NEWS“-TRADE
$EGLD MultiversX hat am 10. September die Supernova-Hardfork aktiviert und senkt die Blockzeiten von 6 Sekunden auf 600 Millisekunden—ein 10-facher Geschwindigkeitsschub, der seit Monaten vorbereitet wird. Der Markt griff hart vor und pumpte den EGLD in einer Woche um 55% auf ein Allzeithoch von 5,778 $. Jetzt liegt er bei 4,501 $, 9,98% im Tagesminus. Der Auslöser ist geliefert. Die Frage ist: Was kommt als Nächstes?
---
DER SUPERNOVA-AUSLÖSER IST REAL
Supernova entkoppelt den Konsens von der Ausführung und ermöglicht erstmals eine Finalität von unter einer Sekunde. Die Mainnet-Aktivierung ging am 10. September um 17:45 UTC live, nachdem die erfolgreichen Rollouts auf Devnet und Testnet abgeschlossen waren. Für EGLD-Inhaber mit Selbstverwahrung war keine Aktion erforderlich—Adressen, Keys und Guthaben blieben vollständig kompatibel, ohne Token-Swap oder Migration. Das Netzwerk wurde während des Upgrades für ungefähr 24 Minuten angehalten, und Börsen wie Bybit setzten vorübergehend Ein- und Auszahlungen aus, um einen reibungslosen Übergang zu gewährleisten.
---
DER SUPERNOVA-AUSLÖSER IST REAL
Supernova entkoppelt den Konsens von der Ausführung und ermöglicht erstmals eine Finalität von unter einer Sekunde. Die Mainnet-Aktivierung ging am 10. September um 17:45 UTC live, nachdem die erfolgreichen Rollouts auf Devnet und Testnet abgeschlossen waren. Für EGLD-Inhaber mit Selbstverwahrung war keine Aktion erforderlich—Adressen, Keys und Guthaben blieben vollständig kompatibel, ohne Token-Swap oder Migration. Das Netzwerk wurde während des Upgrades für ungefähr 24 Minuten angehalten, und Börsen wie Bybit setzten vorübergehend Ein- und Auszahlungen aus, um einen reibungslosen Übergang zu gewährleisten.
1
365

Artikel
DAS NACHBEBEN DES SHORT SQUEEZE – TOT ODER ÜBERVERKAUFT?$IOST gerade erst eine der heftigsten Short-Squeezes von 2026 durchgemacht, mit einem Anstieg von 117,6% auf 0,002448 $ – bevor er um 61% auf 0,000932 $ einbrach. Die Bewegung wurde ausschließlich von Derivaten getrieben, nicht organisch.
---
DER KURZE QUETSCH, DER SHORTS BRECHTE
Am 8. September führte die IOST Foundation einen Burn von 70 Millionen Token aus der frühen ERC-20-Emission durch und entfernte sie dauerhaft aus dem Umlauf. Dieser Burn löste eine heftige Kettenreaktion aus.
Händler hatten massive Short-Positionen aufgebaut und den Funding-Satz auf -1,1059% gedrückt – etwa 37-mal über dem üblichen negativen Schwellenwert. Als der Preis zu steigen begann, waren diese Shorts gezwungen, sich einzudecken, wodurch eine sich selbst verstärkende Kettenreaktion entstand, die den Preis von 0,0005 $ auf 0,002448 $ trieb.
DAS NACHBEBEN DES SHORT SQUEEZE – TOT ODER ÜBERVERKAUFT?
$IOST gerade erst eine der heftigsten Short-Squeezes von 2026 durchgemacht, mit einem Anstieg von 117,6% auf 0,002448 $ – bevor er um 61% auf 0,000932 $ einbrach. Die Bewegung wurde ausschließlich von Derivaten getrieben, nicht organisch.
---
DER KURZE QUETSCH, DER SHORTS BRECHTE
Am 8. September führte die IOST Foundation einen Burn von 70 Millionen Token aus der frühen ERC-20-Emission durch und entfernte sie dauerhaft aus dem Umlauf. Dieser Burn löste eine heftige Kettenreaktion aus.
Händler hatten massive Short-Positionen aufgebaut und den Funding-Satz auf -1,1059% gedrückt – etwa 37-mal über dem üblichen negativen Schwellenwert. Als der Preis zu steigen begann, waren diese Shorts gezwungen, sich einzudecken, wodurch eine sich selbst verstärkende Kettenreaktion entstand, die den Preis von 0,0005 $ auf 0,002448 $ trieb.
---
DER KURZE QUETSCH, DER SHORTS BRECHTE
Am 8. September führte die IOST Foundation einen Burn von 70 Millionen Token aus der frühen ERC-20-Emission durch und entfernte sie dauerhaft aus dem Umlauf. Dieser Burn löste eine heftige Kettenreaktion aus.
Händler hatten massive Short-Positionen aufgebaut und den Funding-Satz auf -1,1059% gedrückt – etwa 37-mal über dem üblichen negativen Schwellenwert. Als der Preis zu steigen begann, waren diese Shorts gezwungen, sich einzudecken, wodurch eine sich selbst verstärkende Kettenreaktion entstand, die den Preis von 0,0005 $ auf 0,002448 $ trieb.
1
477

Artikel
FUNDAMENTALE UND ÖKOSYSTEM-KAPITALAUSRICHTUNG – AUF $0,31 AUSGERICHTET$MET ripped von einem $0.1815-Tief zu einem $0.2500-Hoch, jetzt bei **$0.2436** im Handel, **+16,56%** in 24 Stunden, mit **$4,30 Mio. USDT** im Volumen. Das ist kein kurzfristiges Sentiment. Das DBC-Tool-Upgrade unterstützt nun RWA und die Emission tokenisierter Aktien und erweitert Metoras Liquiditätsprotokoll auf Real-World-Assets.
ON-CHAIN-DATEN UNTERSTÜTZEN DEN WECHSEL
Metoras TVL ist in 23 Tagen um **$55,53 Mio.** explodiert, wobei die täglichen Gebühreneinnahmen nun Jupiter und Sanctum zusammen übertreffen. Die Funding-Rate liegt bei **+0,0059%** — positiv, aber nicht überhitzt, was bedeutet, dass das Liquidationsrisiko niedrig ist. Die annualisierten Einnahmen nähern sich **$39 Mio.** und bieten damit eine solide fundamentale Grundlage. Das DBC-Tool-Upgrade ist der entscheidende Katalysator. Die Story ist offen — entscheidend ist jetzt, ob die Nachfrage aus echter Emission und das Gebührenwachstum das langfristig tragen können.
FUNDAMENTALE UND ÖKOSYSTEM-KAPITALAUSRICHTUNG – AUF $0,31 AUSGERICHTET
$MET ripped von einem $0.1815-Tief zu einem $0.2500-Hoch, jetzt bei **$0.2436** im Handel, **+16,56%** in 24 Stunden, mit **$4,30 Mio. USDT** im Volumen. Das ist kein kurzfristiges Sentiment. Das DBC-Tool-Upgrade unterstützt nun RWA und die Emission tokenisierter Aktien und erweitert Metoras Liquiditätsprotokoll auf Real-World-Assets.
ON-CHAIN-DATEN UNTERSTÜTZEN DEN WECHSEL
Metoras TVL ist in 23 Tagen um **$55,53 Mio.** explodiert, wobei die täglichen Gebühreneinnahmen nun Jupiter und Sanctum zusammen übertreffen. Die Funding-Rate liegt bei **+0,0059%** — positiv, aber nicht überhitzt, was bedeutet, dass das Liquidationsrisiko niedrig ist. Die annualisierten Einnahmen nähern sich **$39 Mio.** und bieten damit eine solide fundamentale Grundlage. Das DBC-Tool-Upgrade ist der entscheidende Katalysator. Die Story ist offen — entscheidend ist jetzt, ob die Nachfrage aus echter Emission und das Gebührenwachstum das langfristig tragen können.
ON-CHAIN-DATEN UNTERSTÜTZEN DEN WECHSEL
Metoras TVL ist in 23 Tagen um **$55,53 Mio.** explodiert, wobei die täglichen Gebühreneinnahmen nun Jupiter und Sanctum zusammen übertreffen. Die Funding-Rate liegt bei **+0,0059%** — positiv, aber nicht überhitzt, was bedeutet, dass das Liquidationsrisiko niedrig ist. Die annualisierten Einnahmen nähern sich **$39 Mio.** und bieten damit eine solide fundamentale Grundlage. Das DBC-Tool-Upgrade ist der entscheidende Katalysator. Die Story ist offen — entscheidend ist jetzt, ob die Nachfrage aus echter Emission und das Gebührenwachstum das langfristig tragen können.
423

Artikel
MARSCOIN/USDT: Vom Absturz bei 0,2675 US-Dollar zum Tief bei 0,0979$MARSCOIN Jetzt erholt sich der Kurs um +26,76% auf 0,1317 — Dead-Cat-Bounce oder Trendwende?
MarsCoin ist um 63,4% von seinem Allzeithoch von 0,2675 US-Dollar auf ein Tief von 0,0979 US-Dollar abgestürzt. Heute prallte der Kurs hart aus der 0,0980-Region nach oben und wird nun bei 0,1317 US-Dollar gehandelt, +26,76% in 24 Stunden. Der entscheidende Kampfplatz ist 0,1290 — halte ihn, dann geht die Erholung weiter; verliere ihn, und 0,0980 kommt wieder ins Spiel.
---
DIE BINANCE-LISTUNG IST EIN ECHTER KATALYSATOR
Am 4. September 2026 hat Binance offiziell den Spot-Handel für MARSCOIN/USDT, MARSCOIN/USDC und MARSCOIN/TRY mit einer Null-Listing-Gebühr und dem Seed-Tag eröffnet. Dies war Binances erste Spot-Listing für eine Meme Coin in fast einem Jahr, und der Kurs schoss bei der Ankündigung sofort um 80% in die Höhe.
MARSCOIN/USDT: Vom Absturz bei 0,2675 US-Dollar zum Tief bei 0,0979
$MARSCOIN Jetzt erholt sich der Kurs um +26,76% auf 0,1317 — Dead-Cat-Bounce oder Trendwende?
MarsCoin ist um 63,4% von seinem Allzeithoch von 0,2675 US-Dollar auf ein Tief von 0,0979 US-Dollar abgestürzt. Heute prallte der Kurs hart aus der 0,0980-Region nach oben und wird nun bei 0,1317 US-Dollar gehandelt, +26,76% in 24 Stunden. Der entscheidende Kampfplatz ist 0,1290 — halte ihn, dann geht die Erholung weiter; verliere ihn, und 0,0980 kommt wieder ins Spiel.
---
DIE BINANCE-LISTUNG IST EIN ECHTER KATALYSATOR
Am 4. September 2026 hat Binance offiziell den Spot-Handel für MARSCOIN/USDT, MARSCOIN/USDC und MARSCOIN/TRY mit einer Null-Listing-Gebühr und dem Seed-Tag eröffnet. Dies war Binances erste Spot-Listing für eine Meme Coin in fast einem Jahr, und der Kurs schoss bei der Ankündigung sofort um 80% in die Höhe.
MarsCoin ist um 63,4% von seinem Allzeithoch von 0,2675 US-Dollar auf ein Tief von 0,0979 US-Dollar abgestürzt. Heute prallte der Kurs hart aus der 0,0980-Region nach oben und wird nun bei 0,1317 US-Dollar gehandelt, +26,76% in 24 Stunden. Der entscheidende Kampfplatz ist 0,1290 — halte ihn, dann geht die Erholung weiter; verliere ihn, und 0,0980 kommt wieder ins Spiel.
---
DIE BINANCE-LISTUNG IST EIN ECHTER KATALYSATOR
Am 4. September 2026 hat Binance offiziell den Spot-Handel für MARSCOIN/USDT, MARSCOIN/USDC und MARSCOIN/TRY mit einer Null-Listing-Gebühr und dem Seed-Tag eröffnet. Dies war Binances erste Spot-Listing für eine Meme Coin in fast einem Jahr, und der Kurs schoss bei der Ankündigung sofort um 80% in die Höhe.
465
Anmelden und weiter Inhalte entdecken
Krypto-Nutzer weltweit auf Binance Square kennenlernen
⚡️ Bleib in Sachen Krypto stets am Puls.
💬 Die weltgrößte Kryptobörse vertraut darauf.
👍 Erhalte verlässliche Einblicke von verifizierten Creators.
E-Mail-Adresse/Telefonnummer
Trendthemen
BOJHikesRatesTo31YearHigh
310 Aufrufe
37 Kommentare
BOJ erhöht Zinsen auf 31-Jahres-Hoch
Artikeltext
Die Bank of Japan (BOJ) hat den Leitzins angehoben
anwarali0
·0 Likes
·4 Aufrufe
ChainlinkPowersBottomlinePaymentPlatform
4,326 Aufrufe
143 Kommentare
StellarActivatesProtocol28At211TPS
12,847 Aufrufe
324 Kommentare