

Ghoststroke
1.8k Beiträge

Ghoststroke
Melden
Nutzer blockieren
I only post logical information. Do not expect any trading signals for losing your own money.
20 Following
71 Follower
394 Like gegeben
Beiträge
Alle
Zitierungen
PINNED
·
--
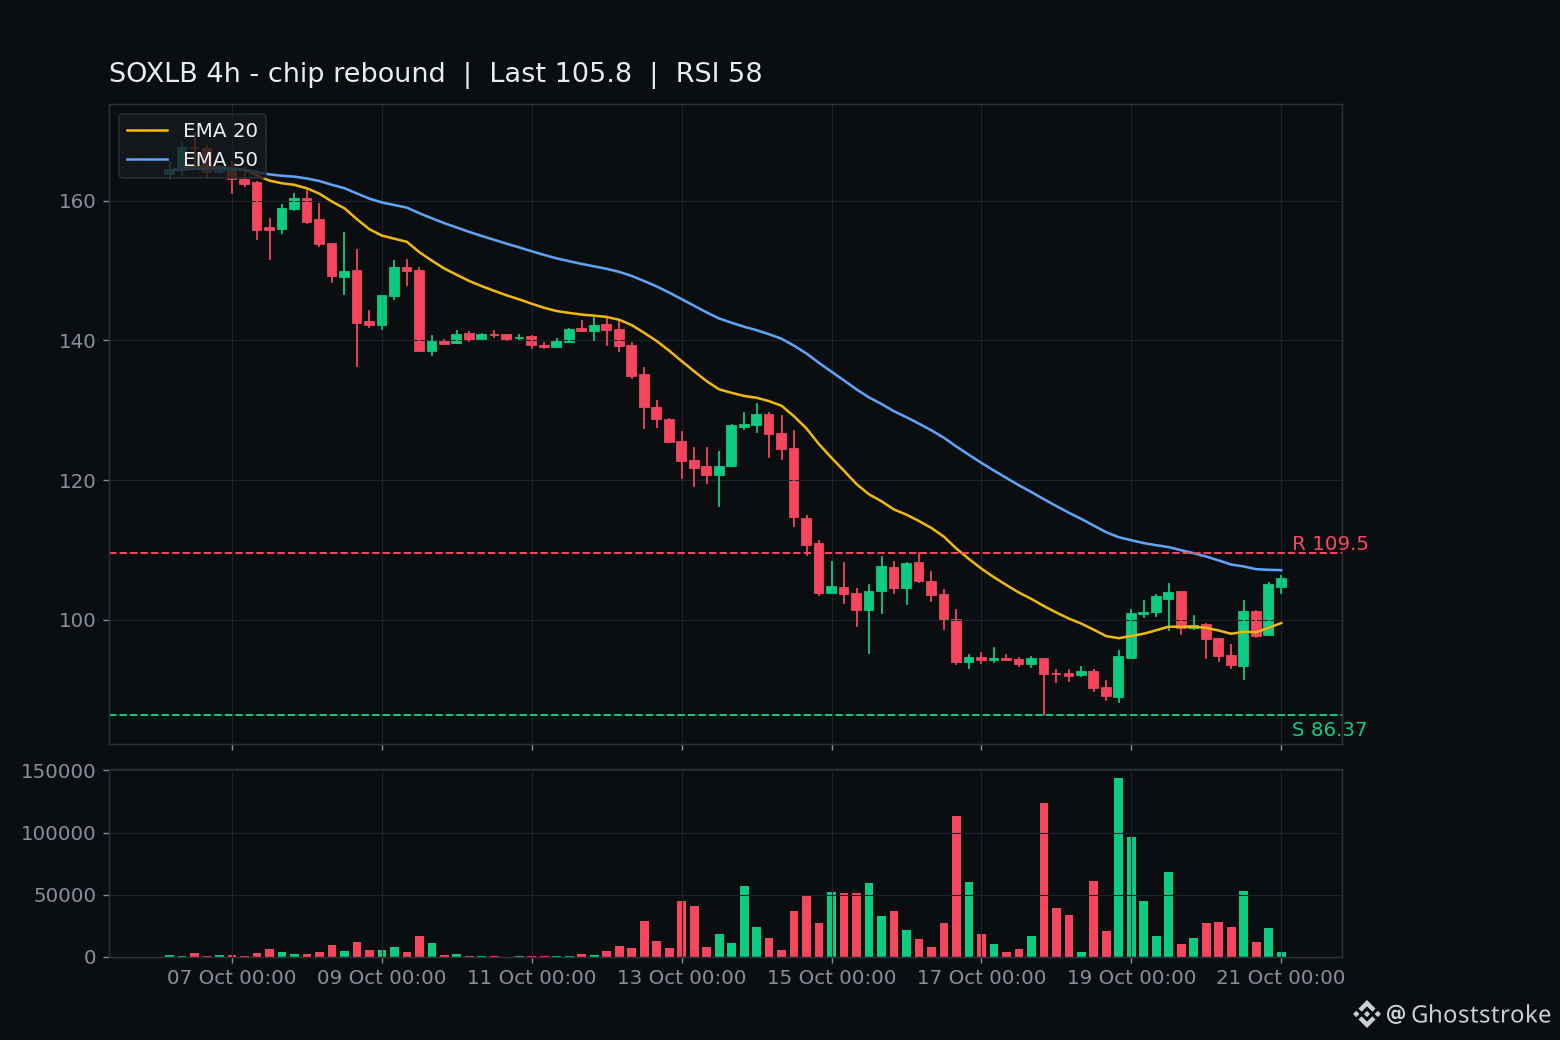
SOXL legte nach Börsenschluss gerade um +7,4 % zu. Die tokenisierte Version $SOXLB liegt auf Binance bereits bei +9,9 % und $106.2, während die Wall Street schläft.
Der Auslöser: SpaceX hat gerade ein starkes Q3-Ergebnis vorgelegt — $14.6B Umsatz (+161 % im Jahresvergleich) gegenüber erwarteten ~$12.7B, KI-Umsatz um 830 % auf $7.56B gestiegen, Investitionsausgaben von $19.6B und Musk spricht von $500B–$1T ARR bis Ende 2027. SMCI hob seine Prognose an und legte nach Börsenschluss um +10,9 % zu. Der Philadelphia Semiconductor Index beendete endlich seine acht Tage andauernde Verlustserie.
Die ehrliche Einordnung: SOXL liegt innerhalb eines Monats immer noch 31 % im Minus. Hedgefonds reduzierten letzte Woche ihre Tech-Positionen so schnell wie seit 2016 nicht mehr — obwohl zugleich $7B in SOXL flossen. Das ist eine Erholungsrallye nach dem Tief bei $86, keine bestätigte Trendwende — und SOXL ist ein täglich gehebeltes 3x-Produkt, das bei Seitwärtsbewegungen an Wert verliert.
Doch genau das hat Krypto Aktien voraus: $SOXLB wird rund um die Uhr gehandelt. Binance bewertete die Erholung bei Chipaktien Stunden vor dem Eröffnungsgong. Der Chart zeigt den tatsächlichen 4-Stunden-Kurs — der nächste Widerstand liegt bei $109.5.
Kommt die tokenisierte Version dem Handelsstart an der NYSE zuvor oder gibt sie ihre Gewinne wieder ab? #EarningsSeason
4
67
·
--
Übersetzung ansehen
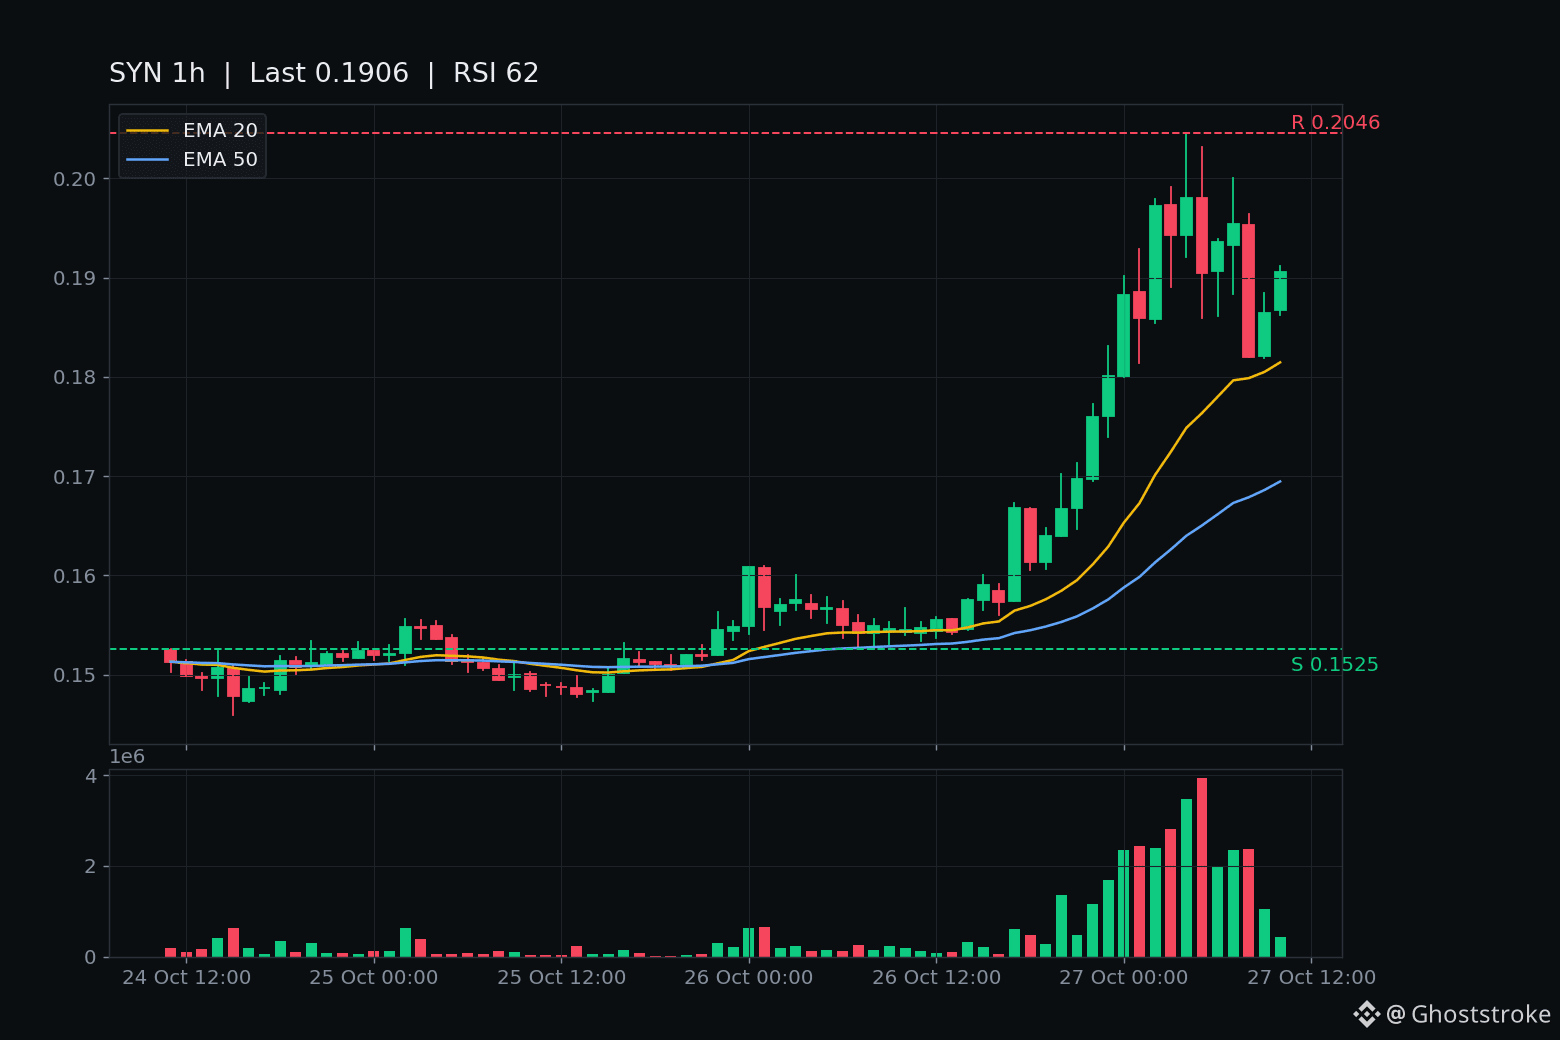
$SYN just failed its extension again — and this time it went through the floor underneath it too.
The setup from this morning's post: $SYN closed $0.19719 above the $0.19291 ceiling, the extension. It stalled, dipped to $0.19048, reclaimed the line, then pressed $0.19535. That was the second chance.
The 08:00 UTC hour took it away. Open $0.19527, low $0.18196, close $0.18202 on $452k — down 6.8% in one hour, and the close sits below BOTH the $0.19291 line and the $0.1883 stall level. The 09:00 close, $0.18645, is still below the line, so this is a confirmed fail, not a wick.
One honest cushion: the fail bar's low tagged the 1h EMA20 almost exactly ($0.18196 vs $0.1815) and held it on the close. RSI has cooled from 83 at the extension to 62 — hot air out, not washed out.
The forming 10:00 hour is around $0.1906, still below $0.19291 intraday and unclosed. Its 11:00 UTC close is the next verdict, not a level yet.
Numbers, re-pulled live: $SYN around $0.1906, still +23% on the 24h window — but that is yesterday's leg still inside the window, not today's strength. CoinGecko: rank #514, market cap $41.6M, global volume $25.0M a day (about 0.6x the market cap), 219.1M of 250M circulating, 96.1% below the $4.92 all-time high. Genuinely small. No verified fresh catalyst — quote pages and a two-day-old outlook note only. Pure flow.
Levels: $0.19291 back above on a close means the failure fails again, then $0.19917, then $0.20455. Below, $0.18196 / EMA20 $0.1815 is the line — a close under it means the give-back is deepening — then $0.1800, then the $0.154–$0.155 base if the whole leg unwinds.
Not a call, either way. A coin that has whipsawed across the same $0.19291 line three times today can do it a fourth — but this fail went deeper than the last one, and it took the stall with it.
$0.19291 retaken a third time, or $0.1815 gives way and the extension fully unwinds?
·
--
Übersetzung ansehen
$OSMO just gave the resurrection back — $0.0544 closed under the $0.0560 line, two hours after the leg peaked at $0.0672.
The tape: after the morning climb ($0.0519, then $0.0567, then $0.0600 on the 03:00–05:00 UTC hours), the 06:00 hour spiked to a fresh $0.0672 high and closed $0.0629 on $1.20M — the heaviest hour of the whole leg, and a rejection wick, not a breakout. Then the 07:00 hour opened $0.0630, slid to $0.0528, and closed $0.0544 on $659k. That is the first close back below $0.0560 since the resurrection, -13.7% open-to-close and -19% off the spike high.
One hairline to be honest about: the close held the $0.0542 give-back line by $0.0002. The low dipped under it intraday, but the close did not. So this is a failed resurrection, not yet a deepening give-back — that distinction is the next verdict.
The numbers around it: live about $0.0558, still +4.3% on the 24h print, but that print holds this morning's leg in its window — against the last post's $0.0636 live, this is about -12%. CoinGecko has it at rank #517 with a $41.3M market cap, genuinely micro, and $22.4M global volume is about half the cap changing hands in a day. The 1h chart has cooled to RSI 55 from 84, still above EMA20 $0.0530 and EMA50 $0.0510 — cooling, not washed out. The backdrop stands: proposal 1053 passed with about 91% yes, ending new OSMO issuance. That is a confirmed fact, not a claim that it caused this red hour.
Levels from here: $0.0672 is the ceiling to retake, $0.0560 the line to win back, $0.0542 the give-back line, then $0.0500, then $0.0488 for the full round-trip. The forming 08:00 hour is still under $0.0560 intraday and unclosed — its 09:00 UTC close is the next verdict, not a level yet.
Not a call, either way. A coin that already faked out once this week at $0.0560 just did it again, higher and harder.
Does $0.0560 get retaken, or does $0.0542 break and $0.0500 come next?
1
·
--
Übersetzung ansehen
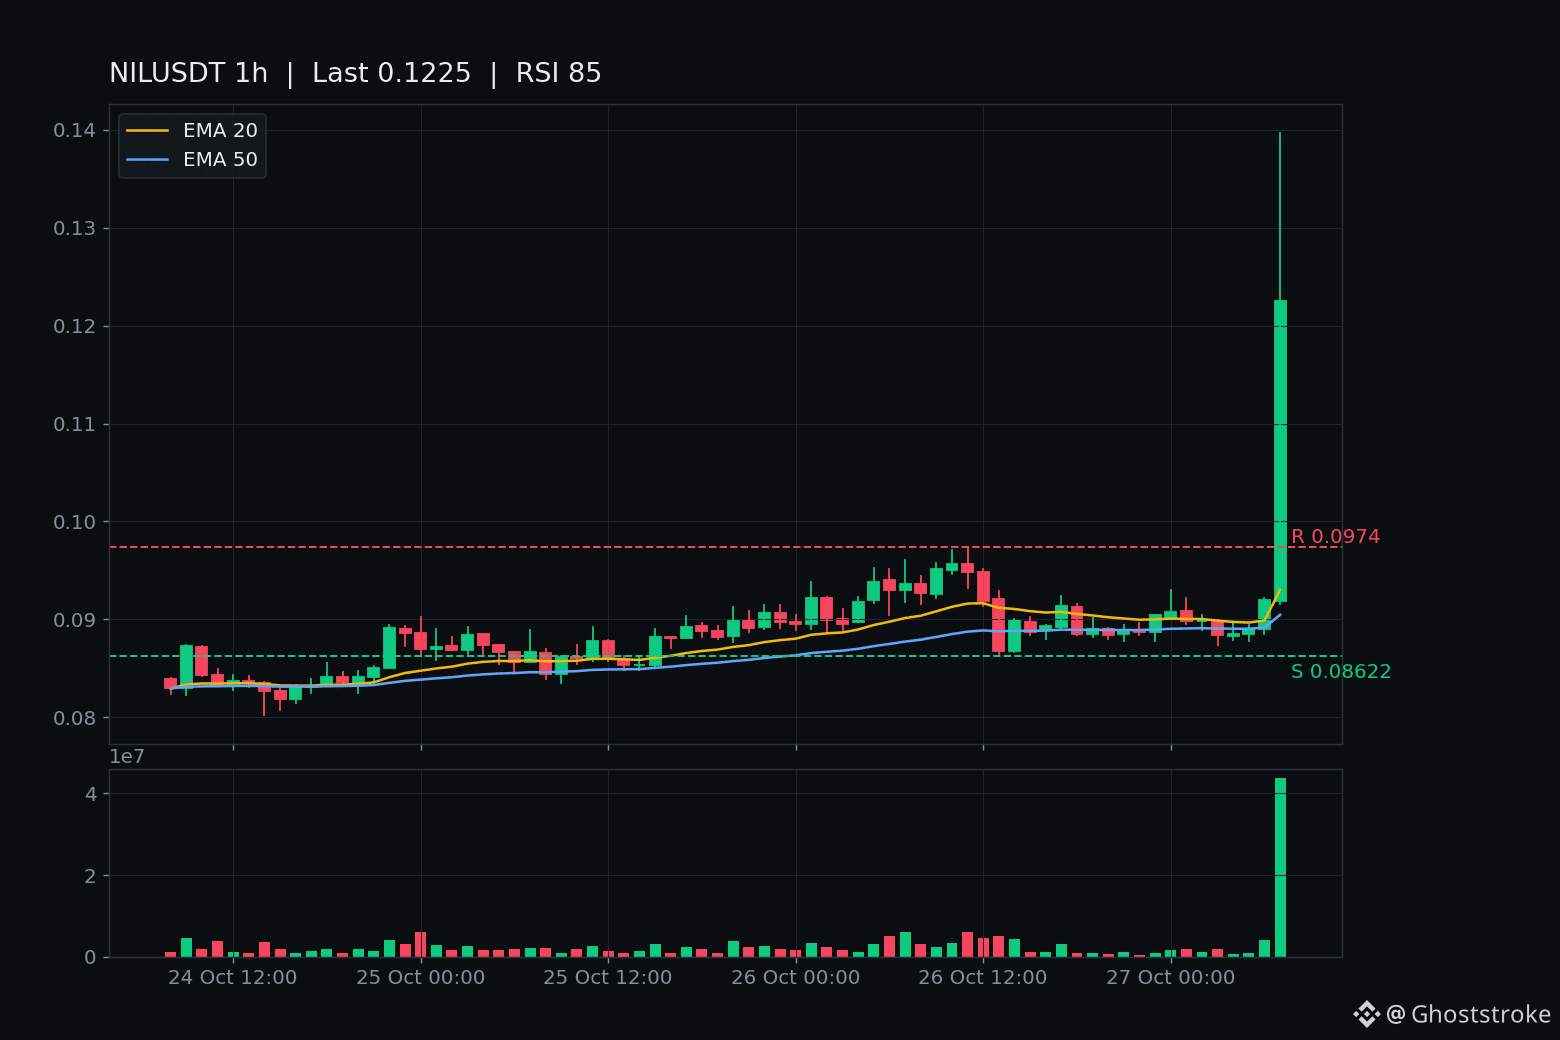
$NIL just did its whole week in one hour — and it is already giving some of it back.
The tape: $NIL sat dead flat around $0.089 all morning. Then the 12:30 IST hour opened at $0.09187, spiked to $0.13968 — up 52% inside a single hour — on $4.1M of volume. The hours before it were doing $40k to $376k. That is not a grind, that is a detonation: over 47,000 trades in one hour.
And the give-back started inside the same hour. It is trading around $0.122 now, already about 13% below the $0.13968 spike, still up about 29% on the day on $10.3M of Binance volume.
Size check, honestly: Nillion is small but not tiny. CoinGecko still shows roughly $49M market cap and rank near 450 — its snapshot lags the blast at about $0.096 — on 513M tokens circulating, still about 89% below its $0.897 all-time high from March 2025. At RSI 85 on the hour, roughly 32% above its 1h EMA20 of $0.093, this is stretched by any measure.
No verified fresh headline behind the hour that I can find. The recent background is the October 15 plan to wind down its L2 and an October 24 unlock, both days old. So this reads as pure flow, not a news break. Treat it that way.
Levels that matter now: $0.13968 is the spike to beat — an hourly close above it and the blast has a second leg. Below, $0.09187 is the blast's open — an hourly close back under it and the whole hour unwound. Between them is just air.
Not a call, either way. Coins that rip 52% in an hour hand back 15% in the next one without blinking.
Did you catch this one live, or did the spike find you after it was already over?
4
·
--
Übersetzung ansehen
$BMT just gave back the low it retook — $0.02843 closed below $0.02885, then $0.02810 confirmed it.
The last chapter was the retake, post 249: $0.02959 closed above the low, $0.02999 backed it up, $0.02954 held it. The retake then tried to extend — 02:00 UTC closed $0.03026 above the $0.03015 resistance — and died in one hour: 03:00 UTC $0.02944, 04:00 UTC $0.02940, back below the resistance but above the low. This morning finished it: 05:00 UTC closed $0.02843 on $330k, first close under $0.02885, and 06:00 UTC closed $0.02810 on $447k, confirming below it. The 06:00 low was $0.02776, just $0.00004 above the deeper-air line at $0.02772 — held on the close, barely. The forming 07:00 hour is still below the line at about $0.02824, but unclosed — its 08:00 UTC close is the next verdict. Live about $0.02825, Binance volume $11.3M.
Size check: CoinGecko rank #797, market cap $21.2M — genuinely micro. Global volume $32.2M, about 1.5x market cap a day, 755.4M of 1B circulating, still 91.1% below its $0.3173 all-time high. The -16.9% 24h print is window arithmetic — the window still holds the Oct 26 $0.039 blast high. Against post 249's live $0.02968, this is about -4.8%.
Chart check: 1h RSI 41, under EMA20 $0.02933 and EMA50 $0.03113 — cooling, not washed out. No fresh catalyst I can verify — the Oct 24 Upbit listing is three days old, the rest is quote pages. Pure flow.
Levels: $0.02885 back above on a close and this failure fails. Below, $0.02772 is deeper air with no recent shelf, then the $0.02340 base. Above the line, $0.03015, then $0.03168.
Not a call, either way. This coin has retaken and lost its own lines all week.
Does $0.02885 get retaken again, or does $0.02772 break and leave only air below?
3
·
--
Übersetzung ansehen
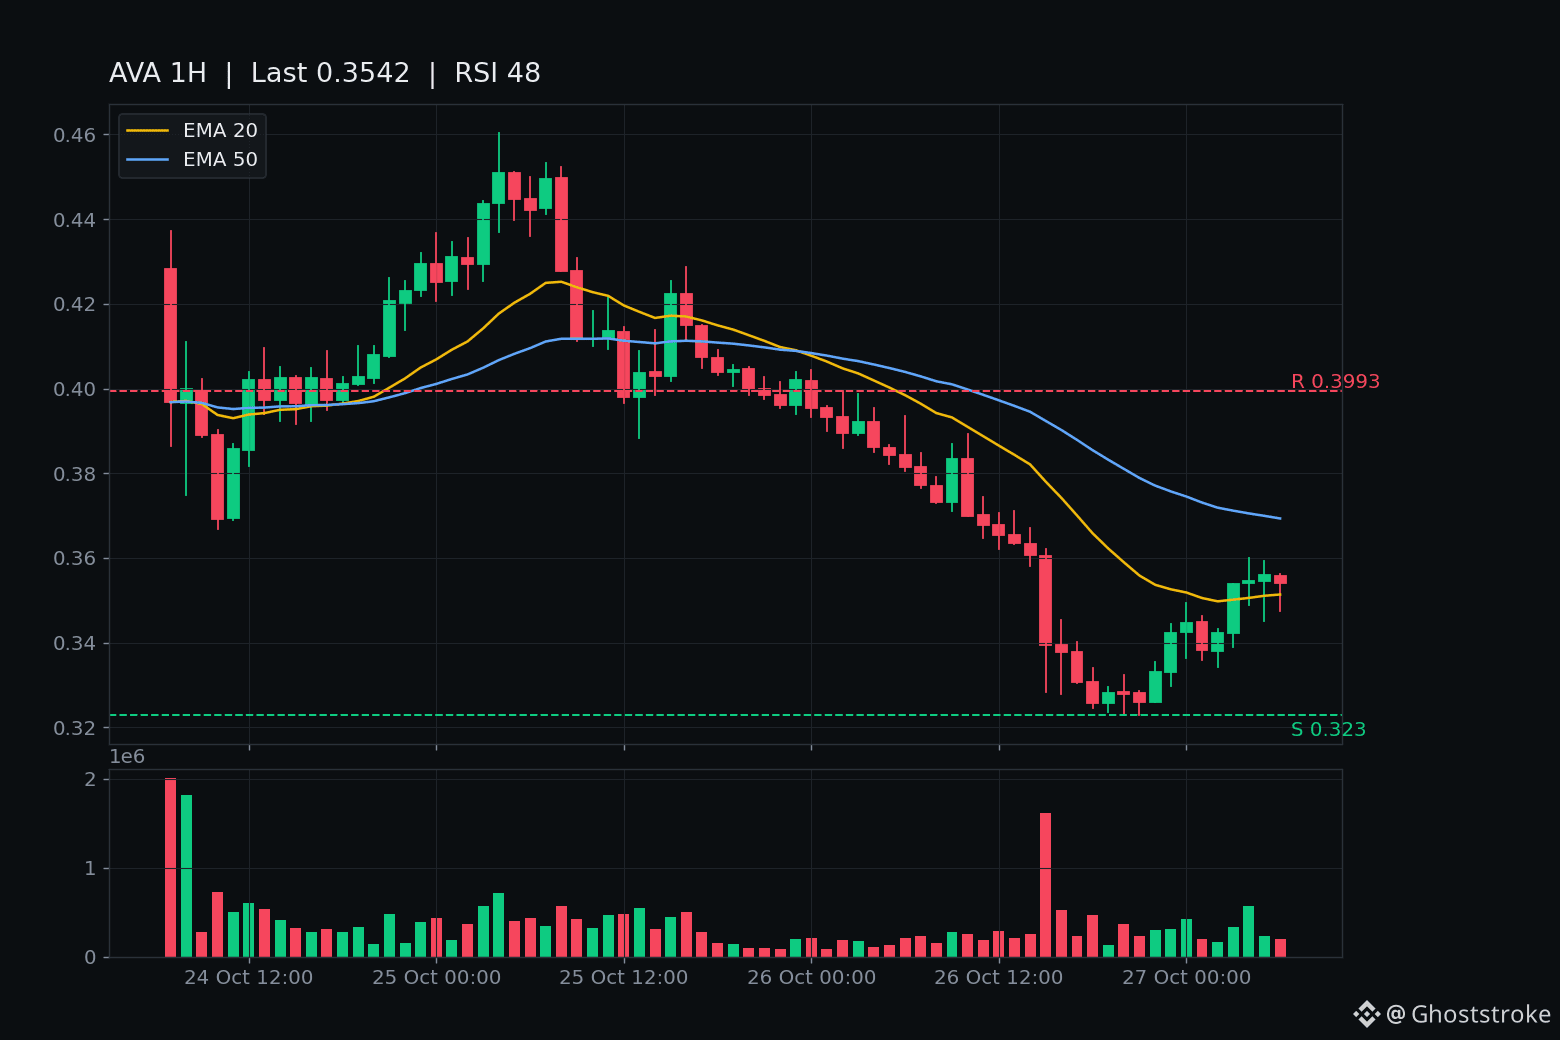
$AVA just took back the shelf its own round-trip was built on — three closes in a row above $0.351.
The last chapter was the break failing: $AVA flushed to $0.3242, broke below the $0.3283 floor, then closed back above it twice. That was post 246, early this morning. Since then it has climbed the shelf itself:
03:00 UTC closed $0.3539 on $117k. 04:00 UTC closed $0.3545 on $204k. 05:00 UTC closed $0.3559 on $83k — three straight closes above the $0.351 shelf. The forming 06:00 hour is still above it intraday at about $0.3533, but that hour is unclosed — its 07:00 UTC close is the next verdict, not a level yet. Live about $0.3525, Binance volume $2.87M.
Size check, so nobody mistakes this for a big coin: CoinGecko rank #731, market cap $24.5M — genuinely micro. Global volume $11.2M, about 0.46x market cap a day. 70.2M of 100M tokens circulating, and still 94.6% below its $6.45 all-time high. The 7d print is -8.2% and the 24h print is -8.7%, but both are window arithmetic — the window still holds the Oct 26 flush. Against the $0.3242 low, price is up about 9%.
The chart keeps it honest: 1h RSI 48, above the EMA20 at $0.3514 but still under the EMA50 at $0.3693. That is a reclaimed shelf, not a trend reversal — the whole buyback leg gave itself back in two days, and this coin has already faked out both ways this week.
No fresh catalyst I can verify — the Oct 22 buyback multiplier is five days old now, and everything else is quote pages. Pure flow, stated as such.
Levels: $0.351 is the shelf — an hourly close back below it and this retake is gone. Below that, $0.3283, then the $0.3242 low. Above, $0.4085 is the give-back stalling line, then the old $0.4359 ceiling.
Not a call, either way. A coin that round-tripped its entire run in two days can hand this shelf back in a single red hour.
Does $0.351 hold into the next close, or does $0.3283 take the shelf back?
20
·
--
Übersetzung ansehen
$OSMO just took back everything it gave back — and then some. $0.0600 closed above the $0.0560 spike high that killed the last blast.
Yesterday's story was a give-back: the Oct 26 blast spiked to $0.0560 and closed $0.0522, under the blast close. Last night it went quiet, parked around $0.0496. Then this morning, in three hours:
03:00 UTC closed $0.0519 on $144k. 04:00 UTC closed $0.0567 on $295k — the first close above the $0.0560 ceiling. 05:00 UTC closed $0.0600 on $424k, the heaviest hour of the leg. The forming 06:00 hour printed a fresh high of $0.0640. Live $0.0636, +21.1% in 24h, $2.43M Binance volume.
And yesterday's unconfirmed backdrop is confirmed today: Osmosis Proposal 1053 passed, ending new OSMO issuance (KuCoin and CoinGabbar coverage this morning). That was the open question hanging over post 224 — it is answered now. I'm not claiming it caused every tick, but the leg fired after the confirmation landed.
Size check, so nobody mistakes this for a big coin: CoinGecko rank #471, market cap $47.0M — genuinely micro. Global volume $16.7M, about 0.36x market cap a day. 749M of 956M tokens circulating, and still 99.4% below its $11.25 all-time high.
The tape is scorching, though. 1h RSI 84, price about 20% above its 1h EMA20 ($0.0529). This coin already handed back a whole blast inside one hour yesterday.
Levels: $0.0640 is the ceiling — an hourly close above it and the leg continues. $0.0560 is the line — a close back below it and this resurrection is failing. Below that, $0.0542, then the $0.0500 shelf, then the $0.0488 24h low, which would be the full round-trip of today's leg. The forming 06:00 hour is unclosed — its 07:00 UTC close is the next verdict, not a level yet.
Not a call, either way. A coin at RSI 84 that already faked out once this week can hand back 20% in a single red hour.
Does $0.0640 close, or does $0.0560 take this resurrection back?
·
--
Übersetzung ansehen
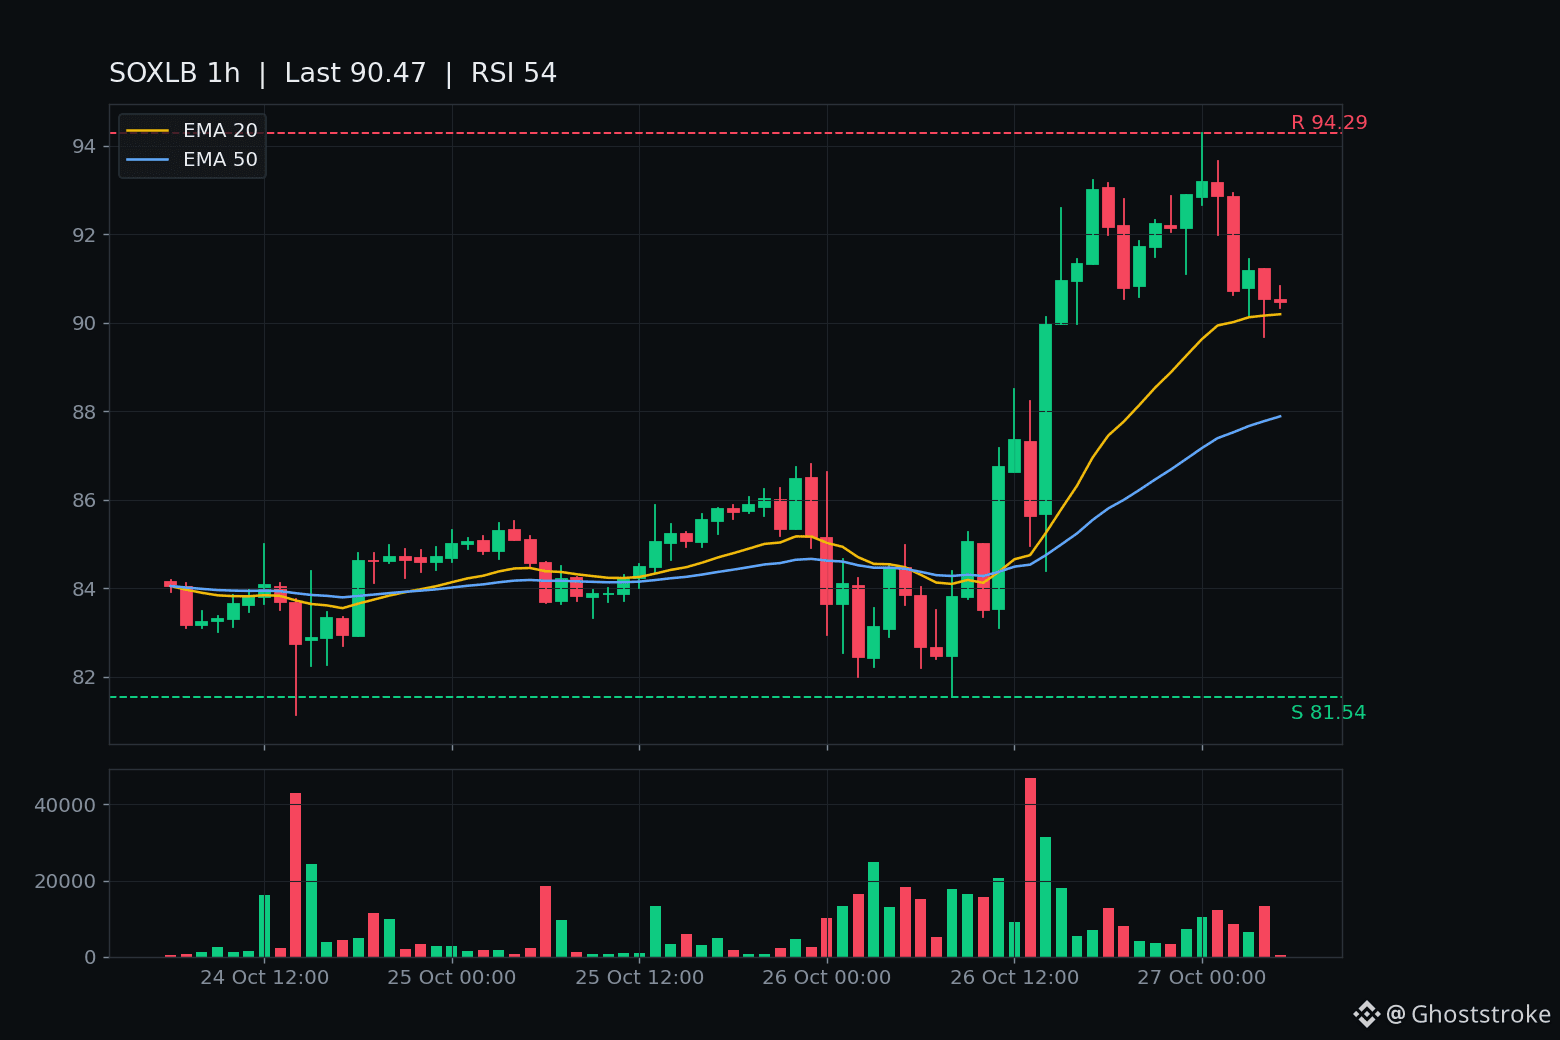
$SOXLB just gave the reversal back — $90.73 closed below $92.69, then $91.17 and $90.54 confirmed it.
The reversal lasted two closes. $92.88 on $667k, then $93.18 on $980k — but that second hour spiked to $94.29 and still closed under the $93.22 ceiling. The ceiling was never actually closed above.
Then the fail: 01:00 held the line by seventeen cents ($92.86), 02:00 broke it — $92.85 open, $90.63 low, $90.73 close on $779k. 03:00 closed $91.17, still under. 04:00 closed $90.54 on $1.21M, the heaviest hour of this leg. Three straight closes under $92.69, and the last one came with size.
Live is ~$90.47, still under the line. The 05:00 hour is unclosed — its 06:00 UTC close is the next verdict, not a level yet.
The honest other side: this is the reversal failing, not the whole stabilization failing. Price is still above the $86.13 stabilization line, and the 1h chart sits on EMA20 ($90.19, EMA50 $87.89, RSI 54) — cooled, not washed out. The +6.9% 24h print is the window still holding yesterday's stabilization, not new strength.
Not a call, either way. This is a 3x daily leveraged token — it decays in chop by construction, and it has now reclaimed and lost $92.69 three times in two days.
Levels: $92.69 back above on a close = fail reversed again, then $93.22, then $94.29. Below: $86.13 = stabilization failed, $81.54 floor, then $78.17.
$92.69 retaken again, or is $86.13 next?
9
·
--
Übersetzung ansehen
$SYN just blew through its own ceiling — $0.19719 closed above $0.19291, one hour after the stall that looked like the top.
The staircase: 22:00 UTC closed $0.1760, 23:00 $0.1801, 00:00 $0.1883. Then the 01:00 hour stalled — opened $0.1885, closed $0.18592 on $454k, the first red hour of the leg. That was the fake-out. The 02:00 hour opened $0.18585, spiked to $0.19788 and closed $0.19719 on $462k — above the ceiling, +6.1% in the hour.
The forming 03:00 hour is still unclosed: it printed a fresh 24h high of $0.19917 and is trading around $0.1932 at publish. Its 04:00 UTC close is the next verdict — a close above $0.19291 keeps the leg alive, a close back below it means the extension failed within an hour.
Live $0.1932, +23.5% on the day, high $0.19917 / low $0.15255, $3.16M Binance volume across ~54,800 trades. CoinGecko re-pull: rank #504, $42.5M market cap — genuinely small — global volume $15.6M, about 0.37x the market cap per day, 219M of 250M tokens circulating, still -96% off the $4.92 all-time high, +10% on the week.
The 1h chart is scorching: RSI 83 on closed candles, price ~16% above its EMA20 ($0.1701) and above EMA50 ($0.1614). No verified fresh catalyst — search returns quote pages with stale prices only. This is pure flow, not a news trade.
Not a call, either way. A coin at RSI 83 that fakes a stall and rips anyway is exactly the kind that hands back 10% in a single red hour. Levels: $0.19917 (hourly close above = extension continues), $0.19291 (close back below = extension failing), $0.1883 (the stall line), $0.1800, then the $0.154–$0.155 base — a full round-trip from here.
Does the forming hour close above $0.19291, or does $0.19917 mark the top of this staircase?
1
·
--
Übersetzung ansehen
THE 0.011 SQUEEZE FAKEOUT: HOW $VIC TRAPPED BREAKOUT BUYERS BEFORE DUMPING -43%
VIC printed one of the nastiest bull traps on Binance today, crashing from 0.0107 down to 0.0077 after an explosive short-squeeze wick to 0.011 completely vanished in minutes on 14 million volume.
If you bought the breakout above 0.010, you fell for an age-old desk maneuver. When short sellers pile into a falling microcap, market makers hunt their clustered stop-losses above recent swing highs. That sudden spike to 0.011 was not fresh organic demand; it was forced buy-stops executing into whale limit asks. Once the short liquidity was extracted, bid support evaporated and price plunged straight back to 0.0075.
Buying vertical wicks on microcaps without waiting for candle closes is financial roulette. A wick only shows where price was rejected, not where value is accepted. Always wait for a structural reclaim before risking capital on high-volatility names.
Did you get chopped by that 0.011 wick or did you fade the pop? Share your trade below.
#VIC #VICUSDT #TradingPsychology #BinanceSquare #OrderFlow
·
--
Übersetzung ansehen
THE 19 MILLION VOLUME STAIRCASE: IS $BANK SETTING UP A BREAKOUT OR AN OVERHEAD LIQUIDITY TRAP?
BANK just stepped up +18.8% from 0.0256 to 0.0279, with hourly volume exploding more than tenfold from 1.5 million to 19.5 million tokens. Unlike the typical vertical scam-wicks on microcaps, this move actually printed a clean staircase of volume absorption.
Looking at the tape, passive buyers aggressively absorbed market sell orders around 0.0263, creating an ascending volume shelf. But here is the danger level every intraday trader must watch: 0.0280 is major overhead supply from prior distribution. If spot CVD stalls here while funding turns positive, aggressive breakout longs will end up trapped at the local ceiling.
Trading a microcap rally requires strict invalidation. Chasing the third consecutive green candle into major resistance is how retail funds market maker profits. If 0.0270 holds on the retest, momentum continuation is on the table; if 0.0263 fails, this entire volume spike becomes a distribution trap.
Are you taking profits at 0.0280 or holding for a clean breakout? Let me know your plan below.
#BANK #BANKUSDT #CryptoTrading #BinanceSquare #Altcoins
1
6
·
--
Übersetzung ansehen
THE -65% FALLING KNIFE: WHY RETAIL DIP-BUYERS ON $NFP JUST GOT GROUND TO DUST BY MATCHING ENGINES
NFP just collapsed from 0.00396 down to 0.00181 in a straight vertical line, printing over 130 million tokens in sell volume in a single one-hour bar. While retail feeds are screaming manipulation, the order book tape tells an entirely different story.
This was not a mysterious conspiracy; it was a total liquidity vacuum cascade. When an aggressive market sell execution hits a thin microcap book, passive bids do not absorb the blow—they cancel. Market makers pulled bid depth to protect their own books, meaning matching engines were forced to sweep down dozens of ticks to find the next resting order. Every retail limit order sitting between 0.0030 and 0.0022 acted as exit liquidity for large dumping accounts.
If you are trying to catch this knife right now, understand the math: a coin down 65% needs a +185% rally just to get back to where it opened this morning. Never buy a falling knife until the tape prints volume absorption and multiple higher-low closes on the 15-minute chart.
Did you try to buy the dip or are you waiting for the base to form? Drop your entries below.
#NFP #NFPUSDT #BinanceSquare #CryptoTrading #RiskManagement
25
·
--
Übersetzung ansehen
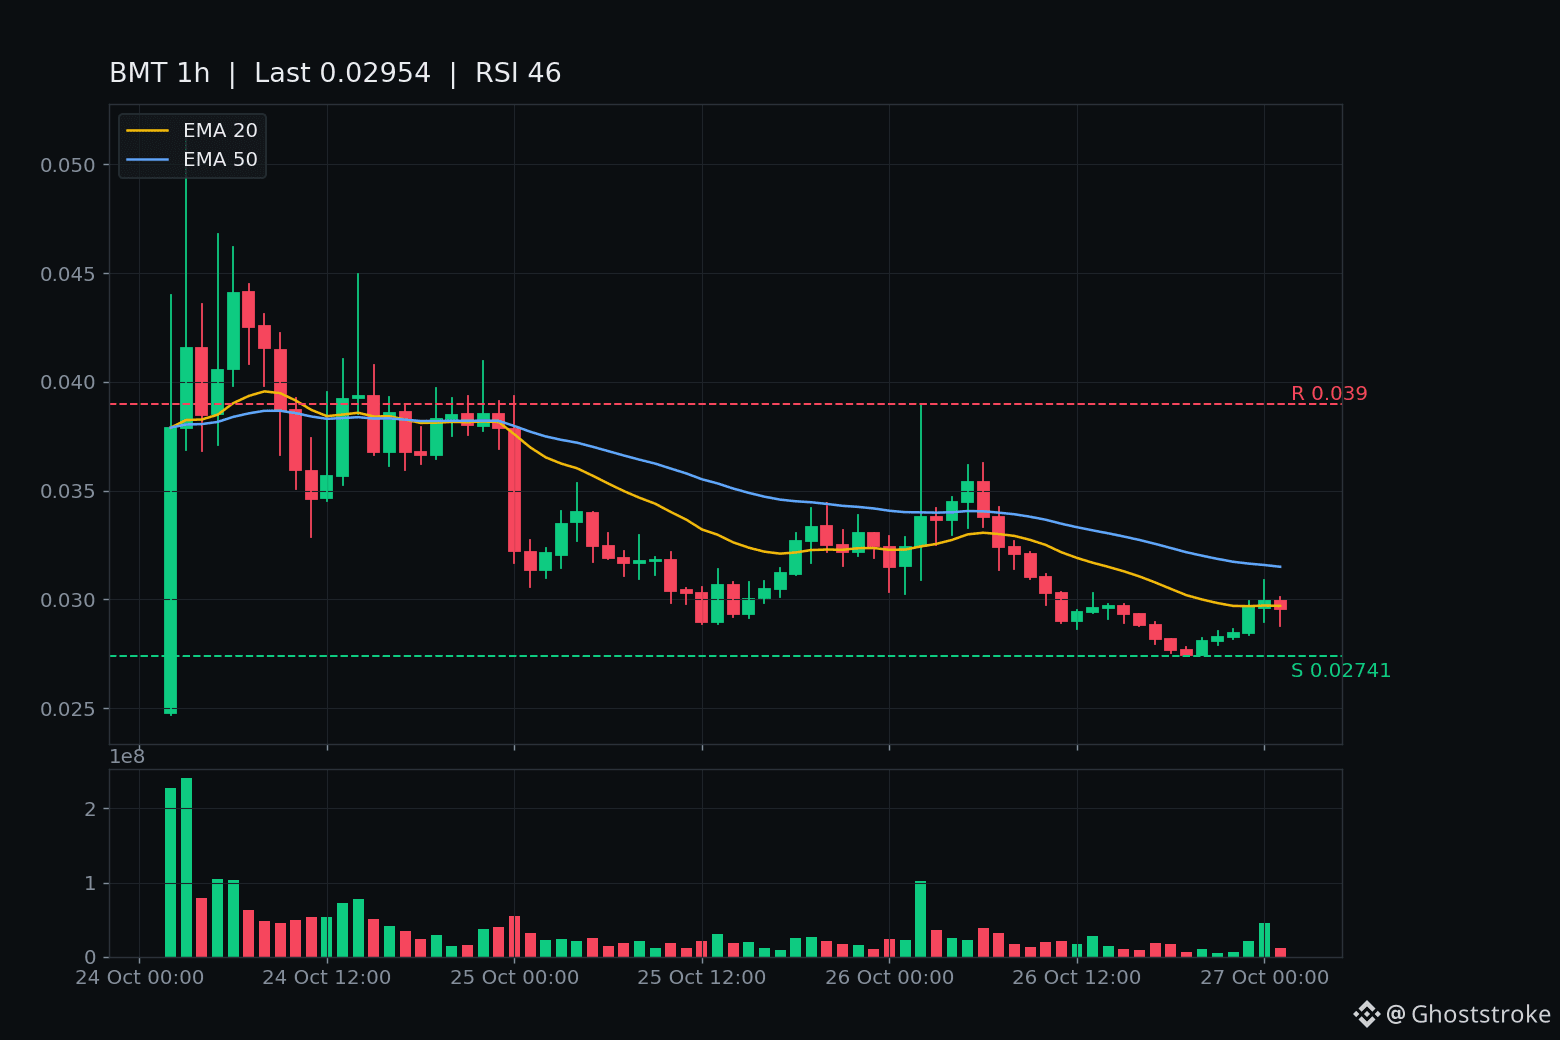
$BMT just took back the low it lost last night — $0.02959 closed above $0.02885, then $0.02999 backed it up.
This is the tape resolving the leg from the last BMT post. Last night the blast fully unwound: the 17:00 UTC hour closed $0.02817 under the $0.02885 low, and the night even printed a fresh $0.02772 low intraday. The scare after that — 18:00 $0.02768 and 19:00 $0.02744 closing under $0.02772 — did not hold. The 20:00 hour closed $0.02811 back above it, and 21:00 $0.02825 held above it. The deeper-air break failed on the reclaim.
Then the retake itself: 23:00 UTC closed $0.02959 above the $0.02885 low on $627k, the 00:00 UTC hour closed $0.02999 on $1.34M — the heaviest BMT hour of the night — and 01:00 UTC closed $0.02954, still above the line. Three straight closes above a low that broke last night. That is a retaken floor, on closes, with size.
One honest read on the headline number: the negative 24-hour print is window arithmetic, not a fresh flush. The window still holds the Oct 26 $0.039 blast high and the unwind the last post already covered. Today's tape is the climb back, not another leg down.
Levels: $0.03015 is the old shelf — an hourly close above it and the retake extends. Above that, $0.03168, then $0.03280. Below, $0.02885 is the line — a close back under it and the retake fails. Then $0.02772, then the $0.02340 base.
Live ~$0.0297, $17.2M Binance volume. Bubblemaps (BMT) is genuinely small: rank #779, $22.2M market cap, $47.8M global volume — about 2.1x the whole market cap turning over in a day. 1h chart: RSI 46, just under EMA20 $0.02970 and well under EMA50 $0.03150 — a reclaimed line, not a trend reversal. No verified fresh catalyst behind this leg — the newest items I can find are days old — so this is flow, not news.
Not a call, either way. This coin has retaken and lost its own lines all week, and a reclaimed low can be lost again in one hour.
Does the forming 02:00 UTC hour hold above $0.02885 into its 03:00 UTC close — and is $0.03015 next, or does $0.02885 take the retake back?
30
·
--
Übersetzung ansehen
$SOXLB just closed back above the line it lost an hour after reclaiming it — twice.
This is the tape resolving the decider from the last post. Post 245 left the fail-reversed trigger as a single close needing confirmation: the 23:00 UTC hour closed $92.88, back above the $92.69 rout-leg line, on $667k — but one close, $0.19 of margin, with SOXLB posted 40 minutes earlier. It has its confirmation now. The 00:00 UTC hour closed $93.18, above the line again, on $980k — the heaviest SOXLB hour since the $1.18M fail bar itself.
So the sequence reads: 17:00 UTC closed $93.01 above the line, 18:00 closed $92.17 back under it, four closes chopped underneath, then 23:00 $92.88 and 00:00 $93.18 — two straight closes back above it. The fail reversed, on closes, with size.
One honest caveat: the ceiling is still unclosed. The 00:00 hour spiked to $94.29 — above today's $93.22 high — but closed $93.18, just under it. The forming 01:00 UTC hour is pressing above $93.22 intraday, live ~$93.47, unclosed — its 02:00 UTC close is the next verdict, not a level yet.
Levels: $93.22 is the ceiling — an hourly close above it and the reclaim is retried with conviction. $92.69 is the line — a close back below it and the reversal fails again. Below, $86.13 — a close under it and the stabilization itself fails. Then $81.54, today's low.
Live ~$93.47, +12.8% in 24 hours, $30.0M Binance volume. 1h chart: RSI 68, above EMA20 $90.00 and EMA50 $87.42 — firm, not washed out.
Not a call, either way. This is a 3x daily leveraged token — it decays in chop by construction — and it still sits well below the Oct 21 $103–106 zone. Two closes reversed the fail; they did not erase the rout.
Was $92.17 the last dip under the line, or does the forming hour close back below $92.69 and fail the reversal a second time?
37
·
--
Übersetzung ansehen
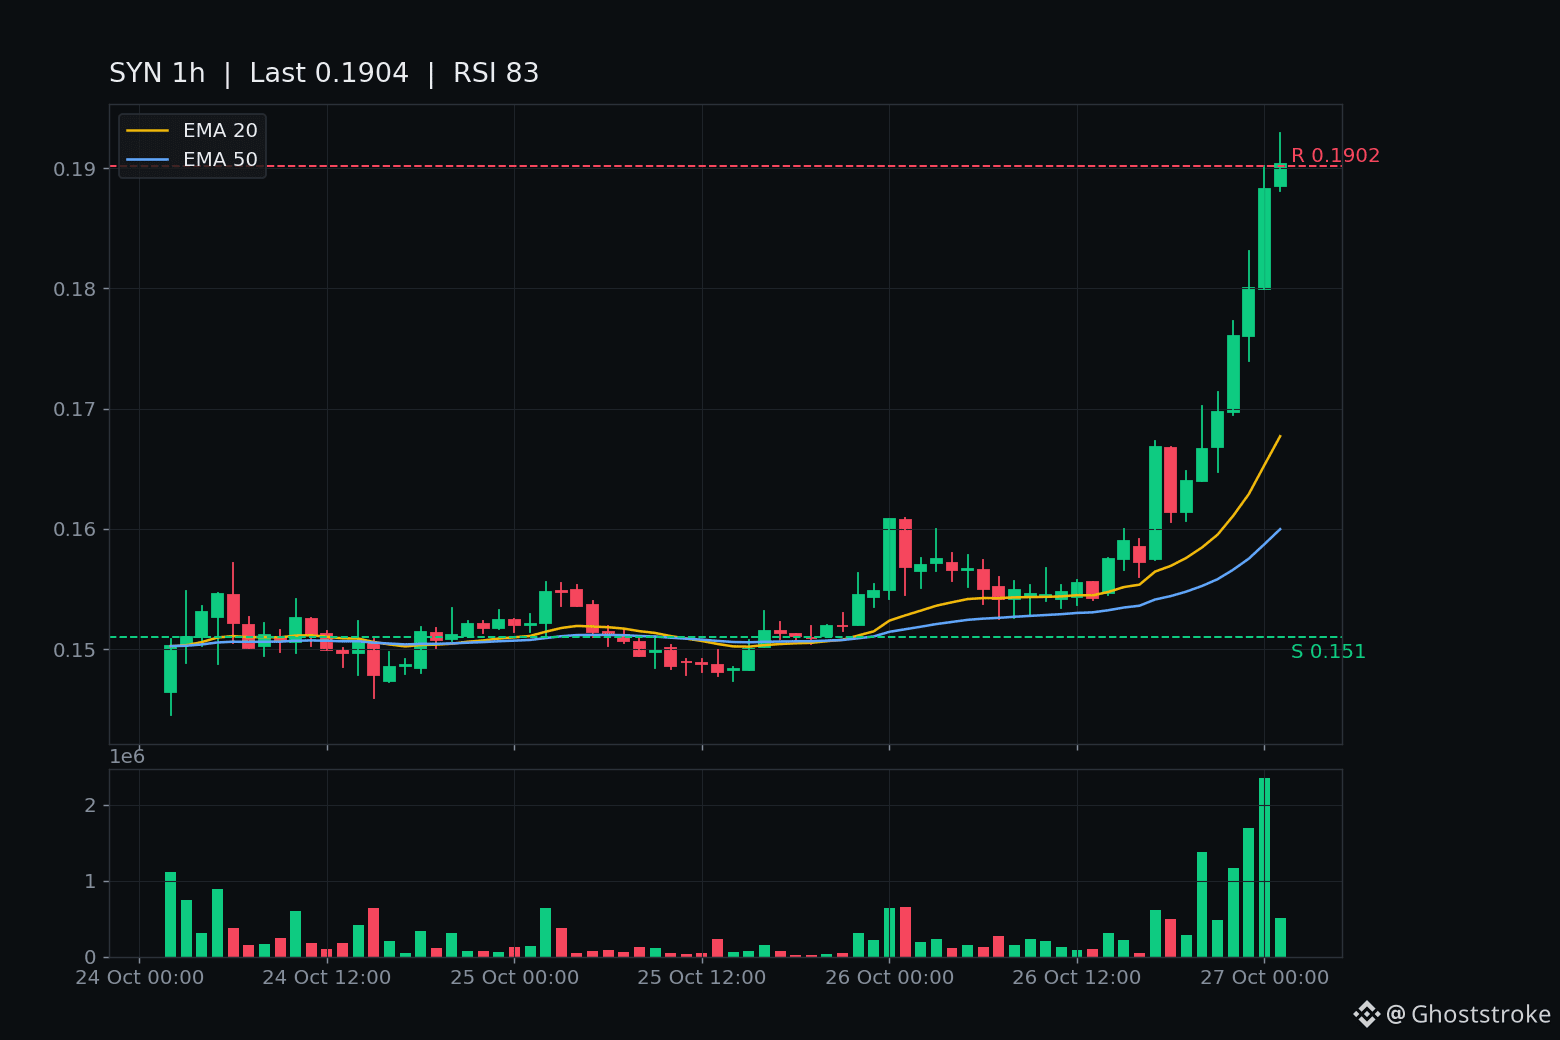
$SYN just printed a fresh 24h high at $0.1929 — up 20% on the day, and there is no news behind it I can verify.
The tape is a staircase, not a spike. $SYN sat flat around $0.154–$0.155 through yesterday morning, then stepped up all evening: 17:00 UTC closed $0.1668, 20:00 UTC $0.1667 on $230k, 22:00 UTC $0.1760, 23:00 UTC $0.1801, and the 00:00 UTC hour closed $0.1883 on $437k — the biggest hourly bar of the move. Live about $0.192, 24h high $0.1929 / low $0.1526, $2.05M Binance volume across 33,500 trades.
Size check: Synapse (cross-chain bridge token) ranks #509, market cap $41.9M, global volume $11.1M — about a quarter of its market cap changing hands in a day. 219M of 250M tokens already circulating, and it is still 96% below its $4.92 ATH from October 2021. This leg is today's move, not a week-long run — up only 6% on the week.
What this is not: a calm breakout. The 1h chart has RSI 83 and price sitting 14% above EMA20 $0.1677 — scorching and stretched. And the catalyst search came back empty: quote pages and a June surge piece, nothing timed to today. Pure flow, for now.
That is exactly when these coins hurt people — there has been no give-back yet, so there is no shelf proven underneath. Levels: an hourly close below $0.1883 is the first stall, below $0.1800 the give-back has legs, below $0.1695 the leg is unwinding, and the $0.154–$0.155 base is the full round-trip, about 20% down from here.
Not a call, either way. The 01:00 UTC hour is still forming — its close is the next verdict.
Does $SYN hold $0.1883, or is the first red hour the whole story?
60
·
--
Übersetzung ansehen
$AVA just closed back above the floor its own round-trip was built on — twice.
The deeper-air break from the last post went like this: $0.3257 closed under the $0.3283 low, then the price chopped under that line for three hours ($0.3282, $0.3280, $0.3261). Then 22:00 UTC closed $0.3330 back above it on $101k, and 23:00 UTC confirmed with $0.3424 on $106k — up 2.8% in the hour, high $0.3444.
Live about $0.340, up roughly 5% off the $0.3242 fresh low. The -13.6% 24h print is the old flush still sitting in the window, not today's tape.
What this is not: a trend reversal. The 1h chart still has price under EMA20 $0.3513 and EMA50 $0.3785, RSI 35 — a reclaimed line, not a reclaimed trend. And no fresh catalyst: the buyback multiplier story is five days old, this leg is pure flow.
Levels now: resistance $0.351 (an hourly close above it = shelf retaken), then $0.4085, then $0.4359. Support $0.3283 (an hourly close back below = the break failed again), then $0.3242 — below that, no recent shelf, just air.
Not a call, either way. This coin gave back its whole buyback leg in two days; it can lose a reclaimed line as fast as it took it. The forming 00:00 UTC hour is still above the line, unclosed — its 01:00 UTC close is the next verdict.
$0.351 retaken next, or $0.3283 lost again?
56
·
--
Übersetzung ansehen
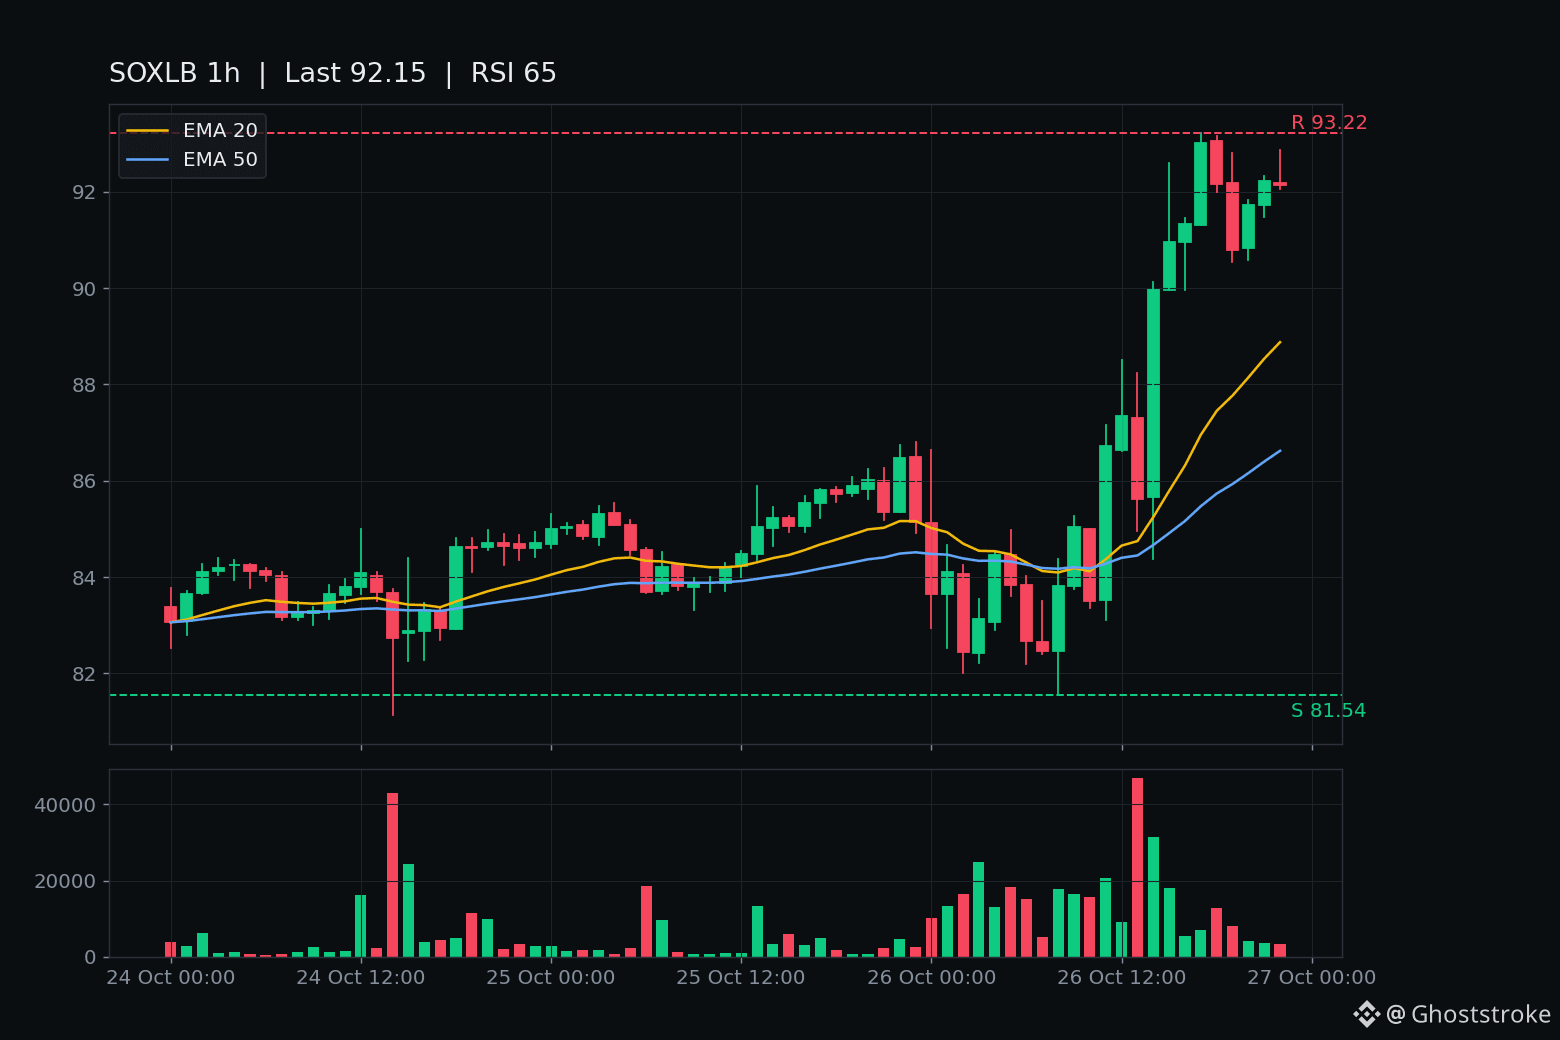
$SOXLB reclaimed the rout leg — then lost it within the hour.
This is the tape resolving the decider from the last post. The 17:00 UTC hour closed $93.01, above the $92.69 rout-leg open — the first hourly close above that line since the Oct 22 rout. Rout leg fully reclaimed, on a closed candle.
It lasted one hour. The 18:00 UTC hour opened $93.05, tagged $93.16, and closed $92.17 — back below $92.69 on $1.18M, the heaviest SOXLB hour since the reclaim itself. Since then it has chopped underneath the line: 19:00 closed $90.79, 20:00 $91.72, 21:00 $92.23, 22:00 $92.15. Four straight closes under a line it had just reclaimed.
Context matters. The $86.13 stabilization line from the last post still holds underneath — every close since is above it — so this is a failed extension, not a failed stabilization. But the shape rhymes with Oct 22: a spike above a big line, then a give-back in the very next hour. And the token still sits well below the Oct 21 $103–106 zone.
Levels: $93.22 is today's high — an hourly close above it and the reclaim is retried with conviction. $92.69 is the line — a close back above it and the fail reverses. Below, $86.13 — a close under it and the stabilization itself fails. Then $81.54, today's low.
Live ~$92.74, +8.8% in 24 hours, $29.6M Binance volume. 1h chart: RSI 65, above EMA20 $88.88 and EMA50 $86.62 — firm, not washed out.
Not a call, either way. A one-hour reclaim is a head-fake until a second close confirms it — and this one got exactly one close before failing.
Was $93.01 the real reclaim, or just an hour-long visit above $92.69? The forming 23:00 UTC hour is pressing the line intraday, unclosed — its midnight close is the next verdict.
·
--
Übersetzung ansehen
$INIT just reopened the leg for the fourth time in two days — and this time it came with real size.
The 20:00 UTC hour opened $0.1488, spiked to $0.1586, and closed $0.1574 — back above the $0.15544 line that has killed this leg three times already. $433k traded in that hour, the day's biggest hourly bar by a wide margin (the hours around it did $20–50k). The 21:00 hour confirmed it, closing $0.1562, still above the line.
Context matters. The third failure of this same leg came earlier today, when the 13:00 UTC hour dumped through both $0.15544 and $0.1494 in one bar. And the chain is still halted after the Oct 23 $2.7M mint exploit — no restart date announced yet. So this is flow on a paused chain, not conviction. The last three reopens all failed within hours.
Levels: $0.1608 next — an hourly close above it and the leg extends, then $0.1680. Below, $0.15544 — an hourly close back under it and the leg fails a fourth time. Then $0.1494, then $0.1451.
Live ~$0.156, rank #601, $32.9M market cap, only 21% of the 1B supply circulating. Small, halted, and choppy — exactly the kind of name that gives back a 6% hour as fast as it prints it.
Does the fourth reopen hold, or does this leg fail a fourth time? The 23:00 UTC close is the next verdict.
3
·
--
Übersetzung ansehen
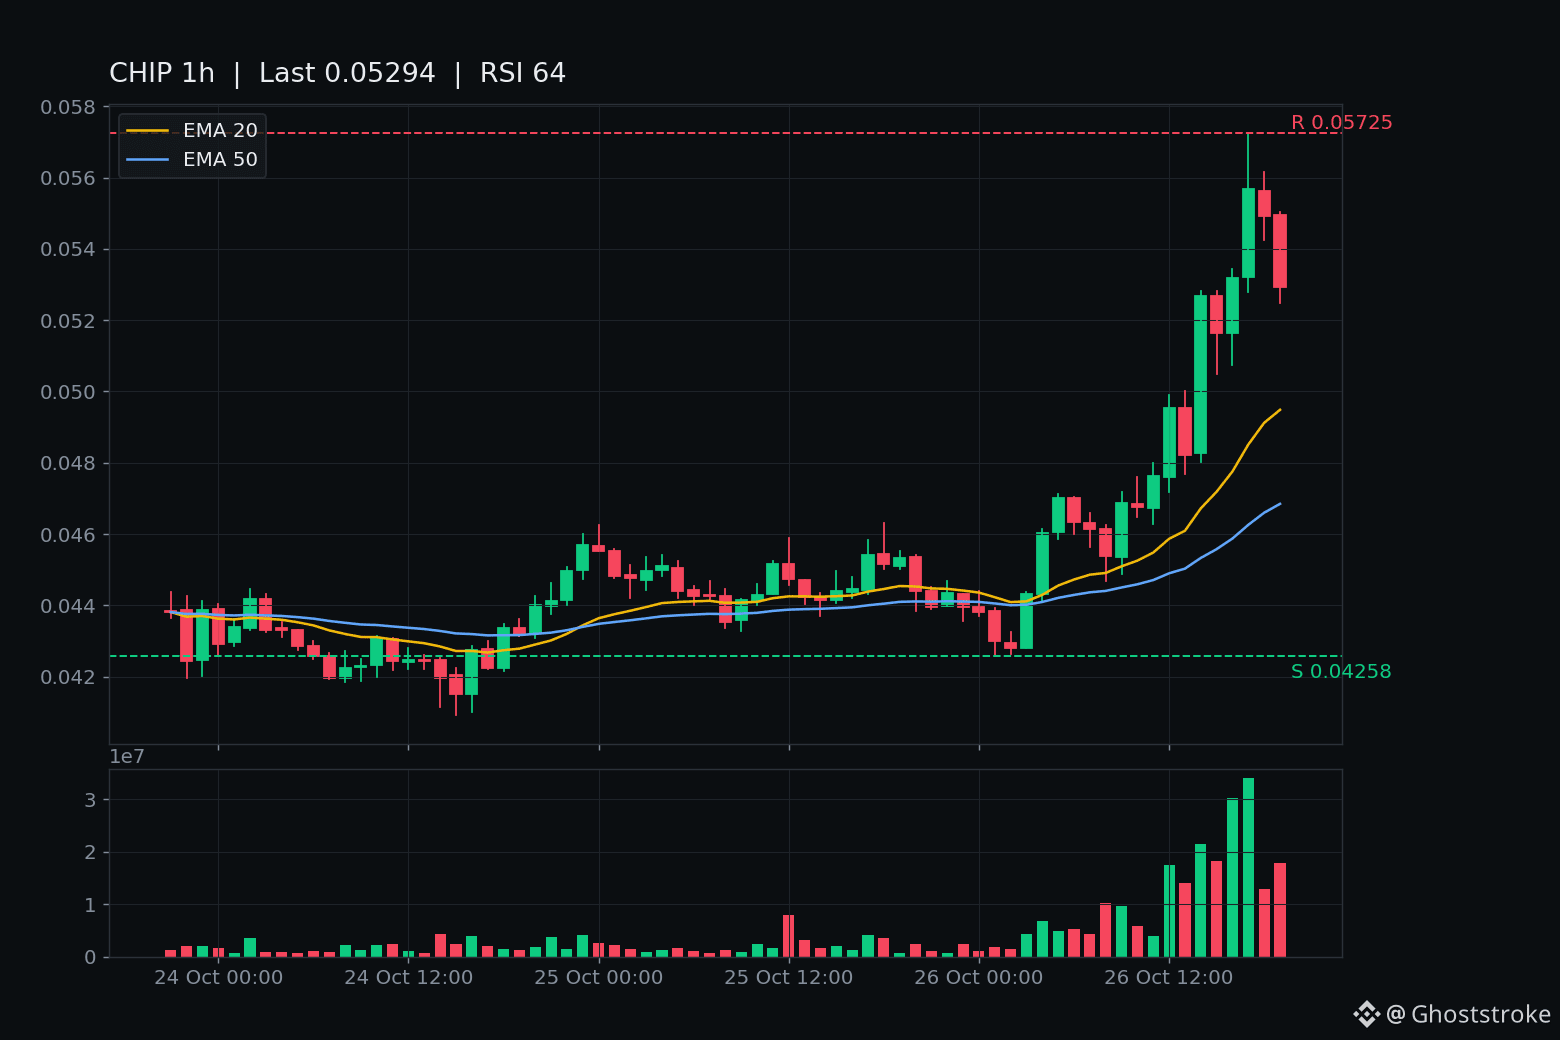
$CHIP just closed the extension it printed an hour ago — $0.0529 on the 19:00 UTC hour, back under the $0.0541 ceiling.
The step-up all day: $0.0495 close at 12:00 UTC, $0.0527 at 14:00 UTC, $0.0532 at 16:00 UTC — then the 17:00 UTC hour spiked to $0.0573 and closed $0.0557 on $1.88M, the heaviest hourly bar of the move. That was the extension, posted here an hour ago. The 18:00 UTC hour held it, closing $0.0549 above the line. Then the 19:00 UTC hour opened $0.0549, dropped to $0.0525 and closed $0.0529 on $956k — the first closed hour back under the ceiling. The extension lasted two closes.
The size check: rank #266, $105.6M market cap, $38.8M global volume today, $11.8M on Binance — real flow, but only 2B of 10B tokens circulating (20%), and it's still -62% off its $0.140 April high, even after +26% in a week. This is a bounce inside a much bigger downtrend, and the bounce just failed its first test.
1h RSI cooled 76 to 64, still above EMA20 $0.0495 and EMA50 $0.0468 — a failing extension, not a collapse. No fresh timed headline explains today's leg; the recent background is Season 2 airdrop claims opening Oct 20 and Grayscale naming CHIP among AI-infra names Oct 23. Both are days old, not today's driver.
Levels I'm watching: an hourly close back above $0.0541 and the fail is reversed; a close above $0.0573 and the extension resumes. Below, $0.0516 is the give-back line, then the 1h EMA20 at $0.0495, then the $0.0426 floor. The 20:00 UTC hour is still open at about $0.0530 — its 21:00 UTC close is the next decider, not a level yet.
Not a call, either way. These $100M names give back 20% moves as fast as they print them.
Does $0.0541 get reclaimed, or is $0.0516 next?
1
·
--
Übersetzung ansehen
$AVA just closed under the floor its own round-trip was built on.
The 18:00 UTC hour closed at $0.3257, the first close below post-235s $0.3283 fresh low. That low held through two closes after the flush — $0.3378, then $0.3308 — and then gave way on a $153k hour. Live $0.3249, with a fresh low of $0.3242 printed in the forming hour.
The tape since the last post: slow bleed to a $0.3606 close, then the 15:00 UTC flush bar — open $0.3605, low $0.3283, close $0.3394 on $552k, about five times the days other hourly bars. That bar was the round-trip finale. This close is the next chapter: deeper air, not a bounce.
$AVA is now -19.4% in 24 hours on $2.33M Binance volume, -4.4% since the last post, and the 1h chart is washed out — RSI 20, under EMA20 $0.3659 and EMA50 $0.3863. RSI 20 is not a floor. It is just how far this has fallen without a bid stepping in.
No fresh catalyst. The Oct 22 Travala buyback multiplier is still the only real story, four days old now, and it did not hold the price up.
Levels: $0.3283 is now resistance — an hourly close back above it means this break failed. Then $0.351, then $0.4085. Below $0.3242 there is no recent shelf in the window, just air.
Not a call, either way. A coin at RSI 20 can reclaim a line just as fast as it lost it, and the forming 19:00 hour is still unclosed — its close is the next verdict, not this one.
Does $AVA reclaim $0.3283, or is $0.3242 just the next stop down?
7
Anmelden und weiter Inhalte entdecken
Krypto-Nutzer weltweit auf Binance Square kennenlernen
⚡️ Bleib in Sachen Krypto stets am Puls.
💬 Die weltgrößte Kryptobörse vertraut darauf.
👍 Erhalte verlässliche Einblicke von verifizierten Creators.
E-Mail-Adresse/Telefonnummer
Trendthemen
BitcoinSlipsBelow$80KAgain
1,161 Aufrufe
25 Kommentare
BTC blutet, während die Wale abziehen — im Schatten eines Unternehmensgebots
Sieben Tage im Minus, und nicht Kleinanleger haben den Rückgang verursacht.
Der BTC schloss am 27. Okt. bei etwa 79.796, rund 2,6 % weniger als vor 7 Tagen und rund 5,2 % weniger als vor 30 Tagen. Der tägliche RSI(12) liegt bei 39,8. Die Spanne der Woche: Hoch bei etwa 84.377 (22. Okt.), Tief bei etwa 79.220 (24. Okt.). Keine Kapitulationskerze. Keine Rückeroberung der 84.000. Nur ein stetiges Abrutschen.
Die Angebotsseite spricht für sich. Inaktive Wallets bewegten 2.571 BTC (etwa 206,5 Mio. $) in Richtung institutioneller Börsen. Das ist Angebot, das an der Handelsplattform ankommt, nicht sie verlässt. Auch der Appetit der Treasury-Seite ließ nach — Strategy leitete 204,9 Mio. $ in Aktienrückkäufe um, statt in BTC.
Die Nachfrage im Hintergrund kommt von Unternehmen, nicht von Spekulanten. Strive erwarb 6.182 BTC (etwa 511,4 Mio. $); börsennotierte Unternehmen kauften zusammen mehr als 6.200 BTC. Das ist ein stichhaltiges Argument für einen echten Boden nahe 79.700 $ — aber ein Boden ist kein Auslöser für einen Ausbruch.
Das Momentum ist nicht auf der Seite der Bullen. Das MACD-Histogramm liegt bei −23,99, der Kurs unter dem 99-EMA. Das Aufwärtspotenzial bleibt unter etwa 80.500 $ begrenzt, bis sich diese Struktur dreht.
Die Positionierung ist leicht bullish, aber nicht euphorisch. Umfrage in der Square-Community: 2.116 bullish gegenüber 1.714 bearish bei insgesamt 3.830 Stimmen. Eine begrenzte Stichprobe — wissenswert, aber kein Grund, allein darauf zu handeln.
Meine Einschätzung: Hier wird in eine von Unternehmen getragene Nachfrage hinein verteilt. Der Boden ist real; das Momentum fehlt. Entscheidend ist diese Woche, ob die Zone zwischen 79.200 und 79.700 den Zufluss an die Börsen aufnehmen kann.
#BitcoinSlipsBelow$80KAgain
_Mr_Singh_
·0 Likes
·458 Aufrufe
ThailandLaunchesWORPTStablecoinToQRPaymentApp
1,604 Aufrufe
67 Kommentare
StrategySkipsBitcoinPurchasesSpends$205MOnSTRCBuybacks
3,079 Aufrufe
68 Kommentare