
CRYPTO_APE
7.1k Beiträge

CRYPTO_APE
 Square Verified
Melden
Nutzer blockieren
Trade eröffnen
Hochfrequenz-Trader
5.6 Jahre
487 Following
39.5K+ Follower
29.1K+ Like gegeben
Beiträge
Portfolio
Alle
Zitierungen
Videos
Live
·
--
Bullisch
Übersetzung ansehen
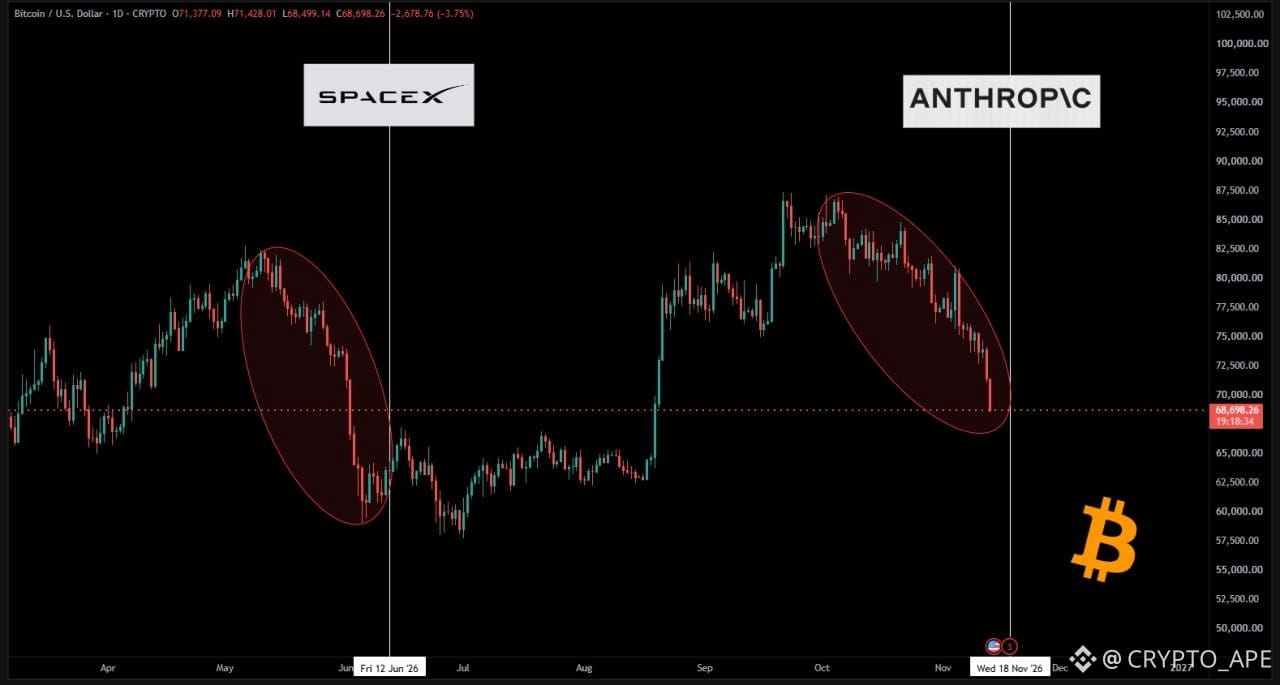
🚨 COINCIDENCE OR CAPITAL ROTATION?
📉 SpaceX IPO (June 12): BTC $82K → $57K
📉 Anthropic IPO (Nov 18): BTC $87K → $68K
Two IPO timelines, two major BTC sell-offs.
$BTC $SPCXB
{spot}(BTCUSDT)
🚨 COINCIDENCE OR CAPITAL ROTATION?
📉 SpaceX IPO (June 12): BTC $82K → $57K
📉 Anthropic IPO (Nov 18): BTC $87K → $68K
Two IPO timelines, two major BTC sell-offs.
$BTC $SPCXB
📉 SpaceX IPO (June 12): BTC $82K → $57K
📉 Anthropic IPO (Nov 18): BTC $87K → $68K
Two IPO timelines, two major BTC sell-offs.
$BTC $SPCXB
1
1
2
62
·
--
Bullisch
Übersetzung ansehen
🇹🇭Thailand has introduced a payment system that lets tourists convert their crypto into Thai baht and use it for everyday purchases.
$BTC
{spot}(BTCUSDT)
🇹🇭Thailand has introduced a payment system that lets tourists convert their crypto into Thai baht and use it for everyday purchases.
$BTC
$BTC

2
2
2
58
·
--
Bullisch
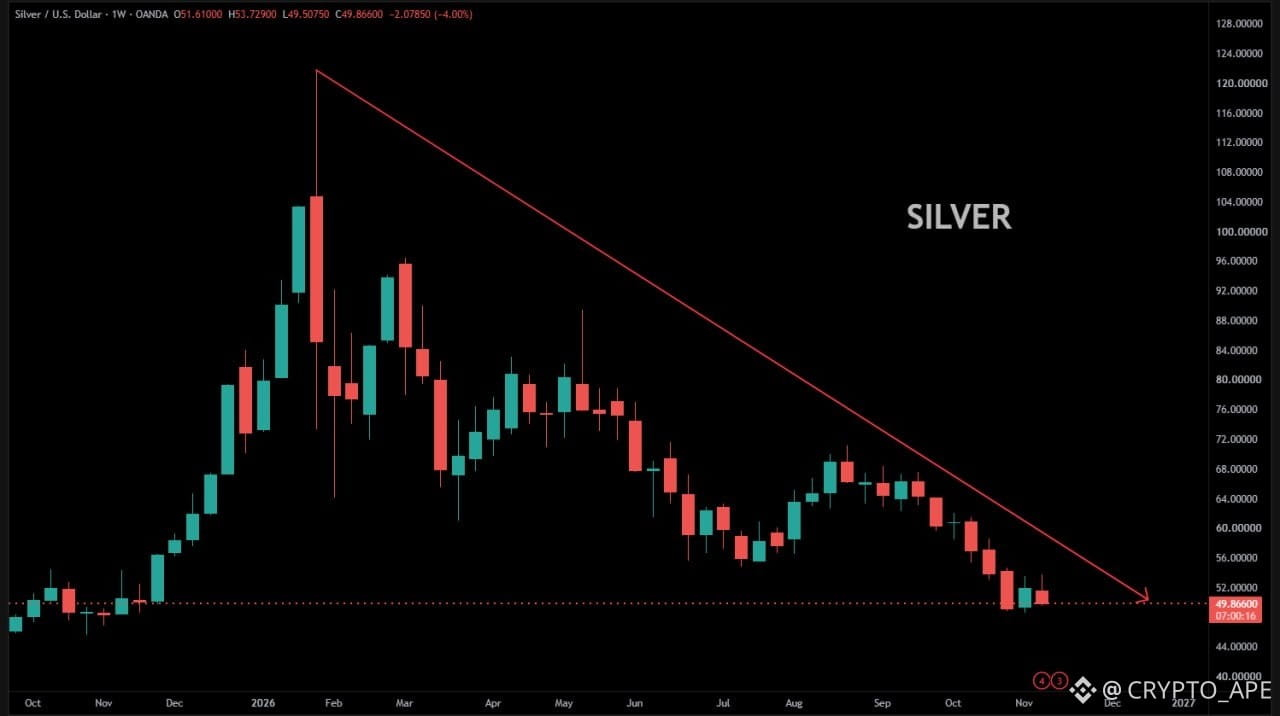
⚪️ Silber ist nun um 60 % gegenüber seinem Allzeithoch im Januar 2026 eingebrochen. 🔻
$SLVon $XAG
{future}(XAGUSDT)
{alpha}(560x8b872732b07be325a8803cdb480d9d20b6f8d11b)
⚪️ Silber ist nun um 60 % gegenüber seinem Allzeithoch im Januar 2026 eingebrochen. 🔻
$SLVon $XAG
$SLVon $XAG
2
1
2
457
·
--
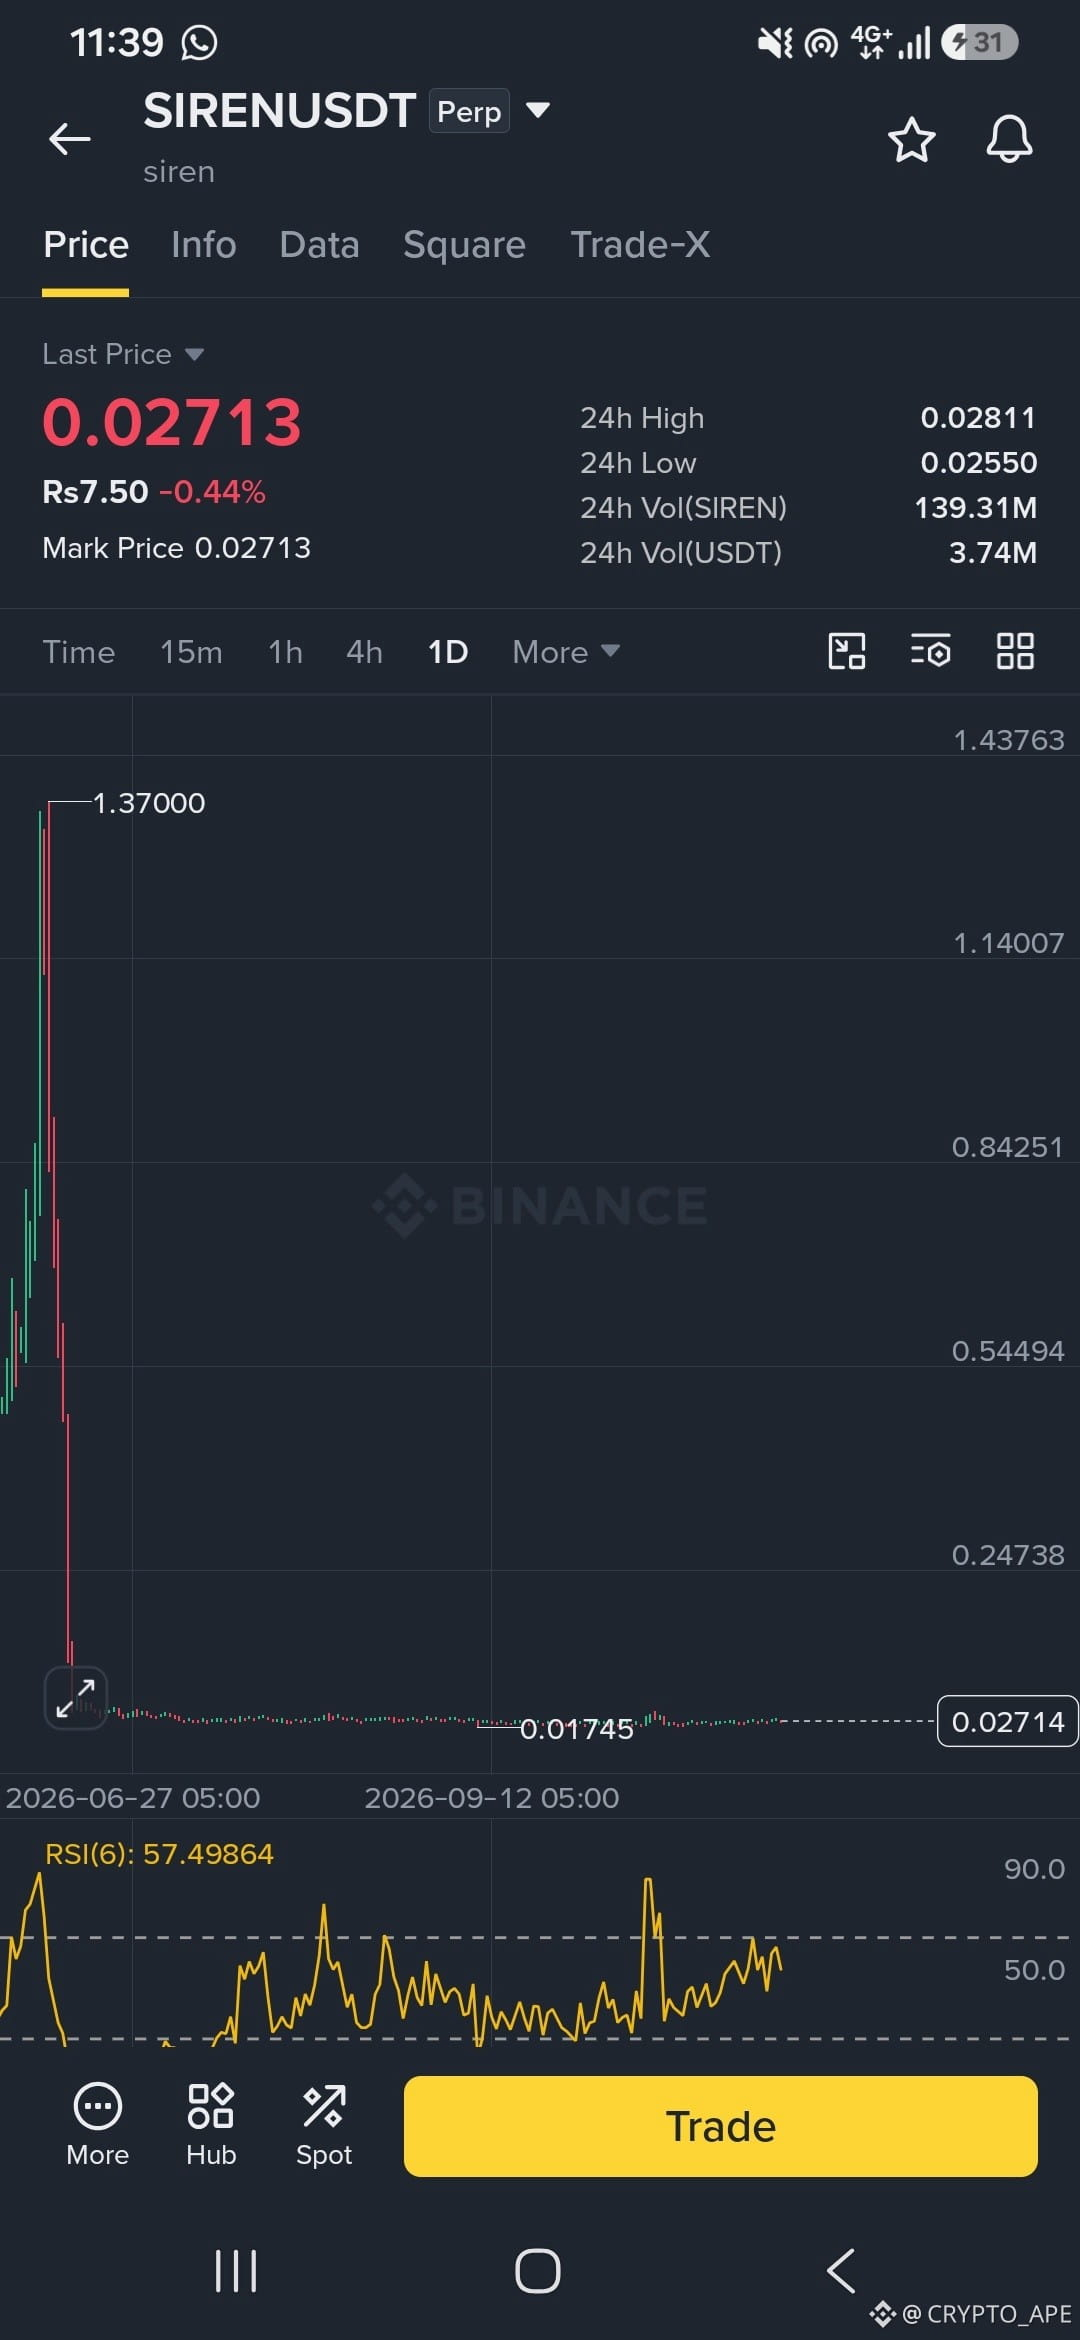
SIREN, warum gehst du nicht hoch ..... ich denke, es ist jetzt bullisch
ein echtes Projekt, es kann hohe Renditen bringen $SIREN
{alpha}(560x997a58129890bbda032231a52ed1ddc845fc18e1)
SIREN, warum gehst du nicht hoch ..... ich denke, es ist jetzt bullisch
ein echtes Projekt, es kann hohe Renditen bringen $SIREN
ein echtes Projekt, es kann hohe Renditen bringen $SIREN
2
1
6
529
·
--
Es ist Zeit, SOL zu kaufen ... SOL befindet sich auf einer Unterstützung, du kannst zum aktuellen Marktpreis kaufen.
$SOL Recherchiere selbst
{spot}(SOLUSDT)
Es ist Zeit, SOL zu kaufen ... SOL befindet sich auf einer Unterstützung, du kannst zum aktuellen Marktpreis kaufen.
$SOL Recherchiere selbst
$SOL Recherchiere selbst
1
2
3
630
·
--
Bullisch
Übersetzung ansehen
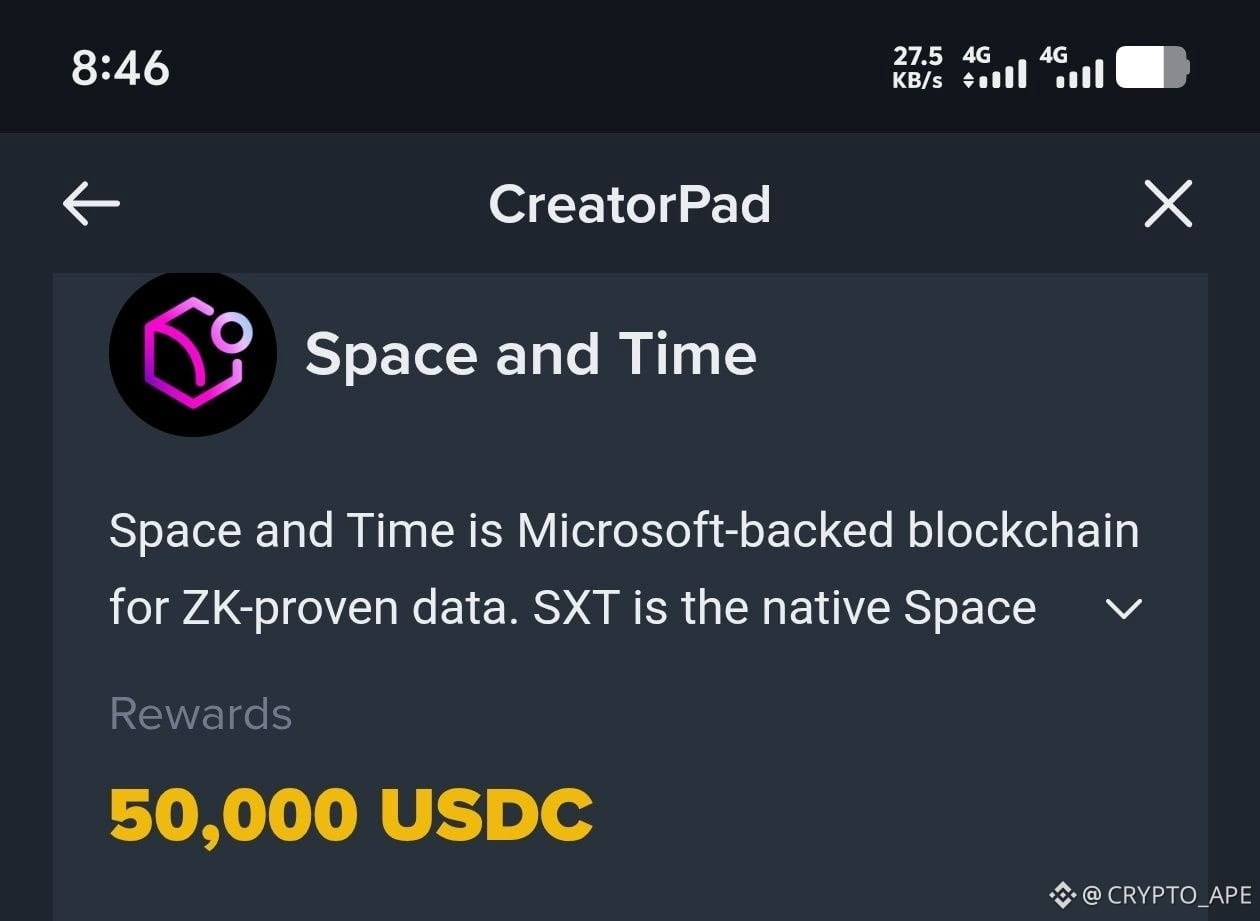
Binance New 5$-15$ Per Acc❔🔥
- Minimum 1,000 followers required
- Just 1 eligible post + $20 SXT trade
$SXT DYOR
{spot}(SXTUSDT)
Binance New 5$-15$ Per Acc❔🔥
- Minimum 1,000 followers required
- Just 1 eligible post + $20 SXT trade
$SXT DYOR
- Minimum 1,000 followers required
- Just 1 eligible post + $20 SXT trade
$SXT DYOR
2
2
2
78
·
--
Bullisch
Übersetzung ansehen
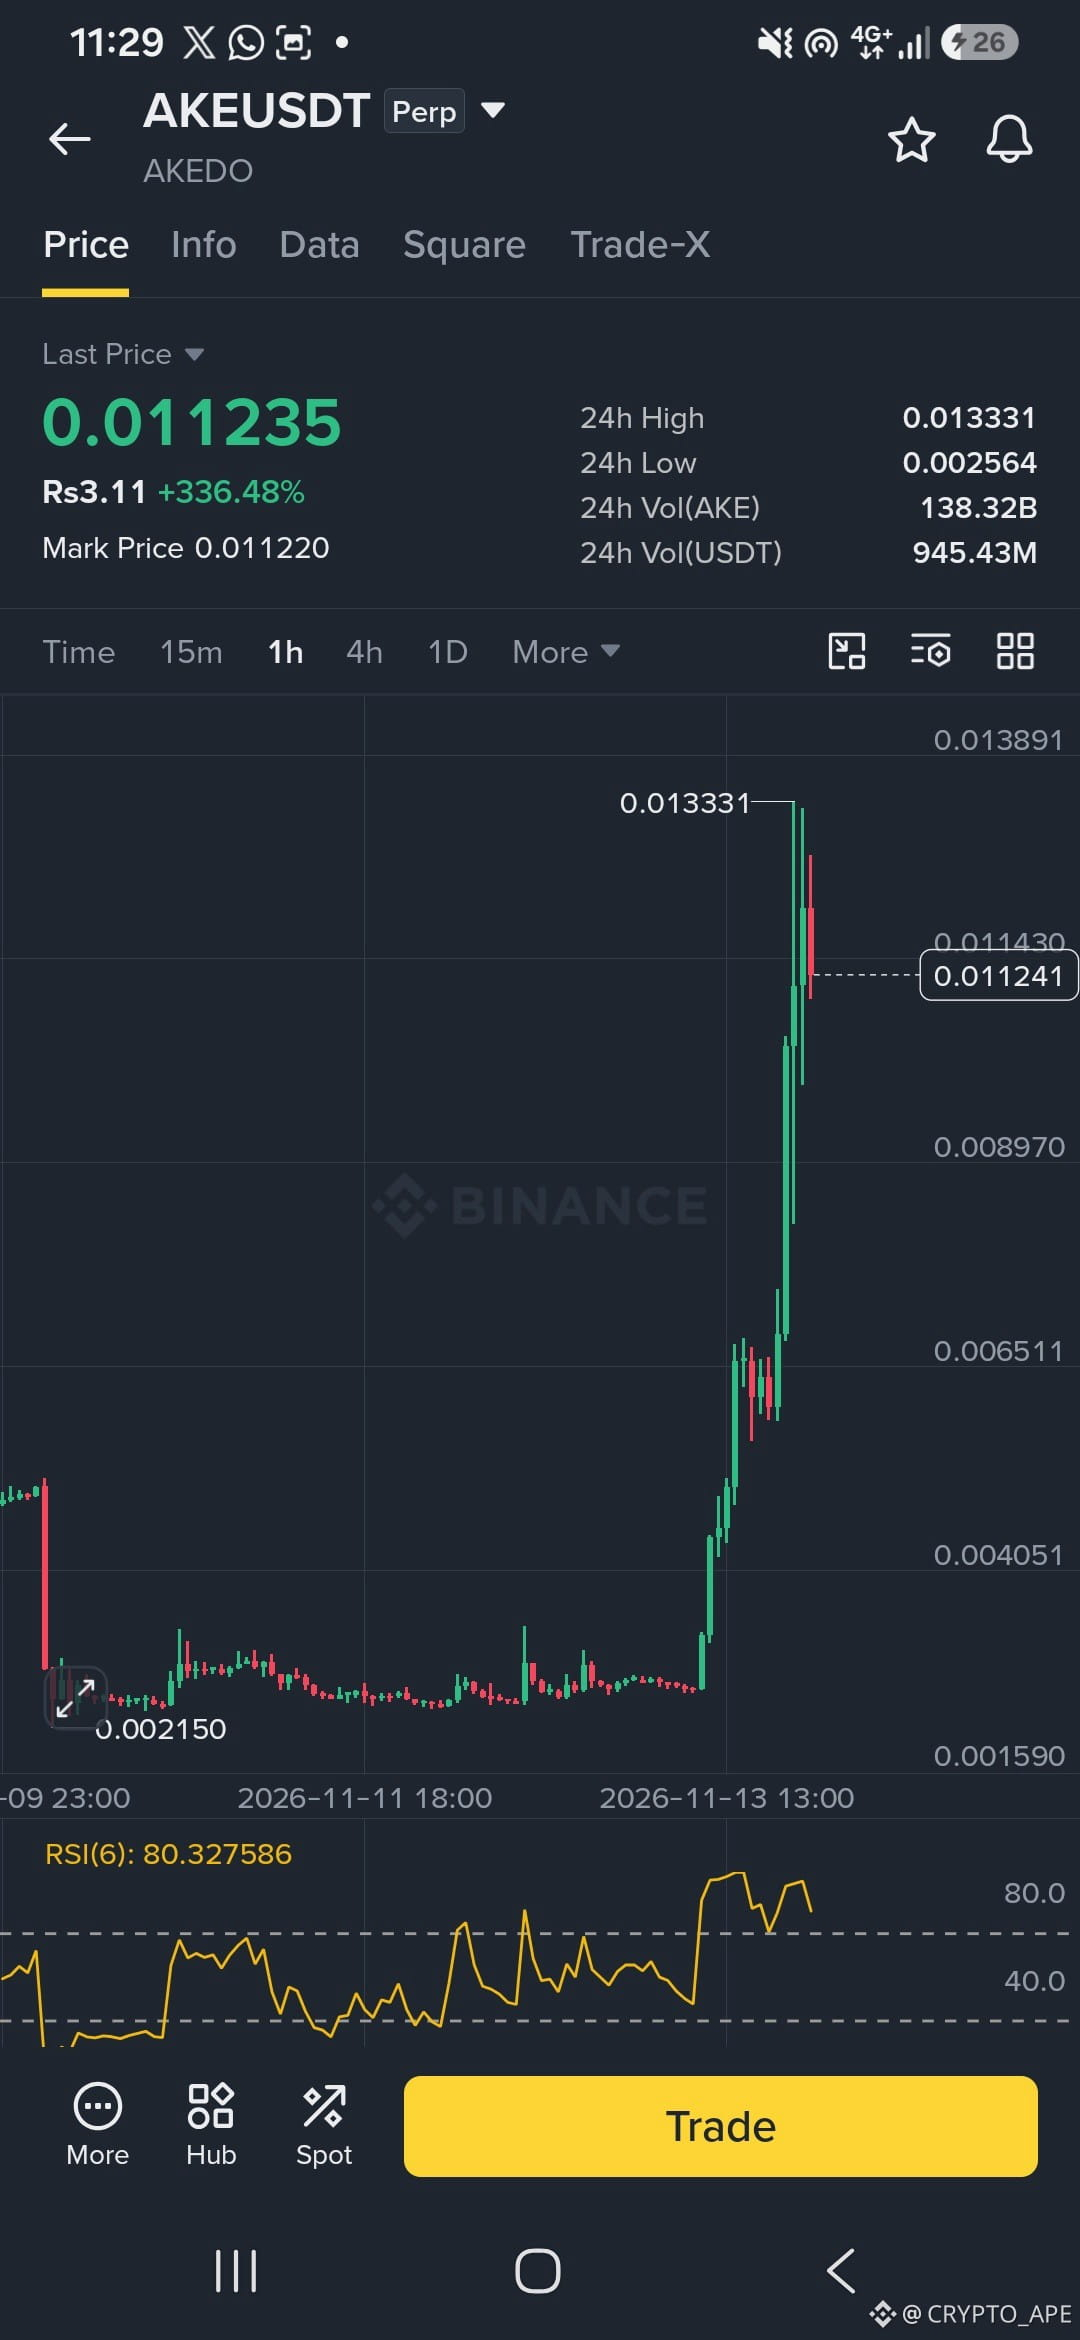
$AKE Damn, the short sellers got badly punished
$AKE
{future}(AKEUSDT)
DYOR
$AKE Damn, the short sellers got badly punished
$AKE
DYOR
$AKE
DYOR
2
2
2
504
·
--
Artikel
Übersetzung ansehen
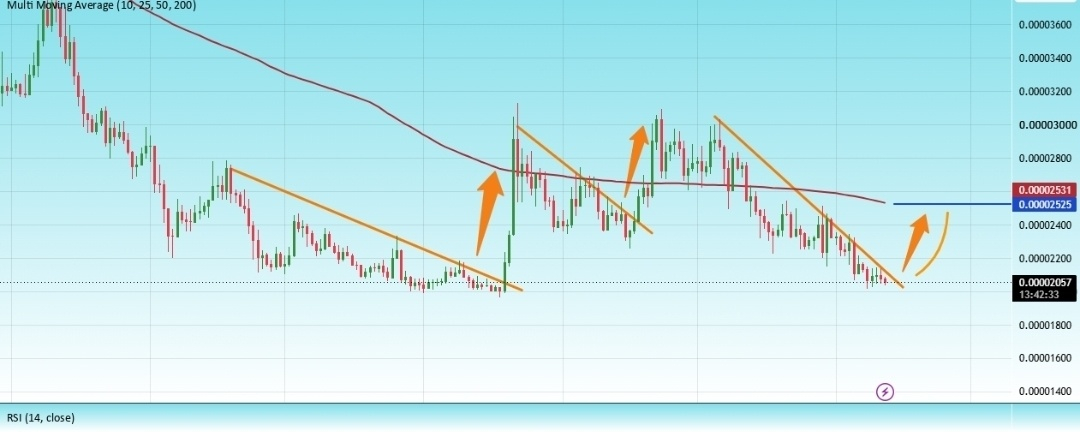
FLOKIUSDT Potential Trendline Breakout - FLOKI Eyes 0.00002525?FLOKIUSDT 1D
FLOKI/TETHERUS Binance
#FLOKI
Following the strong upward rally experienced by the coin, selling pressure has started to emerge, with price moving below the 200-day Moving Average (MA200). This reflects weakening bullish momentum and suggests that the market has entered a bearish corrective phase.
Key Support Zone & Expected Scenario
Price has now reached a major support zone at 0.00002000, which could serve as an important pivot area for a potential bullish rebound, particularly following the recent downside correction.
If this support zone successfully absorbs selling pressure and positive reversal signals begin to emerge, we could see an upward move targeting:
Potential Target: 0.00002525
Technical Signals Supporting the Scenario
Adding further weight to this potential setup is the presence of three consecutive descending trendlines (orange). Price is currently approaching a test of the third descending trendline.
Previous setups have shown bullish movements following breakouts above descending trendlines. Therefore, the current breakout attempt deserves close attention, as it could signal the end of the corrective phase and the beginning of a new bullish rebound.
Conclusion
The main focus is currently on the 0.00002000 support zone, while price approaches a potential breakout above the third descending trendline.
A successful rebound from support, combined with a confirmed trendline breakout, could open the door for an upward move toward 0.00002525.
Risk Consideration: This bullish scenario remains conditional on price holding above the key support zone and confirming the breakout. Trading below the 200-day Moving Average continues to reflect underlying weakness in the broader trend.
$FLOKI DYOR
{spot}(FLOKIUSDT)
FLOKIUSDT Potential Trendline Breakout - FLOKI Eyes 0.00002525?
FLOKIUSDT 1D
FLOKI/TETHERUS Binance
#FLOKI
Following the strong upward rally experienced by the coin, selling pressure has started to emerge, with price moving below the 200-day Moving Average (MA200). This reflects weakening bullish momentum and suggests that the market has entered a bearish corrective phase.
Key Support Zone & Expected Scenario
Price has now reached a major support zone at 0.00002000, which could serve as an important pivot area for a potential bullish rebound, particularly following the recent downside correction.
If this support zone successfully absorbs selling pressure and positive reversal signals begin to emerge, we could see an upward move targeting:
Potential Target: 0.00002525
Technical Signals Supporting the Scenario
Adding further weight to this potential setup is the presence of three consecutive descending trendlines (orange). Price is currently approaching a test of the third descending trendline.
Previous setups have shown bullish movements following breakouts above descending trendlines. Therefore, the current breakout attempt deserves close attention, as it could signal the end of the corrective phase and the beginning of a new bullish rebound.
Conclusion
The main focus is currently on the 0.00002000 support zone, while price approaches a potential breakout above the third descending trendline.
A successful rebound from support, combined with a confirmed trendline breakout, could open the door for an upward move toward 0.00002525.
Risk Consideration: This bullish scenario remains conditional on price holding above the key support zone and confirming the breakout. Trading below the 200-day Moving Average continues to reflect underlying weakness in the broader trend.
$FLOKI DYOR
FLOKI/TETHERUS Binance
#FLOKI
Following the strong upward rally experienced by the coin, selling pressure has started to emerge, with price moving below the 200-day Moving Average (MA200). This reflects weakening bullish momentum and suggests that the market has entered a bearish corrective phase.
Key Support Zone & Expected Scenario
Price has now reached a major support zone at 0.00002000, which could serve as an important pivot area for a potential bullish rebound, particularly following the recent downside correction.
If this support zone successfully absorbs selling pressure and positive reversal signals begin to emerge, we could see an upward move targeting:
Potential Target: 0.00002525
Technical Signals Supporting the Scenario
Adding further weight to this potential setup is the presence of three consecutive descending trendlines (orange). Price is currently approaching a test of the third descending trendline.
Previous setups have shown bullish movements following breakouts above descending trendlines. Therefore, the current breakout attempt deserves close attention, as it could signal the end of the corrective phase and the beginning of a new bullish rebound.
Conclusion
The main focus is currently on the 0.00002000 support zone, while price approaches a potential breakout above the third descending trendline.
A successful rebound from support, combined with a confirmed trendline breakout, could open the door for an upward move toward 0.00002525.
Risk Consideration: This bullish scenario remains conditional on price holding above the key support zone and confirming the breakout. Trading below the 200-day Moving Average continues to reflect underlying weakness in the broader trend.
$FLOKI DYOR
2
1
1
37
·
--
Artikel
Übersetzung ansehen
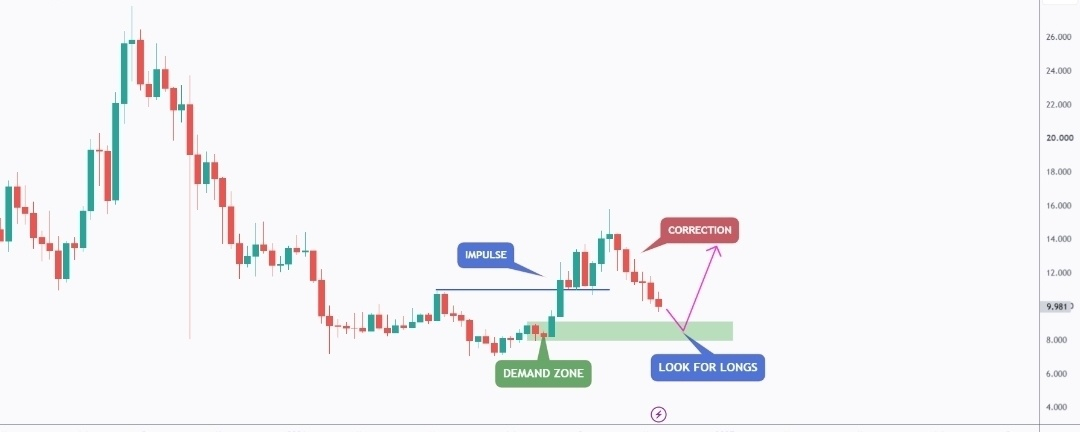
LINK - Correction Before the Next Bullish Impulse? LONGLINKUSDT 1W
CHAINLINK/USDT
LINK has recently shifted its momentum from bearish to bullish after breaking above its previous major high at $10.80, signaling a potential change in market structure.
Following this bullish impulse, price is currently going through a correction phase, pulling back toward a key demand zone.
Technical Outlook
The recent price action highlights two important phases:
Impulse: LINK broke above the $10.80 major high, confirming a bullish shift in momentum.
Correction: Price is now retracing toward the green demand zone around $8.00-$9.00, where buyers previously stepped in.
Preferred Scenario
As LINK approaches the green demand zone, we will be looking for bullish confirmation and potential long setups, aiming to catch the next bullish impulse movement.
As long as this demand zone holds, our bullish scenario remains valid.
Important Note
A bullish market doesn't move in a straight line. It typically alternates between impulse and correction phases.
The idea is not to chase the impulse, but to wait for the correction to offer a better entry opportunity.
However, a confirmed breakdown below the demand zone would weaken our bullish outlook and call for reassessment.
▲ Disclaimer: This analysis is for educational purposes only and does not constitute financial advice. Always manage your risk.
Plan Your Trade and Trade Your Plan.
All Strategies Are Good; If Managed
$LINK
{spot}(LINKUSDT)
LINK - Correction Before the Next Bullish Impulse? LONG
LINKUSDT 1W
CHAINLINK/USDT
LINK has recently shifted its momentum from bearish to bullish after breaking above its previous major high at $10.80, signaling a potential change in market structure.
Following this bullish impulse, price is currently going through a correction phase, pulling back toward a key demand zone.
Technical Outlook
The recent price action highlights two important phases:
Impulse: LINK broke above the $10.80 major high, confirming a bullish shift in momentum.
Correction: Price is now retracing toward the green demand zone around $8.00-$9.00, where buyers previously stepped in.
Preferred Scenario
As LINK approaches the green demand zone, we will be looking for bullish confirmation and potential long setups, aiming to catch the next bullish impulse movement.
As long as this demand zone holds, our bullish scenario remains valid.
Important Note
A bullish market doesn't move in a straight line. It typically alternates between impulse and correction phases.
The idea is not to chase the impulse, but to wait for the correction to offer a better entry opportunity.
However, a confirmed breakdown below the demand zone would weaken our bullish outlook and call for reassessment.
▲ Disclaimer: This analysis is for educational purposes only and does not constitute financial advice. Always manage your risk.
Plan Your Trade and Trade Your Plan.
All Strategies Are Good; If Managed
$LINK
CHAINLINK/USDT
LINK has recently shifted its momentum from bearish to bullish after breaking above its previous major high at $10.80, signaling a potential change in market structure.
Following this bullish impulse, price is currently going through a correction phase, pulling back toward a key demand zone.
Technical Outlook
The recent price action highlights two important phases:
Impulse: LINK broke above the $10.80 major high, confirming a bullish shift in momentum.
Correction: Price is now retracing toward the green demand zone around $8.00-$9.00, where buyers previously stepped in.
Preferred Scenario
As LINK approaches the green demand zone, we will be looking for bullish confirmation and potential long setups, aiming to catch the next bullish impulse movement.
As long as this demand zone holds, our bullish scenario remains valid.
Important Note
A bullish market doesn't move in a straight line. It typically alternates between impulse and correction phases.
The idea is not to chase the impulse, but to wait for the correction to offer a better entry opportunity.
However, a confirmed breakdown below the demand zone would weaken our bullish outlook and call for reassessment.
▲ Disclaimer: This analysis is for educational purposes only and does not constitute financial advice. Always manage your risk.
Plan Your Trade and Trade Your Plan.
All Strategies Are Good; If Managed
$LINK
2
2
3
187
·
--
Artikel
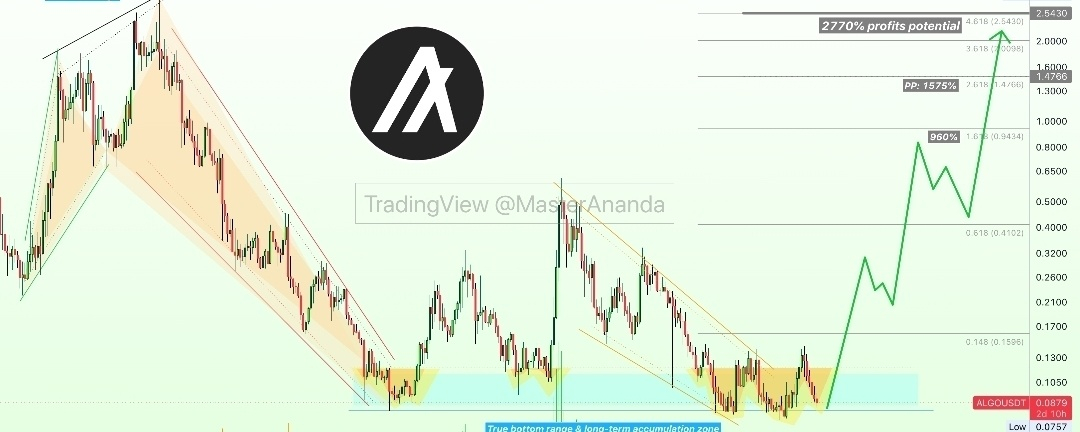
Algorand (ALGO) – Werde innerhalb weniger Jahre Multimillionär LONGALGOUSDT 1W
ALGORAND/TETHERUS Binance
Hier können wir einen echten Tiefpunkt mit einem Hoch und einem Allzeithoch vergleichen. Konzentrieren wir uns auf die technische Analyse und folgen wir dem Strom, wohin auch immer die Energie uns führt.
Dieselbe Preisspanne, die im Juni 2023 aktiv wurde, ist aktiviert und nun seit mehr als einem Jahr, genauer gesagt seit 13 Monaten, aktiv. Jedes Mal, wenn ein Kryptowährungsprojekt über einen längeren Zeitraum zu Tiefstkursen gehandelt wird, entwickelt sich ein Bullenmarkt ... Genau das sehen wir hier bei ALGO.
Wir erleben die stärkste und dynamischste Bärenmarktphase in der Geschichte dieses Projekts. Wir erleben die längste Akkumulationsphase am Tiefpunkt in der Geschichte von ALGOUSDT. Was als Nächstes folgt, ist der größte, stärkste und am längsten anhaltende Bullenmarkt, den du je bei Algorand gesehen hast. Diese Kryptowährung wird noch viele Jahre lang wachsen.
Algorand (ALGO) – Werde innerhalb weniger Jahre Multimillionär LONG
ALGOUSDT 1W
ALGORAND/TETHERUS Binance
Hier können wir einen echten Tiefpunkt mit einem Hoch und einem Allzeithoch vergleichen. Konzentrieren wir uns auf die technische Analyse und folgen wir dem Strom, wohin auch immer die Energie uns führt.
Dieselbe Preisspanne, die im Juni 2023 aktiv wurde, ist aktiviert und nun seit mehr als einem Jahr, genauer gesagt seit 13 Monaten, aktiv. Jedes Mal, wenn ein Kryptowährungsprojekt über einen längeren Zeitraum zu Tiefstkursen gehandelt wird, entwickelt sich ein Bullenmarkt ... Genau das sehen wir hier bei ALGO.
Wir erleben die stärkste und dynamischste Bärenmarktphase in der Geschichte dieses Projekts. Wir erleben die längste Akkumulationsphase am Tiefpunkt in der Geschichte von ALGOUSDT. Was als Nächstes folgt, ist der größte, stärkste und am längsten anhaltende Bullenmarkt, den du je bei Algorand gesehen hast. Diese Kryptowährung wird noch viele Jahre lang wachsen.
ALGORAND/TETHERUS Binance
Hier können wir einen echten Tiefpunkt mit einem Hoch und einem Allzeithoch vergleichen. Konzentrieren wir uns auf die technische Analyse und folgen wir dem Strom, wohin auch immer die Energie uns führt.
Dieselbe Preisspanne, die im Juni 2023 aktiv wurde, ist aktiviert und nun seit mehr als einem Jahr, genauer gesagt seit 13 Monaten, aktiv. Jedes Mal, wenn ein Kryptowährungsprojekt über einen längeren Zeitraum zu Tiefstkursen gehandelt wird, entwickelt sich ein Bullenmarkt ... Genau das sehen wir hier bei ALGO.
Wir erleben die stärkste und dynamischste Bärenmarktphase in der Geschichte dieses Projekts. Wir erleben die längste Akkumulationsphase am Tiefpunkt in der Geschichte von ALGOUSDT. Was als Nächstes folgt, ist der größte, stärkste und am längsten anhaltende Bullenmarkt, den du je bei Algorand gesehen hast. Diese Kryptowährung wird noch viele Jahre lang wachsen.
1
2
5
443
·
--
Bullisch
Übersetzung ansehen
GOLD - 1H CHART | END OF WEEK MARKET UPDATE
XAUUSD
GOLD
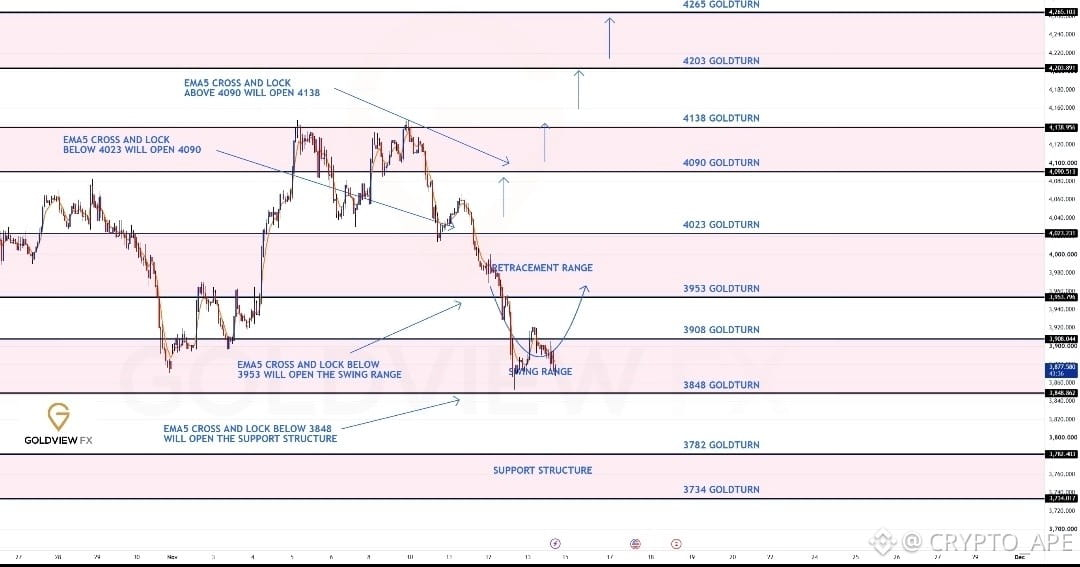
Following our previous analysis, the 3848 GOLDTURN swing range support delivered the reaction we were monitoring, with price bouncing all the way into 3908 GOLDTURN, as highlighted on our chart route map with 3953 GOLDTURN remaining our next target to complete the full swing move.
We will continue monitoring price behaviour around 3908, with 3848 remaining the key swing range support.
We will be back on Sunday with our updated chart route maps and trading plans for the week ahead.
Have a great weekend, everyone!
$XAUT $XAU DYOR
{spot}(XAUTUSDT)
GOLD - 1H CHART | END OF WEEK MARKET UPDATE
XAUUSD
GOLD
Following our previous analysis, the 3848 GOLDTURN swing range support delivered the reaction we were monitoring, with price bouncing all the way into 3908 GOLDTURN, as highlighted on our chart route map with 3953 GOLDTURN remaining our next target to complete the full swing move.
We will continue monitoring price behaviour around 3908, with 3848 remaining the key swing range support.
We will be back on Sunday with our updated chart route maps and trading plans for the week ahead.
Have a great weekend, everyone!
$XAUT $XAU DYOR
XAUUSD
GOLD
Following our previous analysis, the 3848 GOLDTURN swing range support delivered the reaction we were monitoring, with price bouncing all the way into 3908 GOLDTURN, as highlighted on our chart route map with 3953 GOLDTURN remaining our next target to complete the full swing move.
We will continue monitoring price behaviour around 3908, with 3848 remaining the key swing range support.
We will be back on Sunday with our updated chart route maps and trading plans for the week ahead.
Have a great weekend, everyone!
$XAUT $XAU DYOR
1
2
324
·
--
Bullisch
Übersetzung ansehen
PUMP/USDT: Key Supp - 97% Upside Potential?
PUMP/TETHERUS Binance
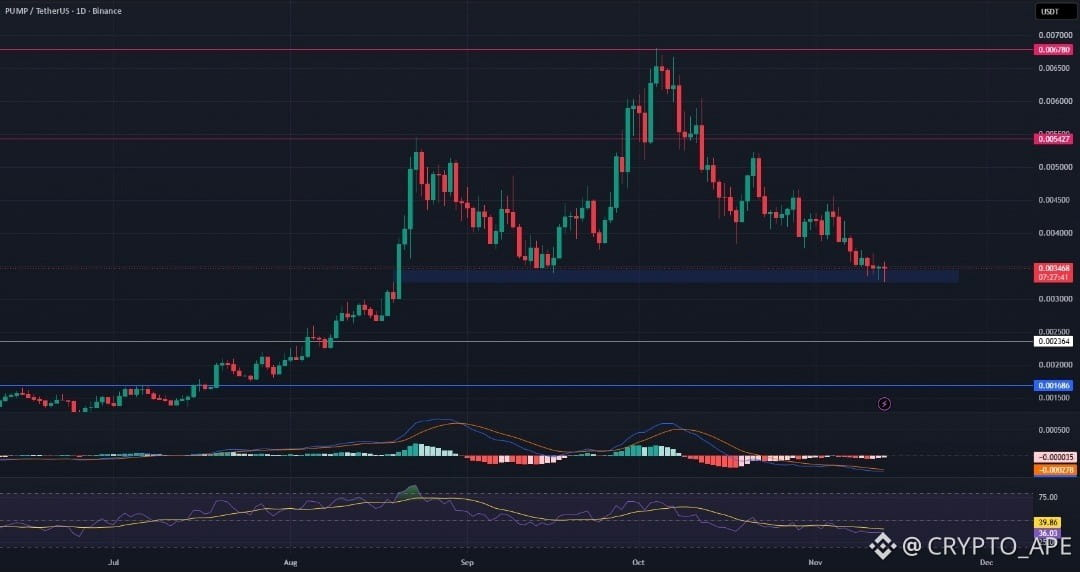
PUMP trades near $0.00345, testing a key support zone. RSI remains weak at 36, while MACD signals bearish momentum. A liquidity sweep and reclaim of $0.003440 is needed to confirm a potential long setup.
Fundamentally, Pump.fun's revenue and token buybacks offer support, but the 6.88B PUMP token unlock on November 14 could increase selling pressure.
If support holds, $0.005427 is the first resistance, followed by $0.006780 (+97%). A breakdown could push price toward $0.002364 and $0.001686.
Trade Levels
Entry: $0.003440 (after sweep & reclaim) Take Profit 1: $0.005427 (+58%) Take Profit 2: $0.006780 (+97%) Stop Loss: $0.002364 (-31%) Key Support: $0.001686
Setup Status: Awaiting confirmation
$PUMP DYOR
{spot}(PUMPUSDT)
PUMP/USDT: Key Supp - 97% Upside Potential?
PUMP/TETHERUS Binance
PUMP trades near $0.00345, testing a key support zone. RSI remains weak at 36, while MACD signals bearish momentum. A liquidity sweep and reclaim of $0.003440 is needed to confirm a potential long setup.
Fundamentally, Pump.fun's revenue and token buybacks offer support, but the 6.88B PUMP token unlock on November 14 could increase selling pressure.
If support holds, $0.005427 is the first resistance, followed by $0.006780 (+97%). A breakdown could push price toward $0.002364 and $0.001686.
Trade Levels
Entry: $0.003440 (after sweep & reclaim) Take Profit 1: $0.005427 (+58%) Take Profit 2: $0.006780 (+97%) Stop Loss: $0.002364 (-31%) Key Support: $0.001686
Setup Status: Awaiting confirmation
$PUMP DYOR
PUMP/TETHERUS Binance
PUMP trades near $0.00345, testing a key support zone. RSI remains weak at 36, while MACD signals bearish momentum. A liquidity sweep and reclaim of $0.003440 is needed to confirm a potential long setup.
Fundamentally, Pump.fun's revenue and token buybacks offer support, but the 6.88B PUMP token unlock on November 14 could increase selling pressure.
If support holds, $0.005427 is the first resistance, followed by $0.006780 (+97%). A breakdown could push price toward $0.002364 and $0.001686.
Trade Levels
Entry: $0.003440 (after sweep & reclaim) Take Profit 1: $0.005427 (+58%) Take Profit 2: $0.006780 (+97%) Stop Loss: $0.002364 (-31%) Key Support: $0.001686
Setup Status: Awaiting confirmation
$PUMP DYOR
2
1
2
153
·
--
✅Binance-Handelsturnier nötig...!
✅Binance-Booster-Kampagne nötig...!
✅Binance Learn and Earn nötig...!
✅Binance-Alpha-Airdrop benötigt 70/100 Punkte...!
✅Binance-Spin-Event nötig...!
✅Binance-Box-Event nötig...!
✅Binance-Event für neue Listings mit fester Belohnung nötig...!
✅Testnet wie in den alten Tagen nötig...!
🔥2024–2025 wieder nötig...!
............❤️🩹🫂............
@Binance_Labs @binance
✅Binance-Handelsturnier nötig...!
✅Binance-Booster-Kampagne nötig...!
✅Binance Learn and Earn nötig...!
✅Binance-Alpha-Airdrop benötigt 70/100 Punkte...!
✅Binance-Spin-Event nötig...!
✅Binance-Box-Event nötig...!
✅Binance-Event für neue Listings mit fester Belohnung nötig...!
✅Testnet wie in den alten Tagen nötig...!
🔥2024–2025 wieder nötig...!
............❤️🩹🫂............
@Binance Labs @binance
✅Binance-Booster-Kampagne nötig...!
✅Binance Learn and Earn nötig...!
✅Binance-Alpha-Airdrop benötigt 70/100 Punkte...!
✅Binance-Spin-Event nötig...!
✅Binance-Box-Event nötig...!
✅Binance-Event für neue Listings mit fester Belohnung nötig...!
✅Testnet wie in den alten Tagen nötig...!
🔥2024–2025 wieder nötig...!
............❤️🩹🫂............
@Binance Labs @binance
1
2
3
91
·
--
Bullisch
#ETH/USDT AKTUALISIERUNG
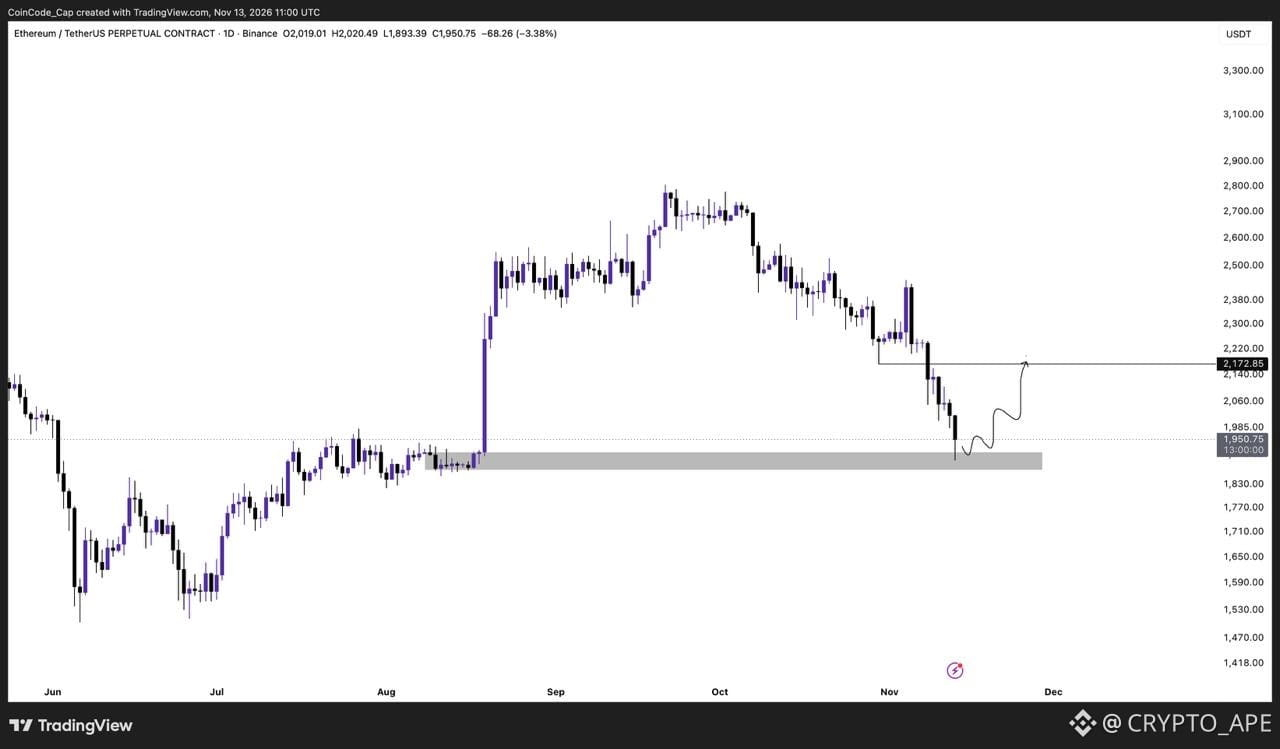
ETH steht unter starkem Abwärtsdruck und nähert sich der wichtigen Unterstützungszone bei etwa 1.900 $.
Ein Abprallen von dieser Nachfragezone könnte eine Erholungsrallye in Richtung 2.100–2.175 $ auslösen, wo sich ein Widerstand befindet.
$ETH Recherchiere selbst (DYOR)
{spot}(ETHUSDT)
#ETH/USDT AKTUALISIERUNG
ETH steht unter starkem Abwärtsdruck und nähert sich der wichtigen Unterstützungszone bei etwa 1.900 $.
Ein Abprallen von dieser Nachfragezone könnte eine Erholungsrallye in Richtung 2.100–2.175 $ auslösen, wo sich ein Widerstand befindet.
$ETH Recherchiere selbst (DYOR)
ETH steht unter starkem Abwärtsdruck und nähert sich der wichtigen Unterstützungszone bei etwa 1.900 $.
Ein Abprallen von dieser Nachfragezone könnte eine Erholungsrallye in Richtung 2.100–2.175 $ auslösen, wo sich ein Widerstand befindet.
$ETH Recherchiere selbst (DYOR)
2
1
2
203
·
--
Bullisch
#GOLD/USDT 🔥
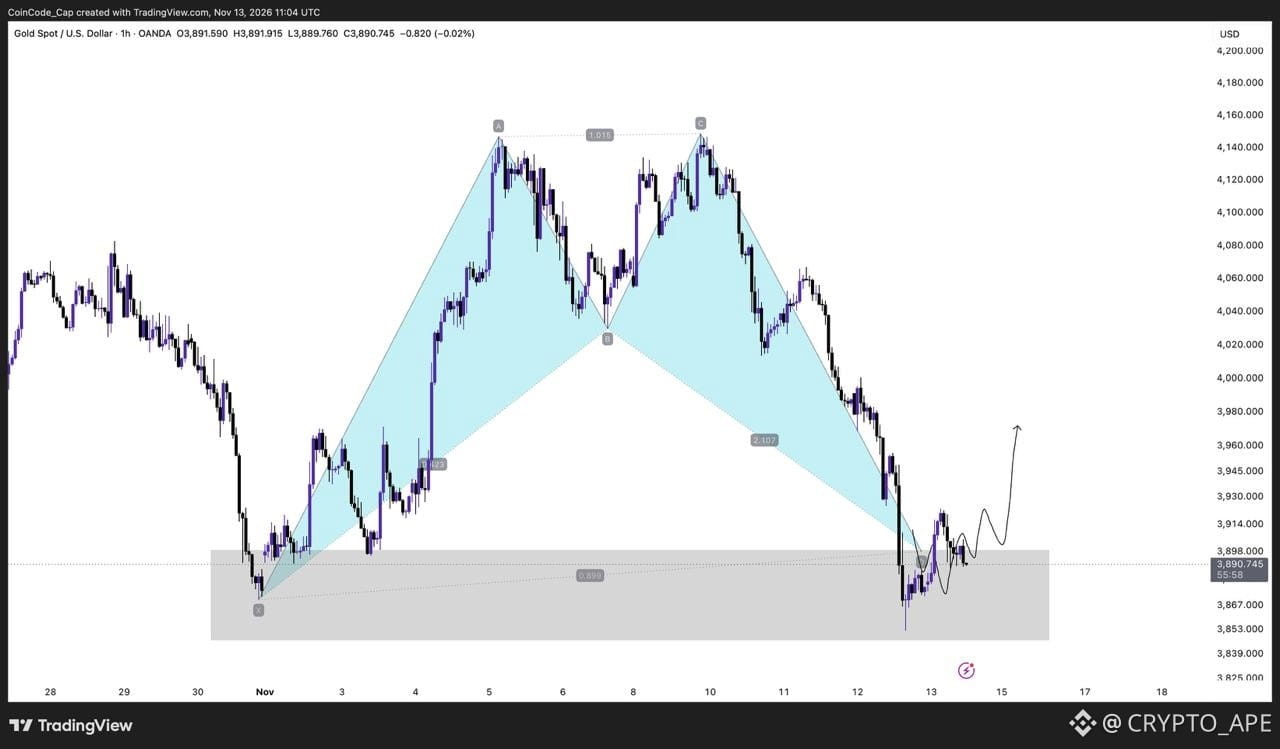
GOLD drehte genau wie analysiert von der markierten Zone um ✌️
$XAUT Recherchiere selbst
{spot}(XAUTUSDT)
#GOLD/USDT 🔥
GOLD drehte genau wie analysiert von der markierten Zone um ✌️
$XAUT Recherchiere selbst
GOLD drehte genau wie analysiert von der markierten Zone um ✌️
$XAUT Recherchiere selbst
2
2
352
·
--
Bullisch
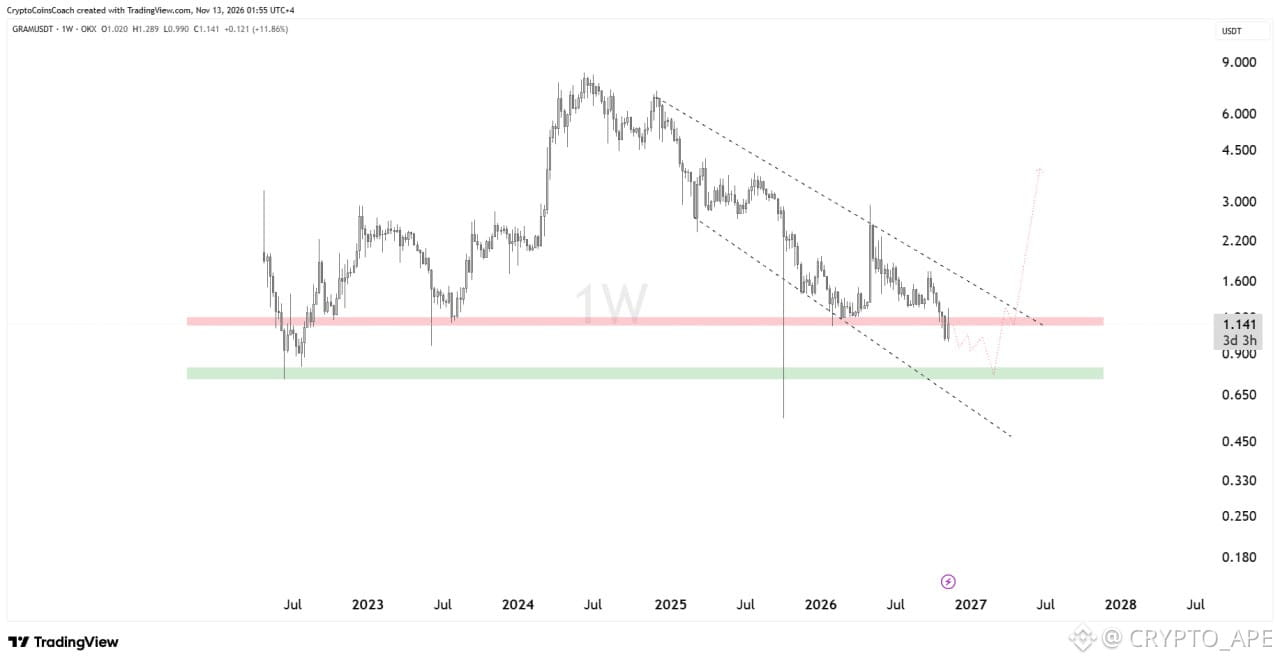
GRAM: Der Kurs bewegt sich weiterhin innerhalb eines größeren Abwärtskanals, doch nahe einer wichtigen historischen Unterstützungszone zeichnet sich ein interessantes Setup ab.
GRAM wird derzeit bei etwa 1,14 $ gehandelt und testet die Spanne von 1,10 bis 1,20 $. Dieser Bereich hat in der Vergangenheit als wichtige Unterstützung gedient.
Ich würde einen weiteren Kursrückgang ausschließen, bevor eine echte Erholung einsetzt. Die Zone von 0,70 bis 0,80 $ ist der wichtigste Nachfragebereich, den ich im Blick habe. Dort könnten Käufer möglicherweise einsteigen.
Wenn GRAM diesen Bereich halten kann und beginnt, höhere Tiefs auszubilden, könnte eine Erholung in Richtung 1,60 bis 2,20 $ folgen.
Ein bestätigter Ausbruch über den Abwärtskanal könnte längerfristig den Weg in Richtung 3,00 bis 4,00 $ ebnen.
Ein Fall unter 0,70 $ würde jedoch dieses bullische Erholungsszenario schwächen und das Risiko weiterer Kursverluste erhöhen.
Wichtige Kursmarken:
Aktueller Kurs: 1,14 $
Unmittelbare Unterstützung: 1,10 bis 1,20 $
Wichtige Nachfragezone: 0,70 bis 0,80 $
Erholungsziele: 1,60 bis 2,20 $
Bullische Ziele: 3,00 bis 4,00 $
Szenario hinfällig: unter 0,70 $
Im Moment stürze ich mich nicht auf dieses Setup. Der Abwärtskanal ist weiterhin intakt, und ich möchte eine klare Reaktion an der Unterstützung sehen, bevor ich mit einer deutlichen Trendwende rechne.
Manchmal ergeben sich die besten Chancen nach einem letzten Liquiditätsabgriff. Wir brauchen jedoch weiterhin eine Bestätigung, statt einfach anzunehmen, dass der Tiefpunkt bereits erreicht ist.
$GRAM Recherchiere selbst (DYOR)
{spot}(GRAMUSDT)
GRAM: Der Kurs bewegt sich weiterhin innerhalb eines größeren Abwärtskanals, doch nahe einer wichtigen historischen Unterstützungszone zeichnet sich ein interessantes Setup ab.
GRAM wird derzeit bei etwa 1,14 $ gehandelt und testet die Spanne von 1,10 bis 1,20 $. Dieser Bereich hat in der Vergangenheit als wichtige Unterstützung gedient.
Ich würde einen weiteren Kursrückgang ausschließen, bevor eine echte Erholung einsetzt. Die Zone von 0,70 bis 0,80 $ ist der wichtigste Nachfragebereich, den ich im Blick habe. Dort könnten Käufer möglicherweise einsteigen.
Wenn GRAM diesen Bereich halten kann und beginnt, höhere Tiefs auszubilden, könnte eine Erholung in Richtung 1,60 bis 2,20 $ folgen.
Ein bestätigter Ausbruch über den Abwärtskanal könnte längerfristig den Weg in Richtung 3,00 bis 4,00 $ ebnen.
Ein Fall unter 0,70 $ würde jedoch dieses bullische Erholungsszenario schwächen und das Risiko weiterer Kursverluste erhöhen.
Wichtige Kursmarken:
Aktueller Kurs: 1,14 $
Unmittelbare Unterstützung: 1,10 bis 1,20 $
Wichtige Nachfragezone: 0,70 bis 0,80 $
Erholungsziele: 1,60 bis 2,20 $
Bullische Ziele: 3,00 bis 4,00 $
Szenario hinfällig: unter 0,70 $
Im Moment stürze ich mich nicht auf dieses Setup. Der Abwärtskanal ist weiterhin intakt, und ich möchte eine klare Reaktion an der Unterstützung sehen, bevor ich mit einer deutlichen Trendwende rechne.
Manchmal ergeben sich die besten Chancen nach einem letzten Liquiditätsabgriff. Wir brauchen jedoch weiterhin eine Bestätigung, statt einfach anzunehmen, dass der Tiefpunkt bereits erreicht ist.
$GRAM Recherchiere selbst (DYOR)
GRAM wird derzeit bei etwa 1,14 $ gehandelt und testet die Spanne von 1,10 bis 1,20 $. Dieser Bereich hat in der Vergangenheit als wichtige Unterstützung gedient.
Ich würde einen weiteren Kursrückgang ausschließen, bevor eine echte Erholung einsetzt. Die Zone von 0,70 bis 0,80 $ ist der wichtigste Nachfragebereich, den ich im Blick habe. Dort könnten Käufer möglicherweise einsteigen.
Wenn GRAM diesen Bereich halten kann und beginnt, höhere Tiefs auszubilden, könnte eine Erholung in Richtung 1,60 bis 2,20 $ folgen.
Ein bestätigter Ausbruch über den Abwärtskanal könnte längerfristig den Weg in Richtung 3,00 bis 4,00 $ ebnen.
Ein Fall unter 0,70 $ würde jedoch dieses bullische Erholungsszenario schwächen und das Risiko weiterer Kursverluste erhöhen.
Wichtige Kursmarken:
Aktueller Kurs: 1,14 $
Unmittelbare Unterstützung: 1,10 bis 1,20 $
Wichtige Nachfragezone: 0,70 bis 0,80 $
Erholungsziele: 1,60 bis 2,20 $
Bullische Ziele: 3,00 bis 4,00 $
Szenario hinfällig: unter 0,70 $
Im Moment stürze ich mich nicht auf dieses Setup. Der Abwärtskanal ist weiterhin intakt, und ich möchte eine klare Reaktion an der Unterstützung sehen, bevor ich mit einer deutlichen Trendwende rechne.
Manchmal ergeben sich die besten Chancen nach einem letzten Liquiditätsabgriff. Wir brauchen jedoch weiterhin eine Bestätigung, statt einfach anzunehmen, dass der Tiefpunkt bereits erreicht ist.
$GRAM Recherchiere selbst (DYOR)
2
2
3
893
·
--
Bullisch
Übersetzung ansehen
📊 BTC WEEKLY MARKET UPDATE
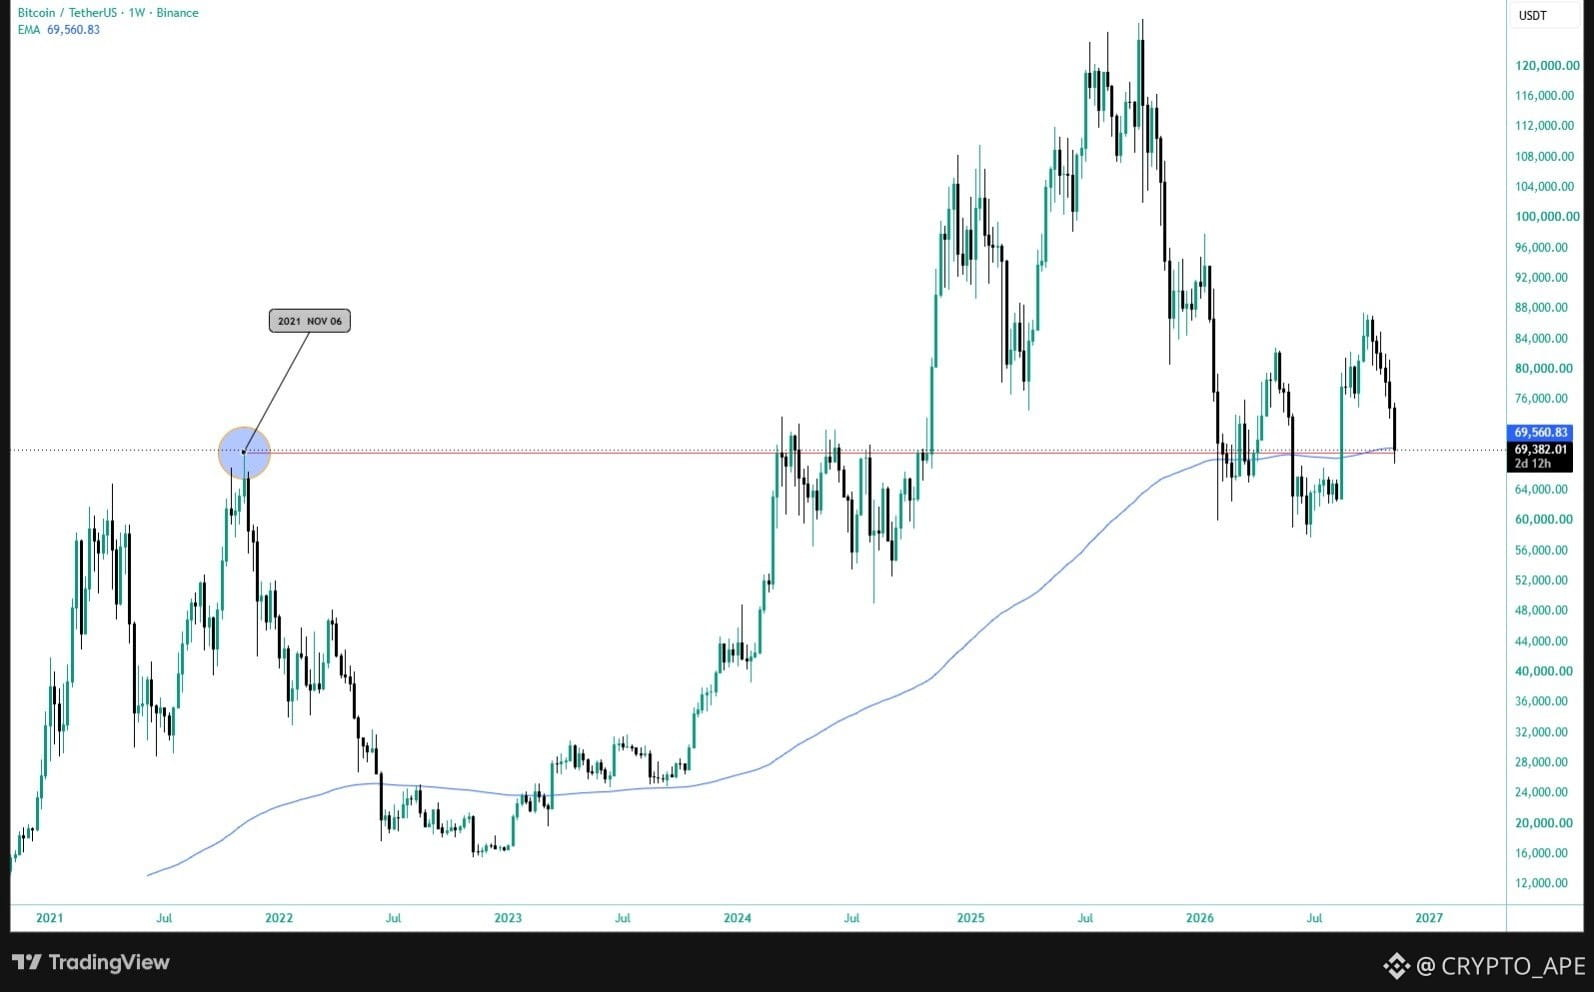
Bitcoin is currently trading around $69,300, retesting a major historical support zone near $69K — the previous November 2021 All-Time High (ATH).
The weekly 200 MA is also around $69,560, making this a key decision zone.
🟢 Bullish Scenario: Holding this zone and reclaiming $75K could open the way towards $83K–$87K.
🔴 Bearish Scenario: A confirmed weekly breakdown could expose $59K, followed by $52K.
📌 Market Outlook: Watch the weekly candle close and volume reaction for confirmation. Avoid rushing into positions.
$BTC DYOR
{spot}(BTCUSDT)
📊 BTC WEEKLY MARKET UPDATE
Bitcoin is currently trading around $69,300, retesting a major historical support zone near $69K — the previous November 2021 All-Time High (ATH).
The weekly 200 MA is also around $69,560, making this a key decision zone.
🟢 Bullish Scenario: Holding this zone and reclaiming $75K could open the way towards $83K–$87K.
🔴 Bearish Scenario: A confirmed weekly breakdown could expose $59K, followed by $52K.
📌 Market Outlook: Watch the weekly candle close and volume reaction for confirmation. Avoid rushing into positions.
$BTC DYOR
Bitcoin is currently trading around $69,300, retesting a major historical support zone near $69K — the previous November 2021 All-Time High (ATH).
The weekly 200 MA is also around $69,560, making this a key decision zone.
🟢 Bullish Scenario: Holding this zone and reclaiming $75K could open the way towards $83K–$87K.
🔴 Bearish Scenario: A confirmed weekly breakdown could expose $59K, followed by $52K.
📌 Market Outlook: Watch the weekly candle close and volume reaction for confirmation. Avoid rushing into positions.
$BTC DYOR
2
1
150
·
--
#BinancePick Ich lege heute meine täglichen Marktprognosen fest und sammle Punkte für die Bestenliste! Was sind gerade deine Top-Tipps für den Markt?
#BinancePick Ich lege heute meine täglichen Marktprognosen fest und sammle Punkte für die Bestenliste! Was sind gerade deine Top-Tipps für den Markt?

40
·
--
Bullisch
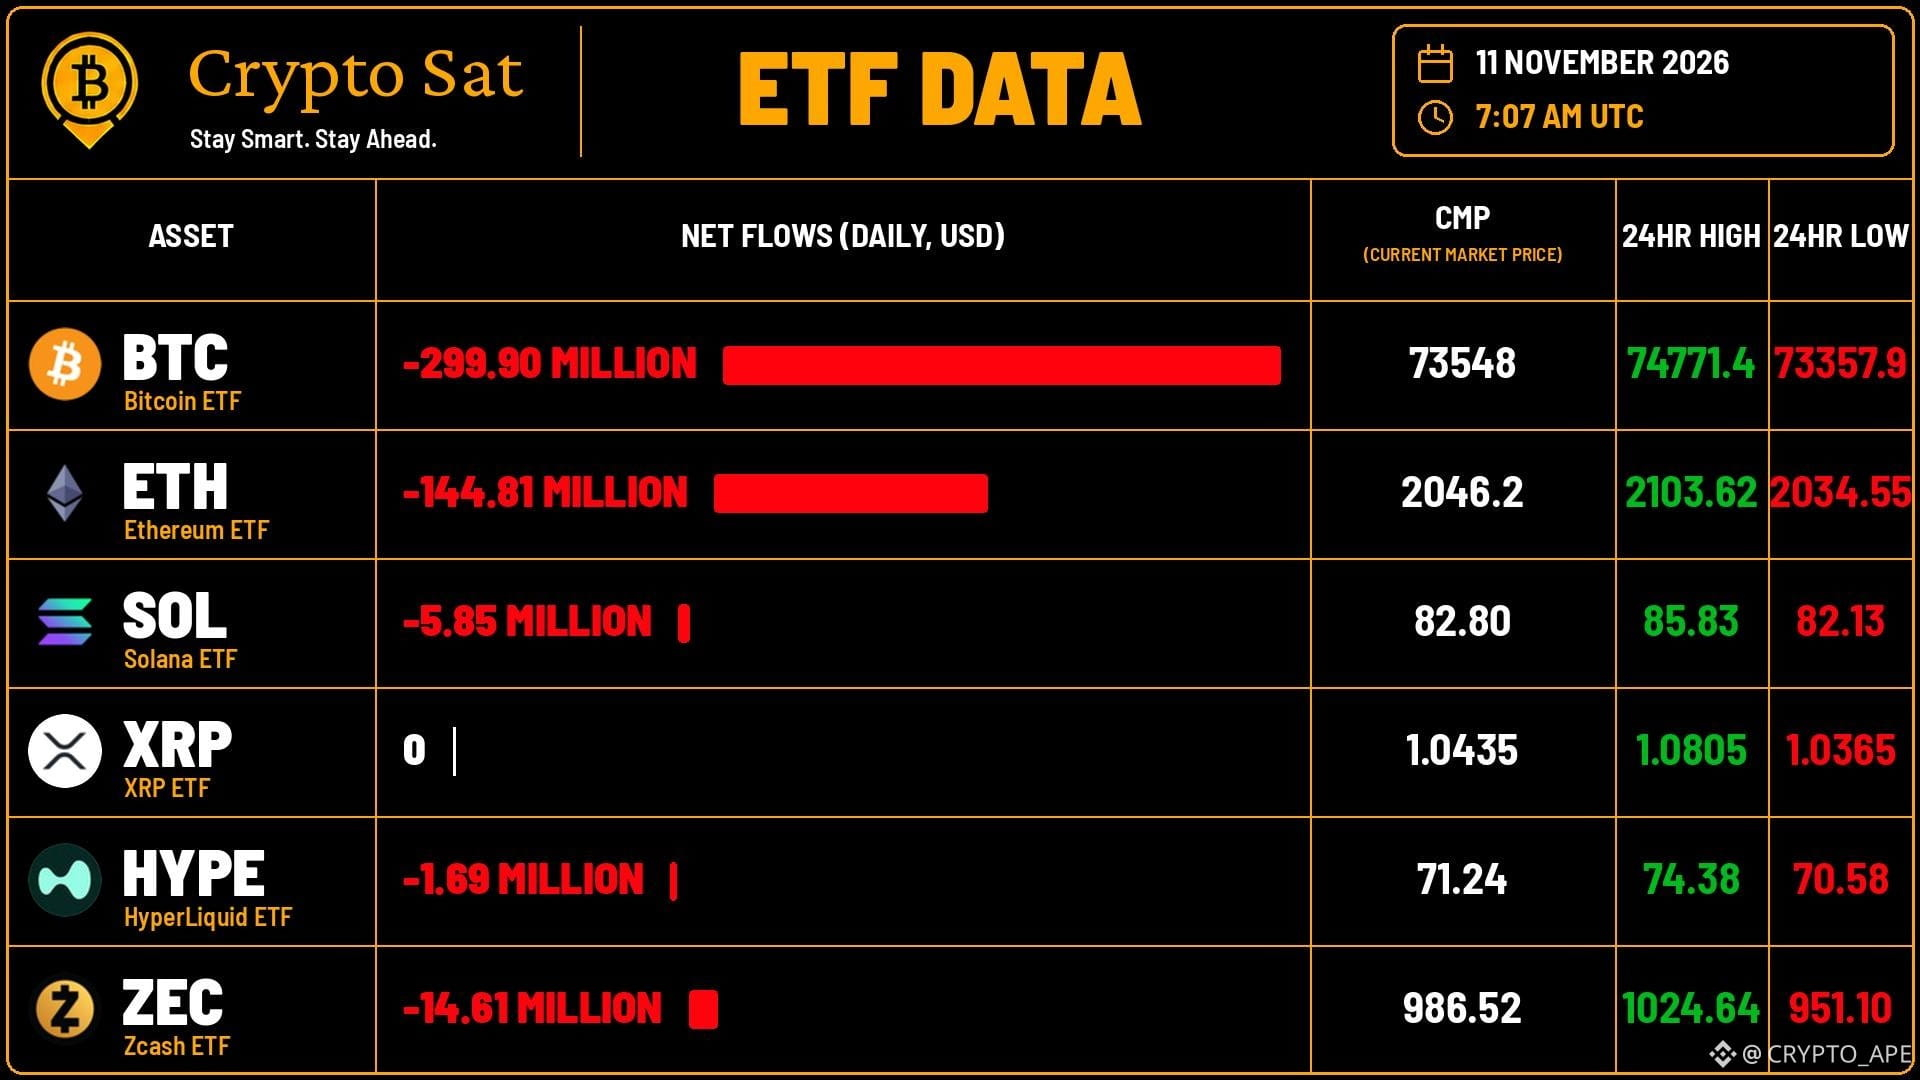
ETF-Flow-Update (11. November 2026)
• $BTC : -299,90 Millionen US-Dollar
• $ETH : -144,81 Millionen US-Dollar
• $XRP : 0 US-Dollar
• $SOL : -5,85 Millionen US-Dollar
• $HYPE : -1,69 Millionen US-Dollar
• $ZEC : -14,61 Millionen US-Dollar
Bitcoin-ETFs verzeichneten am 11. November starke Abflüsse in Höhe von 299,90 Mio. US-Dollar. Bei Ethereum gab es erhebliche Abflüsse von 144,81 Mio. US-Dollar, bei Solana Abflüsse von 5,85 Mio. US-Dollar. XRP blieb unverändert, Hyperliquid verzeichnete Abflüsse von 1,69 Mio. US-Dollar, während bei ZEC Abflüsse in Höhe von 14,61 Mio. US-Dollar zu verzeichnen waren.
$XRP
{spot}(ETHUSDT)
{spot}(XRPUSDT)
ETF-Flow-Update (11. November 2026)
• $BTC : -299,90 Millionen US-Dollar
• $ETH : -144,81 Millionen US-Dollar
• $XRP : 0 US-Dollar
• $SOL : -5,85 Millionen US-Dollar
• $HYPE : -1,69 Millionen US-Dollar
• $ZEC : -14,61 Millionen US-Dollar
Bitcoin-ETFs verzeichneten am 11. November starke Abflüsse in Höhe von 299,90 Mio. US-Dollar. Bei Ethereum gab es erhebliche Abflüsse von 144,81 Mio. US-Dollar, bei Solana Abflüsse von 5,85 Mio. US-Dollar. XRP blieb unverändert, Hyperliquid verzeichnete Abflüsse von 1,69 Mio. US-Dollar, während bei ZEC Abflüsse in Höhe von 14,61 Mio. US-Dollar zu verzeichnen waren.
$XRP
• $BTC : -299,90 Millionen US-Dollar
• $ETH : -144,81 Millionen US-Dollar
• $XRP : 0 US-Dollar
• $SOL : -5,85 Millionen US-Dollar
• $HYPE : -1,69 Millionen US-Dollar
• $ZEC : -14,61 Millionen US-Dollar
Bitcoin-ETFs verzeichneten am 11. November starke Abflüsse in Höhe von 299,90 Mio. US-Dollar. Bei Ethereum gab es erhebliche Abflüsse von 144,81 Mio. US-Dollar, bei Solana Abflüsse von 5,85 Mio. US-Dollar. XRP blieb unverändert, Hyperliquid verzeichnete Abflüsse von 1,69 Mio. US-Dollar, während bei ZEC Abflüsse in Höhe von 14,61 Mio. US-Dollar zu verzeichnen waren.
$XRP
112
·
--
Verifiziert
🚨 *PREDICT.FUN (PREDICT) TGE-UPDATE!* 🚀
📅 *Zeitpunkt der Wiederaufnahme des TGE-Events:*
⏰ *18. November 2026 — 9:00 Uhr UTC*
🎯 Nutzer, die *Prime-Sale-Keys* beansprucht haben, können ihren Kontostand überprüfen und *mit dem Handel auf Binance Alpha beginnen, sobald der PREDICT-Token live geht*! 🔥
🎉 *Bleibt bereit!* 🚀
🚨 *PREDICT.FUN (PREDICT) TGE-UPDATE!* 🚀
📅 *Zeitpunkt der Wiederaufnahme des TGE-Events:*
⏰ *18. November 2026 — 9:00 Uhr UTC*
🎯 Nutzer, die *Prime-Sale-Keys* beansprucht haben, können ihren Kontostand überprüfen und *mit dem Handel auf Binance Alpha beginnen, sobald der PREDICT-Token live geht*! 🔥
🎉 *Bleibt bereit!* 🚀
📅 *Zeitpunkt der Wiederaufnahme des TGE-Events:*
⏰ *18. November 2026 — 9:00 Uhr UTC*
🎯 Nutzer, die *Prime-Sale-Keys* beansprucht haben, können ihren Kontostand überprüfen und *mit dem Handel auf Binance Alpha beginnen, sobald der PREDICT-Token live geht*! 🔥
🎉 *Bleibt bereit!* 🚀
1
549
Anmelden und weiter Inhalte entdecken
Krypto-Nutzer weltweit auf Binance Square kennenlernen
⚡️ Bleib in Sachen Krypto stets am Puls.
💬 Die weltgrößte Kryptobörse vertraut darauf.
👍 Erhalte verlässliche Einblicke von verifizierten Creators.
E-Mail-Adresse/Telefonnummer
Trendthemen
USPPIMissMayEaseBTCPressure
90,737 Aufrufe
1,138 Kommentare
US-Erzeugerpreise steigen im Oktober im Jahresvergleich um 6,5 % und liegen damit leicht unter der Prognose von 6,6 %
Binance News
·18 Likes
·20.3k Aufrufe
MANTRAPausesUnstakingFor7DaysAfterKeplrSecurityIncident
309 Aufrufe
12 Kommentare
BitcoinCoreDisclosesTorTrafficVulnerability
41,709 Aufrufe
646 Kommentare