

R3N 1
553 Beiträge

R3N 1
Melden
Nutzer blockieren
Web3 & crypto Analyst || Breaking down market moves || token updates daily ➪NFA!!!
0 Following
3 Follower
3 Like gegeben
Beiträge
·
--
Übersetzung ansehen
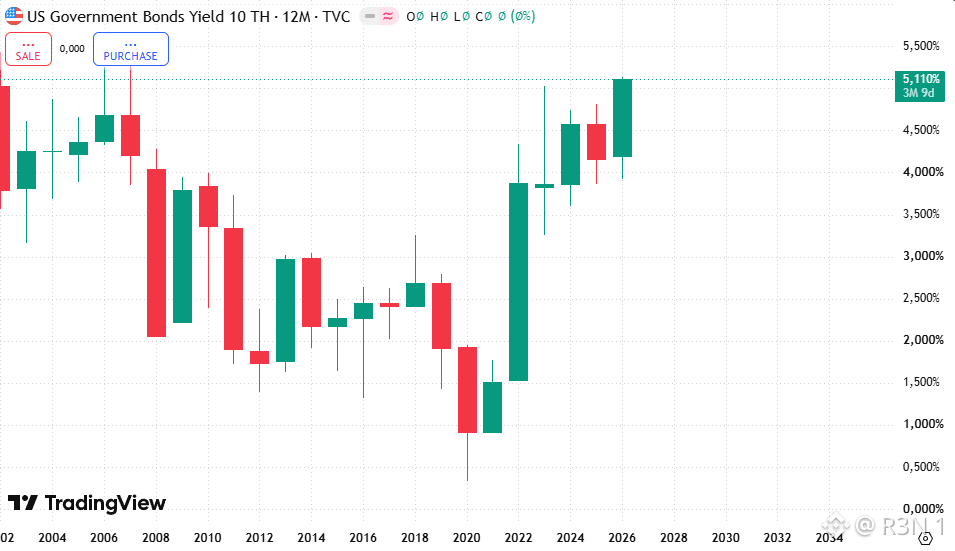
US Treasury yields have surged to the highest since 2007. The 10-year just made its sharpest one-day move in nearly 18 months, and it's happening the same week markets are pricing another Fed hike. That combination is the actual story, not the 2007 comparison alone. The 10-year climbed as high as 5.13% today, the highest since 2007, with the 30-year touching 5.4% and even the 5-year crossing 5% for the first time since before the financial crisis. Not an isolated spike either, yields already hit this same milestone eight days ago on September 15, retreated, and are now breaking fresh highs on top of that. What's driving today specifically is a stack of hawkish inputs landing together. Business activity data came in hotter than expected, the fastest pace in over five years per S&P Global, Fed governor Michael Barr said more hikes are needed, and oil pushed back above $103 a barrel. Trump backing a ban on US diesel exports added to supply concerns. Markets now price a 70% chance of another hike in October. Worth separating structural from acute here. Treasury Secretary Bessent has defended the bond buyback program as limiting how much worse this could've been, and he's running a separate operation propping up the yen specifically to stop Japan selling US debt, which would push yields even higher. Real intervention already happening, not hypothetical. What stands out to me is the mortgage pass-through, the 30-year fixed rate jumped to 7.26% today, highest since January 2025. That's the mechanism connecting a bond market story to actual household costs, and it moves faster than most realize. The open question isn't whether the Fed hikes again in October, close to priced in already. It's whether Treasury's interventions can keep pace with a selloff that's moved this sharply twice in eight trading days, since propping up demand on the margin is a different scale of problem than a one-time spike. #BTC Price Analysis# $BTC #BTC Price Analysis# $XAUt #Meme Alpha#
US Treasury yields have surged to the highest since 2007. The 10-year just made its sharpest one-day move in nearly 18 months, and it's happening the same week markets are pricing another Fed hike. That combination is the actual story, not the 2007 comparison alone. The 10-year climbed as high as 5.13% today, the highest since 2007, with the 30-year touching 5.4% and even the 5-year crossing 5% for the first time since before the financial crisis. Not an isolated spike either, yields already hit this same milestone eight days ago on September 15, retreated, and are now breaking fresh highs on top of that. What's driving today specifically is a stack of hawkish inputs landing together. Business activity data came in hotter than expected, the fastest pace in over five years per S&P Global, Fed governor Michael Barr said more hikes are needed, and oil pushed back above $103 a barrel. Trump backing a ban on US diesel exports added to supply concerns. Markets now price a 70% chance of another hike in October. Worth separating structural from acute here. Treasury Secretary Bessent has defended the bond buyback program as limiting how much worse this could've been, and he's running a separate operation propping up the yen specifically to stop Japan selling US debt, which would push yields even higher. Real intervention already happening, not hypothetical. What stands out to me is the mortgage pass-through, the 30-year fixed rate jumped to 7.26% today, highest since January 2025. That's the mechanism connecting a bond market story to actual household costs, and it moves faster than most realize. The open question isn't whether the Fed hikes again in October, close to priced in already. It's whether Treasury's interventions can keep pace with a selloff that's moved this sharply twice in eight trading days, since propping up demand on the margin is a different scale of problem than a one-time spike. #BTC Price Analysis# $BTC #BTC Price Analysis# $XAUt #Meme Alpha#
24
·
--
Übersetzung ansehen
BTC is actually down 2.88% today , moving in that direction rather than away from it. Worth updating the read on that alone.
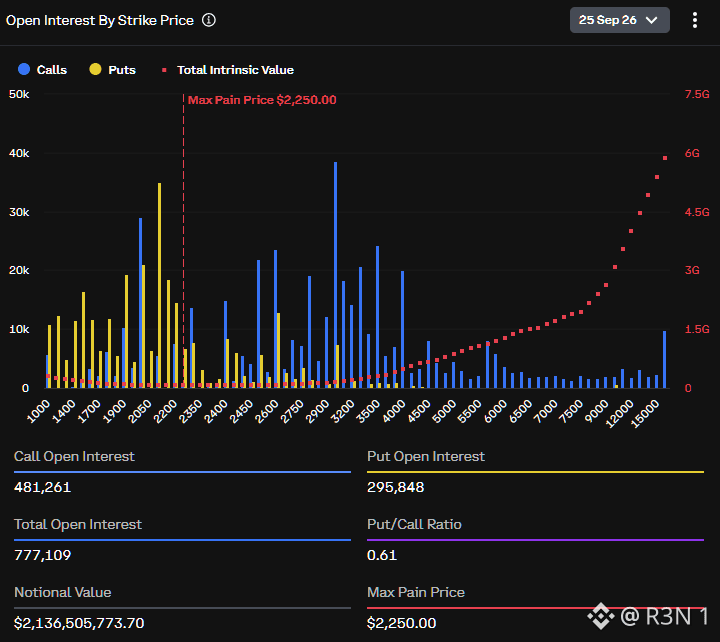
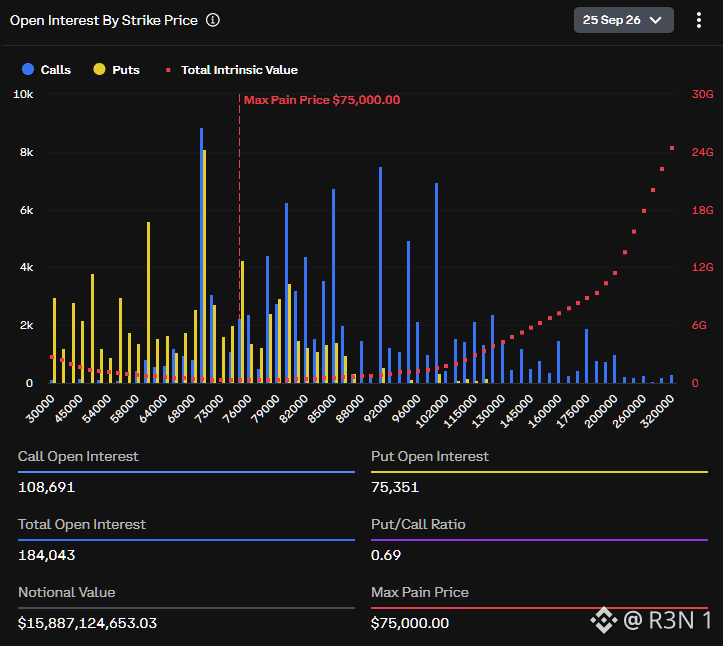
Max pain theory holds that price gravitates toward the strike where the most option contracts expire worthless, benefiting sellers, as market makers hedge their books into expiry. It's a genuinely debated mechanic though, not a reliable predictive tool, and a $10,000 gap this large going in is unusual enough that I'd have treated the pull toward it as weak, until today's move.
What still argues against a full drag toward $75,000 specifically is the standing positioning. BTC call open interest sits at $9.61 billion against $6.52 billion in puts, a put to call ratio around 0.68, genuinely lopsided bullish, with the heaviest call concentration at $90,000 and $100,000, both well above current price. That's a book positioned for continuation, working against the max pain pull, not with it. Today's red candle doesn't erase that positioning, it just means price and options flow are pulling in opposite directions right now.
My honest read: this is genuinely two forces in tension, not a settled direction. Today's decline shows real downward pressure exists, but the option book itself is still betting heavily on upside above $90,000. Large expiries tend to produce real volatility as positions close or roll, the actual settlement direction isn't decided by either force alone.
What I'm watching: whether this pullback continues toward max pain into Friday, or whether it's a temporary dip inside a book still positioned for $90,000 and higher.
$BTC #Bitcoin Price Prediction: What is Bitcoins next move?#
BTC is actually down 2.88% today , moving in that direction rather than away from it. Worth updating the read on that alone.
Max pain theory holds that price gravitates toward the strike where the most option contracts expire worthless, benefiting sellers, as market makers hedge their books into expiry. It's a genuinely debated mechanic though, not a reliable predictive tool, and a $10,000 gap this large going in is unusual enough that I'd have treated the pull toward it as weak, until today's move.
What still argues against a full drag toward $75,000 specifically is the standing positioning. BTC call open interest sits at $9.61 billion against $6.52 billion in puts, a put to call ratio around 0.68, genuinely lopsided bullish, with the heaviest call concentration at $90,000 and $100,000, both well above current price. That's a book positioned for continuation, working against the max pain pull, not with it. Today's red candle doesn't erase that positioning, it just means price and options flow are pulling in opposite directions right now.
My honest read: this is genuinely two forces in tension, not a settled direction. Today's decline shows real downward pressure exists, but the option book itself is still betting heavily on upside above $90,000. Large expiries tend to produce real volatility as positions close or roll, the actual settlement direction isn't decided by either force alone.
What I'm watching: whether this pullback continues toward max pain into Friday, or whether it's a temporary dip inside a book still positioned for $90,000 and higher.
$BTC #Bitcoin Price Prediction: What is Bitcoins next move?#
Max pain theory holds that price gravitates toward the strike where the most option contracts expire worthless, benefiting sellers, as market makers hedge their books into expiry. It's a genuinely debated mechanic though, not a reliable predictive tool, and a $10,000 gap this large going in is unusual enough that I'd have treated the pull toward it as weak, until today's move.
What still argues against a full drag toward $75,000 specifically is the standing positioning. BTC call open interest sits at $9.61 billion against $6.52 billion in puts, a put to call ratio around 0.68, genuinely lopsided bullish, with the heaviest call concentration at $90,000 and $100,000, both well above current price. That's a book positioned for continuation, working against the max pain pull, not with it. Today's red candle doesn't erase that positioning, it just means price and options flow are pulling in opposite directions right now.
My honest read: this is genuinely two forces in tension, not a settled direction. Today's decline shows real downward pressure exists, but the option book itself is still betting heavily on upside above $90,000. Large expiries tend to produce real volatility as positions close or roll, the actual settlement direction isn't decided by either force alone.
What I'm watching: whether this pullback continues toward max pain into Friday, or whether it's a temporary dip inside a book still positioned for $90,000 and higher.
$BTC #Bitcoin Price Prediction: What is Bitcoins next move?#
34
·
--
$18,1 Milliarden an BTC- und ETH-Optionen laufen am Freitag aus, und BTC handelt rund $11.000 über dem mit diesem Ereignis verknüpften „Max Pain“-Niveau. Es lohnt sich, diese Lücke direkt anzusprechen: Wenn der „Max Pain“ tatsächlich bei $75.000 liegt, während der Spot bei $86.000 plus notiert, ist das eine ungewöhnlich große Abweichung, und ich würde diese Zahl gern bestätigt sehen, bevor man sie als geklärt betrachtet.
Das Ausmaß selbst passt jedoch sauber. Laut Deribit-Daten liegt das Open Interest für BTC bei $16,13 Milliarden, für ETH bei $2,16 Milliarden; das stimmt mit der eigenen kombinierten Schätzung von Coinbase von $18,1 Milliarden überein. Die Positionierung ist tatsächlich deutlich zugunsten von Calls verschoben: BTC-Call-Open-Interest liegt bei $9,61 Milliarden gegenüber $6,52 Milliarden bei Puts, das ergibt ein Put-to-Call-Verhältnis von etwa 0,68. Und diese Schieflage soll sich in den jüngsten Flows noch verstärkt haben – nicht nur im bestehenden Orderbuch. Die stärkste Call-Konzentration liegt bei $90.000 und $100.000 bei BTC, während sie bei ETH zwischen $3.000 und $4.000 verteilt ist.
Was diese Positionierung dir sagt, ist wichtiger als die Dollar-Zahl. Ein Call-lastiges Orderbuch mit Strikes, die über dem aktuellen Kurs gebündelt sind, spiegelt die Erwartung von Händlern wider, dass der Trend fortgesetzt wird – nicht zwingend, dass sie das exakt vorhersagen. Die „Max Pain“-Theorie geht davon aus, dass sich der Preis zu dem Strike bewegt, bei dem die meisten Kontrakte wertlos auslaufen, wodurch Optionsverkäufer profitieren. Das ist jedoch ein umstrittenes Mechanik-Modell, nicht garantiert, und große Fälligkeiten bringen typischerweise echte Volatilität mit sich, wenn Positionen geschlossen oder gerollt werden – statt wie ein sauberer Pin auf einem einzigen Niveau zu enden.
Mein ehrliches Fazit: Die Größe und die richtungsbezogene Schieflage hier sind real und gut dokumentiert – eine echte bullish ausgerichtete Positionierung auf Freitag hin. Aber ich würde die Angabe von $75.000 „Max Pain“ speziell verifiziert haben wollen, bevor ich sie erneut verwende, da sie nicht mit dem übereinstimmt, wo BTC gerade tatsächlich gehandelt wird.
Worauf ich achte: wie sich der Kurs in Relation zum $90.000-Strike konkret verhält, während sich die Preisfindung am Freitag nähert – denn dort sitzt die größte Call-Konzentration.
$BTC #BTC Price Analysis# #Altcoin Season# $ETH
$18,1 Milliarden an BTC- und ETH-Optionen laufen am Freitag aus, und BTC handelt rund $11.000 über dem mit diesem Ereignis verknüpften „Max Pain“-Niveau. Es lohnt sich, diese Lücke direkt anzusprechen: Wenn der „Max Pain“ tatsächlich bei $75.000 liegt, während der Spot bei $86.000 plus notiert, ist das eine ungewöhnlich große Abweichung, und ich würde diese Zahl gern bestätigt sehen, bevor man sie als geklärt betrachtet.
Das Ausmaß selbst passt jedoch sauber. Laut Deribit-Daten liegt das Open Interest für BTC bei $16,13 Milliarden, für ETH bei $2,16 Milliarden; das stimmt mit der eigenen kombinierten Schätzung von Coinbase von $18,1 Milliarden überein. Die Positionierung ist tatsächlich deutlich zugunsten von Calls verschoben: BTC-Call-Open-Interest liegt bei $9,61 Milliarden gegenüber $6,52 Milliarden bei Puts, das ergibt ein Put-to-Call-Verhältnis von etwa 0,68. Und diese Schieflage soll sich in den jüngsten Flows noch verstärkt haben – nicht nur im bestehenden Orderbuch. Die stärkste Call-Konzentration liegt bei $90.000 und $100.000 bei BTC, während sie bei ETH zwischen $3.000 und $4.000 verteilt ist.
Was diese Positionierung dir sagt, ist wichtiger als die Dollar-Zahl. Ein Call-lastiges Orderbuch mit Strikes, die über dem aktuellen Kurs gebündelt sind, spiegelt die Erwartung von Händlern wider, dass der Trend fortgesetzt wird – nicht zwingend, dass sie das exakt vorhersagen. Die „Max Pain“-Theorie geht davon aus, dass sich der Preis zu dem Strike bewegt, bei dem die meisten Kontrakte wertlos auslaufen, wodurch Optionsverkäufer profitieren. Das ist jedoch ein umstrittenes Mechanik-Modell, nicht garantiert, und große Fälligkeiten bringen typischerweise echte Volatilität mit sich, wenn Positionen geschlossen oder gerollt werden – statt wie ein sauberer Pin auf einem einzigen Niveau zu enden.
Mein ehrliches Fazit: Die Größe und die richtungsbezogene Schieflage hier sind real und gut dokumentiert – eine echte bullish ausgerichtete Positionierung auf Freitag hin. Aber ich würde die Angabe von $75.000 „Max Pain“ speziell verifiziert haben wollen, bevor ich sie erneut verwende, da sie nicht mit dem übereinstimmt, wo BTC gerade tatsächlich gehandelt wird.
Worauf ich achte: wie sich der Kurs in Relation zum $90.000-Strike konkret verhält, während sich die Preisfindung am Freitag nähert – denn dort sitzt die größte Call-Konzentration.
$BTC #BTC Price Analysis# #Altcoin Season# $ETH
Das Ausmaß selbst passt jedoch sauber. Laut Deribit-Daten liegt das Open Interest für BTC bei $16,13 Milliarden, für ETH bei $2,16 Milliarden; das stimmt mit der eigenen kombinierten Schätzung von Coinbase von $18,1 Milliarden überein. Die Positionierung ist tatsächlich deutlich zugunsten von Calls verschoben: BTC-Call-Open-Interest liegt bei $9,61 Milliarden gegenüber $6,52 Milliarden bei Puts, das ergibt ein Put-to-Call-Verhältnis von etwa 0,68. Und diese Schieflage soll sich in den jüngsten Flows noch verstärkt haben – nicht nur im bestehenden Orderbuch. Die stärkste Call-Konzentration liegt bei $90.000 und $100.000 bei BTC, während sie bei ETH zwischen $3.000 und $4.000 verteilt ist.
Was diese Positionierung dir sagt, ist wichtiger als die Dollar-Zahl. Ein Call-lastiges Orderbuch mit Strikes, die über dem aktuellen Kurs gebündelt sind, spiegelt die Erwartung von Händlern wider, dass der Trend fortgesetzt wird – nicht zwingend, dass sie das exakt vorhersagen. Die „Max Pain“-Theorie geht davon aus, dass sich der Preis zu dem Strike bewegt, bei dem die meisten Kontrakte wertlos auslaufen, wodurch Optionsverkäufer profitieren. Das ist jedoch ein umstrittenes Mechanik-Modell, nicht garantiert, und große Fälligkeiten bringen typischerweise echte Volatilität mit sich, wenn Positionen geschlossen oder gerollt werden – statt wie ein sauberer Pin auf einem einzigen Niveau zu enden.
Mein ehrliches Fazit: Die Größe und die richtungsbezogene Schieflage hier sind real und gut dokumentiert – eine echte bullish ausgerichtete Positionierung auf Freitag hin. Aber ich würde die Angabe von $75.000 „Max Pain“ speziell verifiziert haben wollen, bevor ich sie erneut verwende, da sie nicht mit dem übereinstimmt, wo BTC gerade tatsächlich gehandelt wird.
Worauf ich achte: wie sich der Kurs in Relation zum $90.000-Strike konkret verhält, während sich die Preisfindung am Freitag nähert – denn dort sitzt die größte Call-Konzentration.
$BTC #BTC Price Analysis# #Altcoin Season# $ETH
53
·
--
BlackRock hat gerade eine Studie veröffentlicht, die argumentiert, dass KI ein unterschätzter Nachfragetreiber für Krypto sein könnte – spezifischer, als es die Schlagzeile vermuten lässt. Zuerst darauf hinzuweisen lohnt sich: Ich konnte weder die Zahl „$15 Billionen“ noch die Formulierung „MASSIVE demand engine“ irgendwo in der tatsächlichen Berichterstattung finden. Diese Einordnung scheint nicht von BlackRock selbst zu stammen.
Die Studie, „The Machine-Native Economy“, veröffentlicht am 22. September, lässt sich in zwei tragende Themen aufteilen. Erstens geht es um Zahlungen von Maschine zu Maschine: Wenn KI-Agenten autonom Transaktionen ausführen, kaufen sie Daten, APIs, Rechenleistung kontinuierlich, traditionelle Abwicklungswege stoßen dabei an Grenzen bei Beträgen im Sub-Cent-Bereich, bei 24/7-Settlement – und Stablecoins sind strukturell besser geeignet. Sie nennen über 11 Billionen US-Dollar an adjustiertem Stablecoin-Volumen im Jahr 2025 als bestehende Basis – plus reale entstehende Protokolle wie x402, das „Machine Payments Protocol“ von Stripe/Tempo und das „Agentic Commerce Protocol“ von Stripe/OpenAI.
Zweiter Strang ist „Compute“ als tokenisierbares Asset: GPU-Zugriff als übertragbare Verträge, nutzbar als Sicherheiten (Collateral) und handelbar über Protokolle wie MCP und A2A. Die Zahl von 1,1 Billionen US-Dollar ist eine Projektion für die Cloud-Umsätze großer Hyperscaler bis 2030 – also eine 29%-CAGR gegenüber dem Niveau von 2025. Das ist die Marktgröße, nicht eine kryptospezifische Zahl.
Was für mich auffällt, ist der eigene Hinweis von BlackRock: Tokenisierung beseitigt nicht bestehende Anforderungen – KYC, AML und die Eignungsregeln gelten weiterhin auch on-chain. Das ist ein realer Hedge gegen Lesarten, wonach hier Regulierung umgangen würde.
Es lohnt sich, den spekulativen Abstand hier klar anzusprechen. Das ist eine Framework-Studie, kein Beleg dafür, dass davon irgendetwas in größerem Maßstab bereits passiert. Selbst in der eigenen Formulierung von BlackRock bleibt es bei „could“ (könnte), nicht bei „is“ (ist).
Die offene Frage ist nicht, ob KI-Agenten irgendwann Zahlungs-Infrastrukturen brauchen – diese Logik ist plausibel. Es geht vielmehr darum, ob Stablecoins und tokenisierte Rechenleistung die dominante Schiene werden, oder ob das traditionelle Finanzsystem schnell genug adaptiert, sodass Krypto nicht notwendig ist, um diese Nachfrage zu bedienen.
$BTC #BTC Price Analysis# #Altcoin Season# $ETH
BlackRock hat gerade eine Studie veröffentlicht, die argumentiert, dass KI ein unterschätzter Nachfragetreiber für Krypto sein könnte – spezifischer, als es die Schlagzeile vermuten lässt. Zuerst darauf hinzuweisen lohnt sich: Ich konnte weder die Zahl „$15 Billionen“ noch die Formulierung „MASSIVE demand engine“ irgendwo in der tatsächlichen Berichterstattung finden. Diese Einordnung scheint nicht von BlackRock selbst zu stammen.
Die Studie, „The Machine-Native Economy“, veröffentlicht am 22. September, lässt sich in zwei tragende Themen aufteilen. Erstens geht es um Zahlungen von Maschine zu Maschine: Wenn KI-Agenten autonom Transaktionen ausführen, kaufen sie Daten, APIs, Rechenleistung kontinuierlich, traditionelle Abwicklungswege stoßen dabei an Grenzen bei Beträgen im Sub-Cent-Bereich, bei 24/7-Settlement – und Stablecoins sind strukturell besser geeignet. Sie nennen über 11 Billionen US-Dollar an adjustiertem Stablecoin-Volumen im Jahr 2025 als bestehende Basis – plus reale entstehende Protokolle wie x402, das „Machine Payments Protocol“ von Stripe/Tempo und das „Agentic Commerce Protocol“ von Stripe/OpenAI.
Zweiter Strang ist „Compute“ als tokenisierbares Asset: GPU-Zugriff als übertragbare Verträge, nutzbar als Sicherheiten (Collateral) und handelbar über Protokolle wie MCP und A2A. Die Zahl von 1,1 Billionen US-Dollar ist eine Projektion für die Cloud-Umsätze großer Hyperscaler bis 2030 – also eine 29%-CAGR gegenüber dem Niveau von 2025. Das ist die Marktgröße, nicht eine kryptospezifische Zahl.
Was für mich auffällt, ist der eigene Hinweis von BlackRock: Tokenisierung beseitigt nicht bestehende Anforderungen – KYC, AML und die Eignungsregeln gelten weiterhin auch on-chain. Das ist ein realer Hedge gegen Lesarten, wonach hier Regulierung umgangen würde.
Es lohnt sich, den spekulativen Abstand hier klar anzusprechen. Das ist eine Framework-Studie, kein Beleg dafür, dass davon irgendetwas in größerem Maßstab bereits passiert. Selbst in der eigenen Formulierung von BlackRock bleibt es bei „could“ (könnte), nicht bei „is“ (ist).
Die offene Frage ist nicht, ob KI-Agenten irgendwann Zahlungs-Infrastrukturen brauchen – diese Logik ist plausibel. Es geht vielmehr darum, ob Stablecoins und tokenisierte Rechenleistung die dominante Schiene werden, oder ob das traditionelle Finanzsystem schnell genug adaptiert, sodass Krypto nicht notwendig ist, um diese Nachfrage zu bedienen.
$BTC #BTC Price Analysis# #Altcoin Season# $ETH
Die Studie, „The Machine-Native Economy“, veröffentlicht am 22. September, lässt sich in zwei tragende Themen aufteilen. Erstens geht es um Zahlungen von Maschine zu Maschine: Wenn KI-Agenten autonom Transaktionen ausführen, kaufen sie Daten, APIs, Rechenleistung kontinuierlich, traditionelle Abwicklungswege stoßen dabei an Grenzen bei Beträgen im Sub-Cent-Bereich, bei 24/7-Settlement – und Stablecoins sind strukturell besser geeignet. Sie nennen über 11 Billionen US-Dollar an adjustiertem Stablecoin-Volumen im Jahr 2025 als bestehende Basis – plus reale entstehende Protokolle wie x402, das „Machine Payments Protocol“ von Stripe/Tempo und das „Agentic Commerce Protocol“ von Stripe/OpenAI.
Zweiter Strang ist „Compute“ als tokenisierbares Asset: GPU-Zugriff als übertragbare Verträge, nutzbar als Sicherheiten (Collateral) und handelbar über Protokolle wie MCP und A2A. Die Zahl von 1,1 Billionen US-Dollar ist eine Projektion für die Cloud-Umsätze großer Hyperscaler bis 2030 – also eine 29%-CAGR gegenüber dem Niveau von 2025. Das ist die Marktgröße, nicht eine kryptospezifische Zahl.
Was für mich auffällt, ist der eigene Hinweis von BlackRock: Tokenisierung beseitigt nicht bestehende Anforderungen – KYC, AML und die Eignungsregeln gelten weiterhin auch on-chain. Das ist ein realer Hedge gegen Lesarten, wonach hier Regulierung umgangen würde.
Es lohnt sich, den spekulativen Abstand hier klar anzusprechen. Das ist eine Framework-Studie, kein Beleg dafür, dass davon irgendetwas in größerem Maßstab bereits passiert. Selbst in der eigenen Formulierung von BlackRock bleibt es bei „could“ (könnte), nicht bei „is“ (ist).
Die offene Frage ist nicht, ob KI-Agenten irgendwann Zahlungs-Infrastrukturen brauchen – diese Logik ist plausibel. Es geht vielmehr darum, ob Stablecoins und tokenisierte Rechenleistung die dominante Schiene werden, oder ob das traditionelle Finanzsystem schnell genug adaptiert, sodass Krypto nicht notwendig ist, um diese Nachfrage zu bedienen.
$BTC #BTC Price Analysis# #Altcoin Season# $ETH

69
·
--
„1.500 US-Dollar Anmeldegebühr, 500 US-Dollar im Monat und ein KI-Analyst, der ein gehacktes Postfach liest, um ganz genau herauszufinden, welcher Mitarbeiter das Geld kontrolliert. Das war das eigentliche Produkt, das EvilTokens verkaufte – kein Phishing-Kit mit angeflanschter KI. Die KI war vielmehr das Geschäftsmodell selbst.“
Dies ist der 40. gerichtlich genehmigte Eingriff von Microsoft DCU in nahezu zwei Jahrzehnten, aber der erste, der sich ausdrücklich gegen einen End-to-End-Service für mit KI ermöglichte Cyberkriminalität richtet – ein echter Unterschied, nicht nur eine größere Aktennummer. EvilTokens ging im Februar 2026 an den Start und kompromittierte über 12.000 Postfächer in mehr als 10.000 Organisationen. Dabei wurden zahlreiche Branchen getroffen – vom Großhandel über Bau, Finanzdienstleistungen, Immobilien, Gesundheitswesen bis hin zu Hochschulbildung – in den USA, im Vereinigten Königreich, in Kanada, Australien, Indien und Frankreich. Der Angriff missbrauchte den Microsoft-OAuth-2.0-Device-Code-Login-Flow, um Sitzungs-Tokens direkt zu stehlen, vollständig unter Umgehung von Passwörtern und MFA.
Die Rolle von Coinbase bestand darin, das Geld nachzuverfolgen. Das Threat-Team verfolgte Einnahmen in Höhe von rund 1,1 Millionen US-Dollar über vier Tron-Adressen zwischen Oktober 2025 und Juni 2026 – mehr als 1.000 Einzahlungen von über 700 verschiedenen Quellen. Diese Spur speiste die gerichtliche Anordnung auf Bundesebene, 50 beschlagnahmte Websites, sowie mehr als 175 deaktivierte Domains. Zwei Männer im Alter von 32 und 38 wurden am 11. September von der Londoner Met Police festgenommen und gegen Kaution freigelassen, bis eine forensische Untersuchung abgeschlossen ist.
Was mir auffällt, ist die Größe der Koalition: Cloudflare, OpenAI, TRM Labs, Health-ISAC, Shadowserver, SpyCloud und Railway haben neben Microsoft und Coinbase alle mitgewirkt. Eine wirklich breite Reaktion auf ein Bedrohungsmodell, das nun öffentlich bekannt ist und sich leicht kopieren lässt.
Worauf ich achte: Ob nun ähnliche KI-getriebene Dienste auftauchen, die den Device-Code ausnutzen, nachdem EvilTokens bewiesen hat, dass das Modell funktioniert – und wie schnell Plattformen die Abwehr gegen den Device-Code-Flow als Reaktion darauf verschärfen.
$BTC #BTC Price Analysis# #Meme Alpha# #BNBChain# $COIN
„1.500 US-Dollar Anmeldegebühr, 500 US-Dollar im Monat und ein KI-Analyst, der ein gehacktes Postfach liest, um ganz genau herauszufinden, welcher Mitarbeiter das Geld kontrolliert. Das war das eigentliche Produkt, das EvilTokens verkaufte – kein Phishing-Kit mit angeflanschter KI. Die KI war vielmehr das Geschäftsmodell selbst.“
Dies ist der 40. gerichtlich genehmigte Eingriff von Microsoft DCU in nahezu zwei Jahrzehnten, aber der erste, der sich ausdrücklich gegen einen End-to-End-Service für mit KI ermöglichte Cyberkriminalität richtet – ein echter Unterschied, nicht nur eine größere Aktennummer. EvilTokens ging im Februar 2026 an den Start und kompromittierte über 12.000 Postfächer in mehr als 10.000 Organisationen. Dabei wurden zahlreiche Branchen getroffen – vom Großhandel über Bau, Finanzdienstleistungen, Immobilien, Gesundheitswesen bis hin zu Hochschulbildung – in den USA, im Vereinigten Königreich, in Kanada, Australien, Indien und Frankreich. Der Angriff missbrauchte den Microsoft-OAuth-2.0-Device-Code-Login-Flow, um Sitzungs-Tokens direkt zu stehlen, vollständig unter Umgehung von Passwörtern und MFA.
Die Rolle von Coinbase bestand darin, das Geld nachzuverfolgen. Das Threat-Team verfolgte Einnahmen in Höhe von rund 1,1 Millionen US-Dollar über vier Tron-Adressen zwischen Oktober 2025 und Juni 2026 – mehr als 1.000 Einzahlungen von über 700 verschiedenen Quellen. Diese Spur speiste die gerichtliche Anordnung auf Bundesebene, 50 beschlagnahmte Websites, sowie mehr als 175 deaktivierte Domains. Zwei Männer im Alter von 32 und 38 wurden am 11. September von der Londoner Met Police festgenommen und gegen Kaution freigelassen, bis eine forensische Untersuchung abgeschlossen ist.
Was mir auffällt, ist die Größe der Koalition: Cloudflare, OpenAI, TRM Labs, Health-ISAC, Shadowserver, SpyCloud und Railway haben neben Microsoft und Coinbase alle mitgewirkt. Eine wirklich breite Reaktion auf ein Bedrohungsmodell, das nun öffentlich bekannt ist und sich leicht kopieren lässt.
Worauf ich achte: Ob nun ähnliche KI-getriebene Dienste auftauchen, die den Device-Code ausnutzen, nachdem EvilTokens bewiesen hat, dass das Modell funktioniert – und wie schnell Plattformen die Abwehr gegen den Device-Code-Flow als Reaktion darauf verschärfen.
$BTC #BTC Price Analysis# #Meme Alpha# #BNBChain# $COIN
Dies ist der 40. gerichtlich genehmigte Eingriff von Microsoft DCU in nahezu zwei Jahrzehnten, aber der erste, der sich ausdrücklich gegen einen End-to-End-Service für mit KI ermöglichte Cyberkriminalität richtet – ein echter Unterschied, nicht nur eine größere Aktennummer. EvilTokens ging im Februar 2026 an den Start und kompromittierte über 12.000 Postfächer in mehr als 10.000 Organisationen. Dabei wurden zahlreiche Branchen getroffen – vom Großhandel über Bau, Finanzdienstleistungen, Immobilien, Gesundheitswesen bis hin zu Hochschulbildung – in den USA, im Vereinigten Königreich, in Kanada, Australien, Indien und Frankreich. Der Angriff missbrauchte den Microsoft-OAuth-2.0-Device-Code-Login-Flow, um Sitzungs-Tokens direkt zu stehlen, vollständig unter Umgehung von Passwörtern und MFA.
Die Rolle von Coinbase bestand darin, das Geld nachzuverfolgen. Das Threat-Team verfolgte Einnahmen in Höhe von rund 1,1 Millionen US-Dollar über vier Tron-Adressen zwischen Oktober 2025 und Juni 2026 – mehr als 1.000 Einzahlungen von über 700 verschiedenen Quellen. Diese Spur speiste die gerichtliche Anordnung auf Bundesebene, 50 beschlagnahmte Websites, sowie mehr als 175 deaktivierte Domains. Zwei Männer im Alter von 32 und 38 wurden am 11. September von der Londoner Met Police festgenommen und gegen Kaution freigelassen, bis eine forensische Untersuchung abgeschlossen ist.
Was mir auffällt, ist die Größe der Koalition: Cloudflare, OpenAI, TRM Labs, Health-ISAC, Shadowserver, SpyCloud und Railway haben neben Microsoft und Coinbase alle mitgewirkt. Eine wirklich breite Reaktion auf ein Bedrohungsmodell, das nun öffentlich bekannt ist und sich leicht kopieren lässt.
Worauf ich achte: Ob nun ähnliche KI-getriebene Dienste auftauchen, die den Device-Code ausnutzen, nachdem EvilTokens bewiesen hat, dass das Modell funktioniert – und wie schnell Plattformen die Abwehr gegen den Device-Code-Flow als Reaktion darauf verschärfen.
$BTC #BTC Price Analysis# #Meme Alpha# #BNBChain# $COIN

·
--
NEAR ist der eindeutigste Fall für einen echten, konkreten Katalysator. Am 17. September startete es vertrauliche, dauerhafte Futures (perpetual futures), angetrieben von der Execution Engine von Hyperliquid. So können Trader Positionen eröffnen, ohne sie öffentlich mit ihren Konten zu verknüpfen. Dieses Produkt zog 70 Millionen US-Dollar an TVL (Total Value Locked) an und löste einen echten Anreizmechanismus rund um eine Schwelle von 3,33 aus. Die jüngste Stärke von NEAR lässt sich auf eine ausgelieferte Funktion mit messbarer Nutzung zurückführen – nicht nur auf Sentiment.
XRP ist anders gelagert: Hier geht es weitgehend um einen Katalysator, der noch aussteht, statt um einen, der bereits eingetroffen ist. XRP/BTC liegt etwa 48 % unter seinem Allzeithoch vom Januar 2025 und hat sich in den meisten Monaten 2026 schlechter entwickelt als BTC. Eine echte Ausnahme bildet lediglich August: Dort gab es einen monatlichen Anstieg von 30 % gegenüber BTC, während BTC nur 25 % zulegte. Der Treiber, auf den Analysten immer wieder hinweisen, ist das CLARITY Act – das nach dem gescheiterten Cloture-Versuch im Senat weiterhin ungeklärt ist. Hinzu kommt ein dokumentiertes saisonales Muster: XRP hat historisch im September speziell im Durchschnitt 17 % Gewinne erzielt. Eine reale historische Tendenz – nicht das Gleiche wie eine bestätigte grundlegende Kurswende.
DOGE und BCH würde ich mit der größten Skepsis betrachten. Ich habe im Moment keinen konkreten Katalysator für eines der beiden ausgemacht: kein Produkt-Launch, kein regulatorisches Ereignis, nichts Strukturveränderndes. Dieses Muster – im Gleichschritt mit einer breiten Risk-on-Rally zu laufen, ohne einen asset-spezifischen Auslöser – ist meistens Beta, also eher Preisfolge der Stärke von BTC statt eine eigenständige Nachfrage.
Mein ehrlicher Eindruck: Der Move bei NEAR hat echte Substanz dahinter, bei XRP ist der Katalysator plausibel, aber noch nicht bestätigt, plus echte Saisonalität. DOGE und BCH wirken hingegen größtenteils wie Mitläufer bei breiter Marktstärke.
Darauf achte ich: Ob NEAR seine Gewinne hält, sobald der Anreizmechanismus ausgelöst wird bzw. klar wird, und ob XRP tatsächlich einen CLARITY-Katalysator bekommt – oder ob es am Ende nur auf die September-Saisonalität angewiesen ist, um diese Gewinne zu stützen.
#BTC Price Analysis# #Meme Alpha# $XRP $NEAR
NEAR ist der eindeutigste Fall für einen echten, konkreten Katalysator. Am 17. September startete es vertrauliche, dauerhafte Futures (perpetual futures), angetrieben von der Execution Engine von Hyperliquid. So können Trader Positionen eröffnen, ohne sie öffentlich mit ihren Konten zu verknüpfen. Dieses Produkt zog 70 Millionen US-Dollar an TVL (Total Value Locked) an und löste einen echten Anreizmechanismus rund um eine Schwelle von 3,33 aus. Die jüngste Stärke von NEAR lässt sich auf eine ausgelieferte Funktion mit messbarer Nutzung zurückführen – nicht nur auf Sentiment.
XRP ist anders gelagert: Hier geht es weitgehend um einen Katalysator, der noch aussteht, statt um einen, der bereits eingetroffen ist. XRP/BTC liegt etwa 48 % unter seinem Allzeithoch vom Januar 2025 und hat sich in den meisten Monaten 2026 schlechter entwickelt als BTC. Eine echte Ausnahme bildet lediglich August: Dort gab es einen monatlichen Anstieg von 30 % gegenüber BTC, während BTC nur 25 % zulegte. Der Treiber, auf den Analysten immer wieder hinweisen, ist das CLARITY Act – das nach dem gescheiterten Cloture-Versuch im Senat weiterhin ungeklärt ist. Hinzu kommt ein dokumentiertes saisonales Muster: XRP hat historisch im September speziell im Durchschnitt 17 % Gewinne erzielt. Eine reale historische Tendenz – nicht das Gleiche wie eine bestätigte grundlegende Kurswende.
DOGE und BCH würde ich mit der größten Skepsis betrachten. Ich habe im Moment keinen konkreten Katalysator für eines der beiden ausgemacht: kein Produkt-Launch, kein regulatorisches Ereignis, nichts Strukturveränderndes. Dieses Muster – im Gleichschritt mit einer breiten Risk-on-Rally zu laufen, ohne einen asset-spezifischen Auslöser – ist meistens Beta, also eher Preisfolge der Stärke von BTC statt eine eigenständige Nachfrage.
Mein ehrlicher Eindruck: Der Move bei NEAR hat echte Substanz dahinter, bei XRP ist der Katalysator plausibel, aber noch nicht bestätigt, plus echte Saisonalität. DOGE und BCH wirken hingegen größtenteils wie Mitläufer bei breiter Marktstärke.
Darauf achte ich: Ob NEAR seine Gewinne hält, sobald der Anreizmechanismus ausgelöst wird bzw. klar wird, und ob XRP tatsächlich einen CLARITY-Katalysator bekommt – oder ob es am Ende nur auf die September-Saisonalität angewiesen ist, um diese Gewinne zu stützen.
#BTC Price Analysis# #Meme Alpha# $XRP $NEAR
XRP ist anders gelagert: Hier geht es weitgehend um einen Katalysator, der noch aussteht, statt um einen, der bereits eingetroffen ist. XRP/BTC liegt etwa 48 % unter seinem Allzeithoch vom Januar 2025 und hat sich in den meisten Monaten 2026 schlechter entwickelt als BTC. Eine echte Ausnahme bildet lediglich August: Dort gab es einen monatlichen Anstieg von 30 % gegenüber BTC, während BTC nur 25 % zulegte. Der Treiber, auf den Analysten immer wieder hinweisen, ist das CLARITY Act – das nach dem gescheiterten Cloture-Versuch im Senat weiterhin ungeklärt ist. Hinzu kommt ein dokumentiertes saisonales Muster: XRP hat historisch im September speziell im Durchschnitt 17 % Gewinne erzielt. Eine reale historische Tendenz – nicht das Gleiche wie eine bestätigte grundlegende Kurswende.
DOGE und BCH würde ich mit der größten Skepsis betrachten. Ich habe im Moment keinen konkreten Katalysator für eines der beiden ausgemacht: kein Produkt-Launch, kein regulatorisches Ereignis, nichts Strukturveränderndes. Dieses Muster – im Gleichschritt mit einer breiten Risk-on-Rally zu laufen, ohne einen asset-spezifischen Auslöser – ist meistens Beta, also eher Preisfolge der Stärke von BTC statt eine eigenständige Nachfrage.
Mein ehrlicher Eindruck: Der Move bei NEAR hat echte Substanz dahinter, bei XRP ist der Katalysator plausibel, aber noch nicht bestätigt, plus echte Saisonalität. DOGE und BCH wirken hingegen größtenteils wie Mitläufer bei breiter Marktstärke.
Darauf achte ich: Ob NEAR seine Gewinne hält, sobald der Anreizmechanismus ausgelöst wird bzw. klar wird, und ob XRP tatsächlich einen CLARITY-Katalysator bekommt – oder ob es am Ende nur auf die September-Saisonalität angewiesen ist, um diese Gewinne zu stützen.
#BTC Price Analysis# #Meme Alpha# $XRP $NEAR
12
·
--
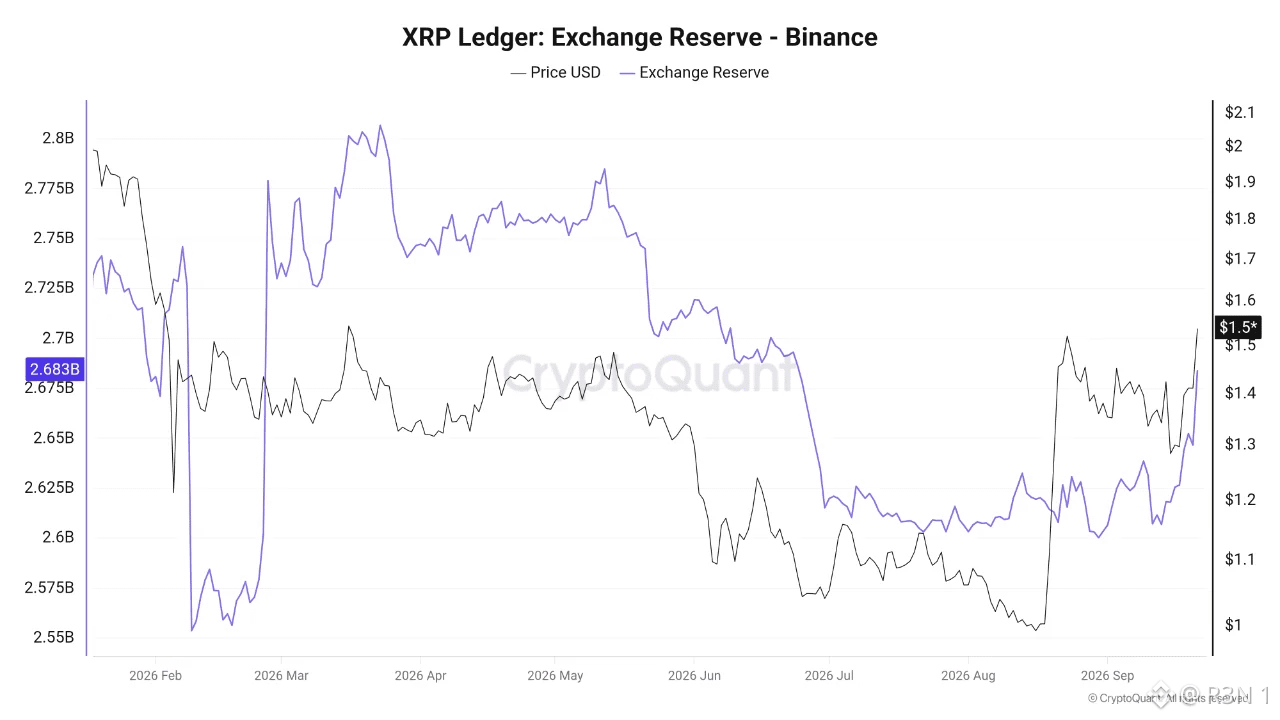
XRP-Reserven auf Binance steigen auf ein 3-Monatshoch
Daten deuten darauf hin, dass die XRP-Reserven auf Binance kürzlich auf etwa 2,68 Milliarden XRP angestiegen sind, während der Preis nahe der Marke von 1,50 US-Dollar gehandelt wird. Laut den Daten haben die Reserven ihr höchstes Niveau seit letztem Juni erreicht – ein bemerkenswerter Wandel nach einer Phase des Rückgangs, die in den Vormonaten zu beobachten war.
Dieser Anstieg bedeutet, dass nun ein größerer Anteil von $XRP auf Binance gehalten wird, wodurch ein größerer Teil des Angebots für den Spot-Handel auf der Plattform verfügbar wird. Diese Bewegung ist besonders bedeutend im Vergleich zum jüngsten Verlauf der Reserven, da XRP-Bestände zuvor deutlich zurückgegangen waren, bevor sie sich in den letzten Wochen allmählich erholten.
Aus Sicht der Marktdynamik bedeutet ein Anstieg der Reserven nicht zwangsläufig, dass XRP-Inhaber sich auf einen unmittelbaren Verkauf vorbereiten; vielmehr spiegelt er eine Erhöhung des Volumens der im Handelssystem gehaltenen Coins wider, was Händlern mehr Liquidität bietet. Wenn die Reserven also weiter ansteigen zusammen mit erhöhten Handelsvolumina oder Zuflüssen, könnte dieser Trend zu einem bedeutenden Faktor für kurzfristigen Angebotsdruck werden.
Sollten die Reserven in den kommenden Tagen weiter klettern, könnte dies auf eine schrittweise Verlagerung eines größeren Teils von XRP hin zu Börsen hindeuten – eine Entwicklung, die es zusammen mit den Nettoflüssen, dem Handelsvolumen und dem Kursverlauf zu beobachten gilt. #BTC Price Analysis# #Altcoin Season# #Meme Alpha#
XRP-Reserven auf Binance steigen auf ein 3-Monatshoch
Daten deuten darauf hin, dass die XRP-Reserven auf Binance kürzlich auf etwa 2,68 Milliarden XRP angestiegen sind, während der Preis nahe der Marke von 1,50 US-Dollar gehandelt wird. Laut den Daten haben die Reserven ihr höchstes Niveau seit letztem Juni erreicht – ein bemerkenswerter Wandel nach einer Phase des Rückgangs, die in den Vormonaten zu beobachten war.
Dieser Anstieg bedeutet, dass nun ein größerer Anteil von $XRP auf Binance gehalten wird, wodurch ein größerer Teil des Angebots für den Spot-Handel auf der Plattform verfügbar wird. Diese Bewegung ist besonders bedeutend im Vergleich zum jüngsten Verlauf der Reserven, da XRP-Bestände zuvor deutlich zurückgegangen waren, bevor sie sich in den letzten Wochen allmählich erholten.
Aus Sicht der Marktdynamik bedeutet ein Anstieg der Reserven nicht zwangsläufig, dass XRP-Inhaber sich auf einen unmittelbaren Verkauf vorbereiten; vielmehr spiegelt er eine Erhöhung des Volumens der im Handelssystem gehaltenen Coins wider, was Händlern mehr Liquidität bietet. Wenn die Reserven also weiter ansteigen zusammen mit erhöhten Handelsvolumina oder Zuflüssen, könnte dieser Trend zu einem bedeutenden Faktor für kurzfristigen Angebotsdruck werden.
Sollten die Reserven in den kommenden Tagen weiter klettern, könnte dies auf eine schrittweise Verlagerung eines größeren Teils von XRP hin zu Börsen hindeuten – eine Entwicklung, die es zusammen mit den Nettoflüssen, dem Handelsvolumen und dem Kursverlauf zu beobachten gilt. #BTC Price Analysis# #Altcoin Season# #Meme Alpha#
Daten deuten darauf hin, dass die XRP-Reserven auf Binance kürzlich auf etwa 2,68 Milliarden XRP angestiegen sind, während der Preis nahe der Marke von 1,50 US-Dollar gehandelt wird. Laut den Daten haben die Reserven ihr höchstes Niveau seit letztem Juni erreicht – ein bemerkenswerter Wandel nach einer Phase des Rückgangs, die in den Vormonaten zu beobachten war.
Dieser Anstieg bedeutet, dass nun ein größerer Anteil von $XRP auf Binance gehalten wird, wodurch ein größerer Teil des Angebots für den Spot-Handel auf der Plattform verfügbar wird. Diese Bewegung ist besonders bedeutend im Vergleich zum jüngsten Verlauf der Reserven, da XRP-Bestände zuvor deutlich zurückgegangen waren, bevor sie sich in den letzten Wochen allmählich erholten.
Aus Sicht der Marktdynamik bedeutet ein Anstieg der Reserven nicht zwangsläufig, dass XRP-Inhaber sich auf einen unmittelbaren Verkauf vorbereiten; vielmehr spiegelt er eine Erhöhung des Volumens der im Handelssystem gehaltenen Coins wider, was Händlern mehr Liquidität bietet. Wenn die Reserven also weiter ansteigen zusammen mit erhöhten Handelsvolumina oder Zuflüssen, könnte dieser Trend zu einem bedeutenden Faktor für kurzfristigen Angebotsdruck werden.
Sollten die Reserven in den kommenden Tagen weiter klettern, könnte dies auf eine schrittweise Verlagerung eines größeren Teils von XRP hin zu Börsen hindeuten – eine Entwicklung, die es zusammen mit den Nettoflüssen, dem Handelsvolumen und dem Kursverlauf zu beobachten gilt. #BTC Price Analysis# #Altcoin Season# #Meme Alpha#
·
--
Token-Graduation auf TON ist eine der am häufigsten missverstandenen Mechaniken im Ökosystem. Die meisten wissen, dass sie bedeutet, dass ein Token von einer Bonding-Curve zu einem DEX wechselt. Wenige verstehen jedoch, was in jedem Schritt tatsächlich passiert und warum die Automatisierung wichtig ist. Vier große Launchpads auf TON routen nun graduierte Tokens an STONfi, Grambo, Gram Store, Quantum Club und Stonks. Jedes hat leicht unterschiedliche Mechaniken, aber die Graduation-Pipeline folgt derselben Struktur. Phase eins ist die Bonding-Curve. Der Token startet mit einem Preis, der durch eine mathematische Formel bestimmt wird, basierend auf dem aktuellen Angebot. Jeder Kauf erhöht den Preis automatisch. Die Curve sammelt das Kaufkapital in einer Reserve. Kein Orderbuch. Keine Market Maker. Die Formel ist der Markt. Phase zwei ist die Graduation-Schwelle. Wenn der Token eine definierte Marke erreicht — entweder einen bestimmten Betrag an aufgebrachtem Kapital oder eine bestimmte Menge verkaufter Token — wird das Graduation-Event automatisch ausgelöst. Kein Eingreifen des Teams erforderlich. Das Protokoll übernimmt das. Phase drei ist die Liquidity-Migration. Das während der Bonding-Curve-Phase gesammelte Reservekapital fließt in einen STONfi-V2-Pool. Der Token ist jetzt auf einem standardmäßigen AMM-DEX handelbar, statt über die Bonding-Curve. Die Preisfindung wechselt von der Formel hin zum Markt. Phase vier ist das LP-Token-Locking. Bei Gram Store werden die LP-Tokens, die das migrierte Liquidity-Lock für sechs bis zwölf Monate repräsentieren, gesperrt. Das Team kann die Liquidität, die sie in dieser Zeit eingebracht haben, nicht entfernen. Das ist die Mechanik, die den häufigsten Token-Launch-Fehlermodus adressiert: Teams ziehen unmittelbar nach der Graduation Liquidität ab, während Holder mit einer illiquiden Position zurückbleiben. Jede erfolgreiche Graduation auf einem dieser vier Launchpads bringt automatisch neue Liquidität und neue Trading-Paare zu STONfi. Die Pipeline vergrößert die Pool-Tiefe von STONfi kontinuierlich, ohne dass manuelle Entscheidungen zum Listing nötig sind. Entdecke STONfi-Pools → https://app.ston.fi/pools #BTC Price Analysis# $BTC #Altcoin Season# $ETH
Token-Graduation auf TON ist eine der am häufigsten missverstandenen Mechaniken im Ökosystem. Die meisten wissen, dass sie bedeutet, dass ein Token von einer Bonding-Curve zu einem DEX wechselt. Wenige verstehen jedoch, was in jedem Schritt tatsächlich passiert und warum die Automatisierung wichtig ist. Vier große Launchpads auf TON routen nun graduierte Tokens an STONfi, Grambo, Gram Store, Quantum Club und Stonks. Jedes hat leicht unterschiedliche Mechaniken, aber die Graduation-Pipeline folgt derselben Struktur. Phase eins ist die Bonding-Curve. Der Token startet mit einem Preis, der durch eine mathematische Formel bestimmt wird, basierend auf dem aktuellen Angebot. Jeder Kauf erhöht den Preis automatisch. Die Curve sammelt das Kaufkapital in einer Reserve. Kein Orderbuch. Keine Market Maker. Die Formel ist der Markt. Phase zwei ist die Graduation-Schwelle. Wenn der Token eine definierte Marke erreicht — entweder einen bestimmten Betrag an aufgebrachtem Kapital oder eine bestimmte Menge verkaufter Token — wird das Graduation-Event automatisch ausgelöst. Kein Eingreifen des Teams erforderlich. Das Protokoll übernimmt das. Phase drei ist die Liquidity-Migration. Das während der Bonding-Curve-Phase gesammelte Reservekapital fließt in einen STONfi-V2-Pool. Der Token ist jetzt auf einem standardmäßigen AMM-DEX handelbar, statt über die Bonding-Curve. Die Preisfindung wechselt von der Formel hin zum Markt. Phase vier ist das LP-Token-Locking. Bei Gram Store werden die LP-Tokens, die das migrierte Liquidity-Lock für sechs bis zwölf Monate repräsentieren, gesperrt. Das Team kann die Liquidität, die sie in dieser Zeit eingebracht haben, nicht entfernen. Das ist die Mechanik, die den häufigsten Token-Launch-Fehlermodus adressiert: Teams ziehen unmittelbar nach der Graduation Liquidität ab, während Holder mit einer illiquiden Position zurückbleiben. Jede erfolgreiche Graduation auf einem dieser vier Launchpads bringt automatisch neue Liquidität und neue Trading-Paare zu STONfi. Die Pipeline vergrößert die Pool-Tiefe von STONfi kontinuierlich, ohne dass manuelle Entscheidungen zum Listing nötig sind. Entdecke STONfi-Pools → https://app.ston.fi/pools #BTC Price Analysis# $BTC #Altcoin Season# $ETH
18
·
--
China hat bis einschließlich August mehr Gold importiert als im gesamten Jahr 2025 zuvor – und der Preis-Kontext dahinter ist das eigentlich Ungewöhnliche.
Sinkende internationale Goldpreise und ein sich festigender Yuan sind die beiden Treiber, die Bloomberg nennt: nicht eine aus Angst getriebene Flucht in Sicherheit. Das ist wichtig, weil es bedeutet, dass chinesische Käufer Rücksetzer als Kaufgelegenheiten zu günstigeren Konditionen betrachten – ein stärkerer Währungswert macht Importe relativ weniger teuer –, statt sich im Panikmodus zu stapeln.
Was mir auffällt, ist der Verlauf, den diese Entwicklung rund abschließt. Die Importe lagen bis Mai bei etwa 692 Tonnen und waren zu diesem Zeitpunkt bereits um 76% im Jahresvergleich gestiegen. Allein im Mai wurden 163 Tonnen erreicht – der stärkste einzelne Monat seit März 2024. Das ist kein plötzlicher Aufschwung zum Jahresende, sondern ein gleichmäßiger Aufbau über das gesamte Jahr. Dass bis August die Marke von 1.000 Tonnen erreicht wurde, heißt: Das Tempo hielt sich oder beschleunigte sich sogar noch über den Sommer, statt wieder abzuebben.
Es lohnt sich, hier Einzelhandel und offizielle Reserven zu trennen, denn die Darstellung neigt dazu, beides zu vermischen. Diese 1.000-Tonnen-Zahl bezieht sich auf zollamtliche Importdaten – also auf den gewerblich sowie durch den Einzelhandel getriebenen Barren- und Schmuckgold-Flow. Das ist etwas anderes als die eigenen Zukäufe des PBoC für die staatlichen Reserven: Diese lagen bis Mai bei rund 2.331 Tonnen, jeweils im Rahmen separater Käufe der Zentralbank. Beide steigen, aber sie betreffen unterschiedliche Käufer mit unterschiedlichen Motiven: einmal Haushalte und Juweliere, das andere ist die Geldpolitik.
Ein Analyst, der in dem Beitrag zitiert wurde, merkte an, dass die inländischen Preise einen leichten Aufschlag gegenüber weltweiten Benchmarks halten. Genau das zieht die Importe an – starke lokale Nachfrage, sodass Gold innerhalb Chinas mehr kostet als außerhalb. Das schafft einen Anreiz, mehr ins Land zu holen.
Die offene Frage ist, ob dieses Tempo bis ins Q4 hinein anhält. Ein Yuan, der erneut schwächer wird, oder eine Erholung der internationalen Goldpreise würde beide Rückenwinde gleichzeitig entfernen. Und eine solche Import-Euphorie hat sich schon einmal abgekühlt, nachdem sich das Preis- und Währungsszenario, das sie ermöglicht hatte, verschoben hatte.
#Macro Insights# #BTC Price Analysis# $BTC
$XAUt
China hat bis einschließlich August mehr Gold importiert als im gesamten Jahr 2025 zuvor – und der Preis-Kontext dahinter ist das eigentlich Ungewöhnliche.
Sinkende internationale Goldpreise und ein sich festigender Yuan sind die beiden Treiber, die Bloomberg nennt: nicht eine aus Angst getriebene Flucht in Sicherheit. Das ist wichtig, weil es bedeutet, dass chinesische Käufer Rücksetzer als Kaufgelegenheiten zu günstigeren Konditionen betrachten – ein stärkerer Währungswert macht Importe relativ weniger teuer –, statt sich im Panikmodus zu stapeln.
Was mir auffällt, ist der Verlauf, den diese Entwicklung rund abschließt. Die Importe lagen bis Mai bei etwa 692 Tonnen und waren zu diesem Zeitpunkt bereits um 76% im Jahresvergleich gestiegen. Allein im Mai wurden 163 Tonnen erreicht – der stärkste einzelne Monat seit März 2024. Das ist kein plötzlicher Aufschwung zum Jahresende, sondern ein gleichmäßiger Aufbau über das gesamte Jahr. Dass bis August die Marke von 1.000 Tonnen erreicht wurde, heißt: Das Tempo hielt sich oder beschleunigte sich sogar noch über den Sommer, statt wieder abzuebben.
Es lohnt sich, hier Einzelhandel und offizielle Reserven zu trennen, denn die Darstellung neigt dazu, beides zu vermischen. Diese 1.000-Tonnen-Zahl bezieht sich auf zollamtliche Importdaten – also auf den gewerblich sowie durch den Einzelhandel getriebenen Barren- und Schmuckgold-Flow. Das ist etwas anderes als die eigenen Zukäufe des PBoC für die staatlichen Reserven: Diese lagen bis Mai bei rund 2.331 Tonnen, jeweils im Rahmen separater Käufe der Zentralbank. Beide steigen, aber sie betreffen unterschiedliche Käufer mit unterschiedlichen Motiven: einmal Haushalte und Juweliere, das andere ist die Geldpolitik.
Ein Analyst, der in dem Beitrag zitiert wurde, merkte an, dass die inländischen Preise einen leichten Aufschlag gegenüber weltweiten Benchmarks halten. Genau das zieht die Importe an – starke lokale Nachfrage, sodass Gold innerhalb Chinas mehr kostet als außerhalb. Das schafft einen Anreiz, mehr ins Land zu holen.
Die offene Frage ist, ob dieses Tempo bis ins Q4 hinein anhält. Ein Yuan, der erneut schwächer wird, oder eine Erholung der internationalen Goldpreise würde beide Rückenwinde gleichzeitig entfernen. Und eine solche Import-Euphorie hat sich schon einmal abgekühlt, nachdem sich das Preis- und Währungsszenario, das sie ermöglicht hatte, verschoben hatte.
#Macro Insights# #BTC Price Analysis# $BTC
$XAUt
Sinkende internationale Goldpreise und ein sich festigender Yuan sind die beiden Treiber, die Bloomberg nennt: nicht eine aus Angst getriebene Flucht in Sicherheit. Das ist wichtig, weil es bedeutet, dass chinesische Käufer Rücksetzer als Kaufgelegenheiten zu günstigeren Konditionen betrachten – ein stärkerer Währungswert macht Importe relativ weniger teuer –, statt sich im Panikmodus zu stapeln.
Was mir auffällt, ist der Verlauf, den diese Entwicklung rund abschließt. Die Importe lagen bis Mai bei etwa 692 Tonnen und waren zu diesem Zeitpunkt bereits um 76% im Jahresvergleich gestiegen. Allein im Mai wurden 163 Tonnen erreicht – der stärkste einzelne Monat seit März 2024. Das ist kein plötzlicher Aufschwung zum Jahresende, sondern ein gleichmäßiger Aufbau über das gesamte Jahr. Dass bis August die Marke von 1.000 Tonnen erreicht wurde, heißt: Das Tempo hielt sich oder beschleunigte sich sogar noch über den Sommer, statt wieder abzuebben.
Es lohnt sich, hier Einzelhandel und offizielle Reserven zu trennen, denn die Darstellung neigt dazu, beides zu vermischen. Diese 1.000-Tonnen-Zahl bezieht sich auf zollamtliche Importdaten – also auf den gewerblich sowie durch den Einzelhandel getriebenen Barren- und Schmuckgold-Flow. Das ist etwas anderes als die eigenen Zukäufe des PBoC für die staatlichen Reserven: Diese lagen bis Mai bei rund 2.331 Tonnen, jeweils im Rahmen separater Käufe der Zentralbank. Beide steigen, aber sie betreffen unterschiedliche Käufer mit unterschiedlichen Motiven: einmal Haushalte und Juweliere, das andere ist die Geldpolitik.
Ein Analyst, der in dem Beitrag zitiert wurde, merkte an, dass die inländischen Preise einen leichten Aufschlag gegenüber weltweiten Benchmarks halten. Genau das zieht die Importe an – starke lokale Nachfrage, sodass Gold innerhalb Chinas mehr kostet als außerhalb. Das schafft einen Anreiz, mehr ins Land zu holen.
Die offene Frage ist, ob dieses Tempo bis ins Q4 hinein anhält. Ein Yuan, der erneut schwächer wird, oder eine Erholung der internationalen Goldpreise würde beide Rückenwinde gleichzeitig entfernen. Und eine solche Import-Euphorie hat sich schon einmal abgekühlt, nachdem sich das Preis- und Währungsszenario, das sie ermöglicht hatte, verschoben hatte.
#Macro Insights# #BTC Price Analysis# $BTC
$XAUt


36
·
--
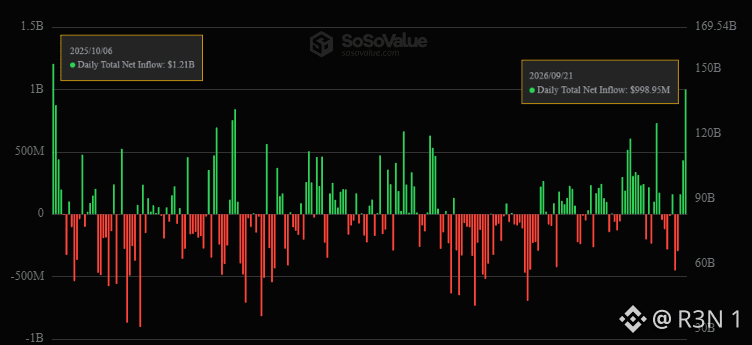
$999 Millionen in einem einzigen Tag in Bitcoin-ETFs – und die Aufschlüsselung auf Fond-Ebene zeigt, dass das kein einzelner „Wal“-Zuteiler war. Stattdessen war es breite institutionelle Nachfrage über mehrere Produkte hinweg gleichzeitig.
IBIT führte mit $381,4 Millionen, doch ARKB holte $289,1 Millionen und FBTC steuerte $238,8 Millionen bei – drei separate Emittenten, die an demselben Tag jeweils echtes Volumen anzogen, plus kleinere Zuflüsse über MSTR, BITB, GBTC und BTC. Das ist etwas ganz anderes als ein einmaliger Peak in nur einem Fonds: Es ist eine Nachfrage, die sich über die gesamte Produktlandschaft gleichzeitig verteilt.
Was mir auffällt, ist, dass die Kursbewegung fast zu sauber mit den Flow-Daten zusammenfällt. BTC über $86K und ETH über $2,7K – beides Achtmonats-Hochs – kommen am selben Tag wie der größte ETF-Zufluss des Jahres. Das ist kein Zufall, sondern der Mechanismus, der so funktioniert, wie er vorgesehen ist: ETF-Käufe werden direkt zu Spot-Nachfragedruck auf beiden Assets.
Trotzdem sollte man bei dem Vergleich, der hier gezogen wird, präzise sein. Die Zuflusswelle im Oktober, gegen die das gemessen wird, ging dem Crash vom 10. Oktober voraus – sie verursachte nicht die Stärke, die dann gehalten hat. Große Einzeltages-Zuflüsse allein waren historisch nicht der entscheidende Hinweis. Wichtiger war, was in den Wochen danach passiert ist. Das ist kein Grund, die heutige Zahl abzuwerten, sondern nur ein Grund, nicht einen einzelnen Rekordtag als Bestätigung eines Trends zu behandeln.
Die offene Frage ist nicht, ob heute institutionelle Nachfrage aufgetaucht ist – die Daten auf Fond-Ebene bestätigen das eindeutig. Die Frage ist, ob das der Beginn einer anhaltenden Zufluss-Phase ist, wie sie BTC von $63K auf $78K getragen hat über vier Wochen im August, oder ob es nur ein einzelner überproportionaler Tag ist, der schnell wieder abkühlt – so wie einige der frühen September-Veröffentlichungen, nachdem die anfängliche Stärke verblasste.
$BTC #BTC Price Analysis# #Altcoin Season# $ETH
$999 Millionen in einem einzigen Tag in Bitcoin-ETFs – und die Aufschlüsselung auf Fond-Ebene zeigt, dass das kein einzelner „Wal“-Zuteiler war. Stattdessen war es breite institutionelle Nachfrage über mehrere Produkte hinweg gleichzeitig.
IBIT führte mit $381,4 Millionen, doch ARKB holte $289,1 Millionen und FBTC steuerte $238,8 Millionen bei – drei separate Emittenten, die an demselben Tag jeweils echtes Volumen anzogen, plus kleinere Zuflüsse über MSTR, BITB, GBTC und BTC. Das ist etwas ganz anderes als ein einmaliger Peak in nur einem Fonds: Es ist eine Nachfrage, die sich über die gesamte Produktlandschaft gleichzeitig verteilt.
Was mir auffällt, ist, dass die Kursbewegung fast zu sauber mit den Flow-Daten zusammenfällt. BTC über $86K und ETH über $2,7K – beides Achtmonats-Hochs – kommen am selben Tag wie der größte ETF-Zufluss des Jahres. Das ist kein Zufall, sondern der Mechanismus, der so funktioniert, wie er vorgesehen ist: ETF-Käufe werden direkt zu Spot-Nachfragedruck auf beiden Assets.
Trotzdem sollte man bei dem Vergleich, der hier gezogen wird, präzise sein. Die Zuflusswelle im Oktober, gegen die das gemessen wird, ging dem Crash vom 10. Oktober voraus – sie verursachte nicht die Stärke, die dann gehalten hat. Große Einzeltages-Zuflüsse allein waren historisch nicht der entscheidende Hinweis. Wichtiger war, was in den Wochen danach passiert ist. Das ist kein Grund, die heutige Zahl abzuwerten, sondern nur ein Grund, nicht einen einzelnen Rekordtag als Bestätigung eines Trends zu behandeln.
Die offene Frage ist nicht, ob heute institutionelle Nachfrage aufgetaucht ist – die Daten auf Fond-Ebene bestätigen das eindeutig. Die Frage ist, ob das der Beginn einer anhaltenden Zufluss-Phase ist, wie sie BTC von $63K auf $78K getragen hat über vier Wochen im August, oder ob es nur ein einzelner überproportionaler Tag ist, der schnell wieder abkühlt – so wie einige der frühen September-Veröffentlichungen, nachdem die anfängliche Stärke verblasste.
$BTC #BTC Price Analysis# #Altcoin Season# $ETH
IBIT führte mit $381,4 Millionen, doch ARKB holte $289,1 Millionen und FBTC steuerte $238,8 Millionen bei – drei separate Emittenten, die an demselben Tag jeweils echtes Volumen anzogen, plus kleinere Zuflüsse über MSTR, BITB, GBTC und BTC. Das ist etwas ganz anderes als ein einmaliger Peak in nur einem Fonds: Es ist eine Nachfrage, die sich über die gesamte Produktlandschaft gleichzeitig verteilt.
Was mir auffällt, ist, dass die Kursbewegung fast zu sauber mit den Flow-Daten zusammenfällt. BTC über $86K und ETH über $2,7K – beides Achtmonats-Hochs – kommen am selben Tag wie der größte ETF-Zufluss des Jahres. Das ist kein Zufall, sondern der Mechanismus, der so funktioniert, wie er vorgesehen ist: ETF-Käufe werden direkt zu Spot-Nachfragedruck auf beiden Assets.
Trotzdem sollte man bei dem Vergleich, der hier gezogen wird, präzise sein. Die Zuflusswelle im Oktober, gegen die das gemessen wird, ging dem Crash vom 10. Oktober voraus – sie verursachte nicht die Stärke, die dann gehalten hat. Große Einzeltages-Zuflüsse allein waren historisch nicht der entscheidende Hinweis. Wichtiger war, was in den Wochen danach passiert ist. Das ist kein Grund, die heutige Zahl abzuwerten, sondern nur ein Grund, nicht einen einzelnen Rekordtag als Bestätigung eines Trends zu behandeln.
Die offene Frage ist nicht, ob heute institutionelle Nachfrage aufgetaucht ist – die Daten auf Fond-Ebene bestätigen das eindeutig. Die Frage ist, ob das der Beginn einer anhaltenden Zufluss-Phase ist, wie sie BTC von $63K auf $78K getragen hat über vier Wochen im August, oder ob es nur ein einzelner überproportionaler Tag ist, der schnell wieder abkühlt – so wie einige der frühen September-Veröffentlichungen, nachdem die anfängliche Stärke verblasste.
$BTC #BTC Price Analysis# #Altcoin Season# $ETH
37
·
--
Das plattformübergreifende Netzwerk von STONfi deckt jetzt zehn Chains ab. Die Wahl zwischen ihnen für einen bestimmten Swap ist eine praktische Entscheidung, die die meisten Inhalte nicht klar genug ansprechen. Hier ist das Framework, das ich tatsächlich verwende.
Die erste Frage lautet: Wofür benötigst du die Assets nach der Ankunft? Das bestimmt die Ziel-Chain direkter als jeder andere Faktor. Wenn du in DeFi-Yield-Chancen investieren möchtest, haben TRON und Ethereum die tiefste Stablecoin-Liquidität.
Wenn du Zugriff auf kostengünstige, häufige Transaktionen brauchst, sind Base, BNB Chain und Polygon wirtschaftlicher. Wenn du tokenisierte Aktien-Exposure benötigst, ist die Robinhood Chain am besten für genau diesen Use Case ausgelegt. Wenn du AI-Agent-native Infrastruktur brauchst, wurde X Layer dafür entwickelt.
Die zweite Frage ist die Gas-Kosten der Quell-Chain. Wenn du von TON startest, liegen die Kosten ungefähr bei 0,06 bis 0,13 US-Dollar pro Transaktion – unabhängig vom Ziel. Von Ethereum Mainnet aus startet mit signifikanten Gas-Kosten, die die Wirtschaftlichkeit für kleinere Beträge verändern. Wenn deine Assets auf mehrere Chains verteilt sind, beeinflusst die Wahl der Start-Chain die Gesamtkosten stärker als die Route selbst.
Die dritte Frage ist: Welche Stablecoin hältst du und welche ist am Ziel verfügbar? Jede Chain im Netzwerk unterstützt spezifische Stablecoins. USDT auf TON. USDT und USDC auf Ethereum und BNB Chain. USDC und USDT0 auf Arbitrum. PUSD und USDC auf Polygon. USDG auf Robinhood Chain. USDC und USDT0 auf X Layer. Überprüfe die Live-Ansicht, bevor du bestätigst, weil sich die unterstützten Assets aktualisieren, während sich das Netzwerk weiterentwickelt.
Die vierte Frage ist die Transaktionsgröße im Verhältnis zur aktuellen Grenze von 1.000 US-Dollar pro Transaktion bei neueren Chain-Erweiterungen. Bei Beträgen über der Grenze sind mehrere Transaktionen erforderlich.
Diese vier Fragen beantworten die Chain-Auswahl-Entscheidung für die meisten plattformübergreifenden Transfers.
Cross-Chain-Swaps testen →https://app.ston.fi/swap?mode=cross-chain
$BTC #BTC Price Analysis# #Altcoin Season# $PI
Das plattformübergreifende Netzwerk von STONfi deckt jetzt zehn Chains ab. Die Wahl zwischen ihnen für einen bestimmten Swap ist eine praktische Entscheidung, die die meisten Inhalte nicht klar genug ansprechen. Hier ist das Framework, das ich tatsächlich verwende.
Die erste Frage lautet: Wofür benötigst du die Assets nach der Ankunft? Das bestimmt die Ziel-Chain direkter als jeder andere Faktor. Wenn du in DeFi-Yield-Chancen investieren möchtest, haben TRON und Ethereum die tiefste Stablecoin-Liquidität.
Wenn du Zugriff auf kostengünstige, häufige Transaktionen brauchst, sind Base, BNB Chain und Polygon wirtschaftlicher. Wenn du tokenisierte Aktien-Exposure benötigst, ist die Robinhood Chain am besten für genau diesen Use Case ausgelegt. Wenn du AI-Agent-native Infrastruktur brauchst, wurde X Layer dafür entwickelt.
Die zweite Frage ist die Gas-Kosten der Quell-Chain. Wenn du von TON startest, liegen die Kosten ungefähr bei 0,06 bis 0,13 US-Dollar pro Transaktion – unabhängig vom Ziel. Von Ethereum Mainnet aus startet mit signifikanten Gas-Kosten, die die Wirtschaftlichkeit für kleinere Beträge verändern. Wenn deine Assets auf mehrere Chains verteilt sind, beeinflusst die Wahl der Start-Chain die Gesamtkosten stärker als die Route selbst.
Die dritte Frage ist: Welche Stablecoin hältst du und welche ist am Ziel verfügbar? Jede Chain im Netzwerk unterstützt spezifische Stablecoins. USDT auf TON. USDT und USDC auf Ethereum und BNB Chain. USDC und USDT0 auf Arbitrum. PUSD und USDC auf Polygon. USDG auf Robinhood Chain. USDC und USDT0 auf X Layer. Überprüfe die Live-Ansicht, bevor du bestätigst, weil sich die unterstützten Assets aktualisieren, während sich das Netzwerk weiterentwickelt.
Die vierte Frage ist die Transaktionsgröße im Verhältnis zur aktuellen Grenze von 1.000 US-Dollar pro Transaktion bei neueren Chain-Erweiterungen. Bei Beträgen über der Grenze sind mehrere Transaktionen erforderlich.
Diese vier Fragen beantworten die Chain-Auswahl-Entscheidung für die meisten plattformübergreifenden Transfers.
Cross-Chain-Swaps testen →https://app.ston.fi/swap?mode=cross-chain
$BTC #BTC Price Analysis# #Altcoin Season# $PI
Die erste Frage lautet: Wofür benötigst du die Assets nach der Ankunft? Das bestimmt die Ziel-Chain direkter als jeder andere Faktor. Wenn du in DeFi-Yield-Chancen investieren möchtest, haben TRON und Ethereum die tiefste Stablecoin-Liquidität.
Wenn du Zugriff auf kostengünstige, häufige Transaktionen brauchst, sind Base, BNB Chain und Polygon wirtschaftlicher. Wenn du tokenisierte Aktien-Exposure benötigst, ist die Robinhood Chain am besten für genau diesen Use Case ausgelegt. Wenn du AI-Agent-native Infrastruktur brauchst, wurde X Layer dafür entwickelt.
Die zweite Frage ist die Gas-Kosten der Quell-Chain. Wenn du von TON startest, liegen die Kosten ungefähr bei 0,06 bis 0,13 US-Dollar pro Transaktion – unabhängig vom Ziel. Von Ethereum Mainnet aus startet mit signifikanten Gas-Kosten, die die Wirtschaftlichkeit für kleinere Beträge verändern. Wenn deine Assets auf mehrere Chains verteilt sind, beeinflusst die Wahl der Start-Chain die Gesamtkosten stärker als die Route selbst.
Die dritte Frage ist: Welche Stablecoin hältst du und welche ist am Ziel verfügbar? Jede Chain im Netzwerk unterstützt spezifische Stablecoins. USDT auf TON. USDT und USDC auf Ethereum und BNB Chain. USDC und USDT0 auf Arbitrum. PUSD und USDC auf Polygon. USDG auf Robinhood Chain. USDC und USDT0 auf X Layer. Überprüfe die Live-Ansicht, bevor du bestätigst, weil sich die unterstützten Assets aktualisieren, während sich das Netzwerk weiterentwickelt.
Die vierte Frage ist die Transaktionsgröße im Verhältnis zur aktuellen Grenze von 1.000 US-Dollar pro Transaktion bei neueren Chain-Erweiterungen. Bei Beträgen über der Grenze sind mehrere Transaktionen erforderlich.
Diese vier Fragen beantworten die Chain-Auswahl-Entscheidung für die meisten plattformübergreifenden Transfers.
Cross-Chain-Swaps testen →https://app.ston.fi/swap?mode=cross-chain
$BTC #BTC Price Analysis# #Altcoin Season# $PI

52
·
--
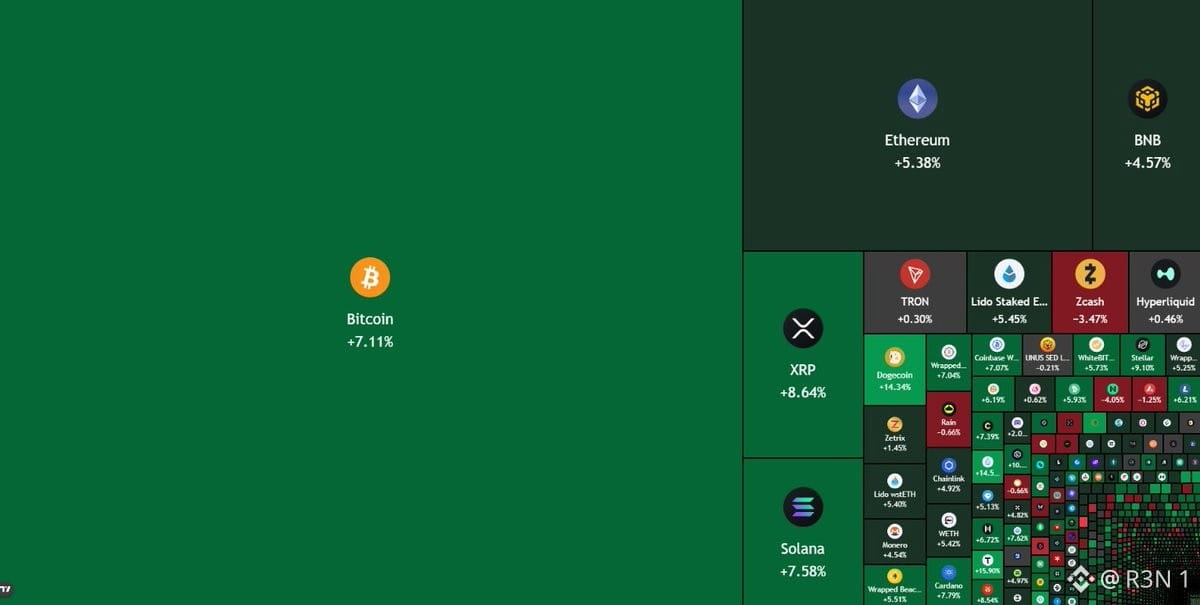
Das CLARITY-Gesetz ist am 15. September im Senat gescheitert. Bitcoin fiel an diesem selben Tag auf 74.900 US-Dollar, über 600 Millionen US-Dollar in Long-Liquidationen. Sechs Tage später liegt es bei 86.000 US-Dollar, einem Acht-Monats-Hoch. Diese Abfolge ist die eigentliche Geschichte – nicht eine geradlinige Entwicklung vom Scheitern zum Aufschwung.
Die erste Reaktion war bärisch, genau das, was man erwarten würde. Aber die darauf folgende Erholung hatte mit CLARITY eigentlich gar nichts zu tun: Sie kam daher, dass BTC bei 78.000 US-Dollar, dann erneut bei 82.000 US-Dollar, technischen Widerstand durchbrach. Jede dieser Breakouts löste frische Short-Liquidationen aus, die das nächste Aufwärtsstück mit anfeuerten. CoinGlass-Daten zeigen, dass allein seit heute, als der Kurs bei 82.000 US-Dollar die Marke aufgab, ungefähr 750 Millionen US-Dollar an bärischen Positionen ausgelöscht wurden. Dazu kommt etwa die 15,6 Milliarden US-Dollar schwere Fed-Treasury-Bill-Käufe, die ab dem 18. September zu settlementen begannen. Dann erhält man einen Markt, der sich trotz des regulatorischen Rückschlags erholte – nicht wegen ihm.
Es lohnt sich, hier vorsichtig mit der Einordnung zu sein. Wenn man das als CLARITY-getriebenen Schub bezeichnet, überspringt man die tatsächliche Woche: erst ein echtes Abverkaufs-/Selloff-Intermezzo, dann eine separate, technisch und liquiditätsgetriebene Erholung, die lediglich in denselben Zeitraum fiel. Scotts Melker Einschätzung wirkt dem näher, was tatsächlich stimmt: Schlechte Nachrichten haben einfach aufgehört, den Kurs weiter nach unten zu drücken – das ist eine andere Aussage als die, wonach gute Nachrichten den Kurs nach oben treiben.
Das Open Interest ist seit dem Breakout bei 82.000 US-Dollar um grob 2 Milliarden US-Dollar gestiegen. Das bedeutet: Frische Hebel werden in diese Rally wieder eingepreist, statt dass der Move bis hierher rein ein Short-Covering-Event wäre.
Meine ehrliche Einschätzung: Die Kursbewegung ist real und die bärischen Liquidationen sind real. Aber die direkte Zuschreibung speziell zum Scheitern von CLARITY verkehrt die Kausalität. Das sieht eher nach einem Markt aus, der schlimmere Nachrichten eingepreist hat als letztlich eingetreten sind – und der dann aus eigener Dynamik weiter nach oben geklettert ist.
Worauf ich achte: Ob die Spanne von 86.000 bis 90.000 US-Dollar mit neuem Hebelaufbau hält – oder ob das Ganze so wirkt, als wäre die Rally überdehnt, wie das manchmal passiert, wenn Kursanstiege auf dem Wiederaufbau des Open Interest basieren.
$BTC #BTC Price Analysis# #Altcoin Season# $ETH
Das CLARITY-Gesetz ist am 15. September im Senat gescheitert. Bitcoin fiel an diesem selben Tag auf 74.900 US-Dollar, über 600 Millionen US-Dollar in Long-Liquidationen. Sechs Tage später liegt es bei 86.000 US-Dollar, einem Acht-Monats-Hoch. Diese Abfolge ist die eigentliche Geschichte – nicht eine geradlinige Entwicklung vom Scheitern zum Aufschwung.
Die erste Reaktion war bärisch, genau das, was man erwarten würde. Aber die darauf folgende Erholung hatte mit CLARITY eigentlich gar nichts zu tun: Sie kam daher, dass BTC bei 78.000 US-Dollar, dann erneut bei 82.000 US-Dollar, technischen Widerstand durchbrach. Jede dieser Breakouts löste frische Short-Liquidationen aus, die das nächste Aufwärtsstück mit anfeuerten. CoinGlass-Daten zeigen, dass allein seit heute, als der Kurs bei 82.000 US-Dollar die Marke aufgab, ungefähr 750 Millionen US-Dollar an bärischen Positionen ausgelöscht wurden. Dazu kommt etwa die 15,6 Milliarden US-Dollar schwere Fed-Treasury-Bill-Käufe, die ab dem 18. September zu settlementen begannen. Dann erhält man einen Markt, der sich trotz des regulatorischen Rückschlags erholte – nicht wegen ihm.
Es lohnt sich, hier vorsichtig mit der Einordnung zu sein. Wenn man das als CLARITY-getriebenen Schub bezeichnet, überspringt man die tatsächliche Woche: erst ein echtes Abverkaufs-/Selloff-Intermezzo, dann eine separate, technisch und liquiditätsgetriebene Erholung, die lediglich in denselben Zeitraum fiel. Scotts Melker Einschätzung wirkt dem näher, was tatsächlich stimmt: Schlechte Nachrichten haben einfach aufgehört, den Kurs weiter nach unten zu drücken – das ist eine andere Aussage als die, wonach gute Nachrichten den Kurs nach oben treiben.
Das Open Interest ist seit dem Breakout bei 82.000 US-Dollar um grob 2 Milliarden US-Dollar gestiegen. Das bedeutet: Frische Hebel werden in diese Rally wieder eingepreist, statt dass der Move bis hierher rein ein Short-Covering-Event wäre.
Meine ehrliche Einschätzung: Die Kursbewegung ist real und die bärischen Liquidationen sind real. Aber die direkte Zuschreibung speziell zum Scheitern von CLARITY verkehrt die Kausalität. Das sieht eher nach einem Markt aus, der schlimmere Nachrichten eingepreist hat als letztlich eingetreten sind – und der dann aus eigener Dynamik weiter nach oben geklettert ist.
Worauf ich achte: Ob die Spanne von 86.000 bis 90.000 US-Dollar mit neuem Hebelaufbau hält – oder ob das Ganze so wirkt, als wäre die Rally überdehnt, wie das manchmal passiert, wenn Kursanstiege auf dem Wiederaufbau des Open Interest basieren.
$BTC #BTC Price Analysis# #Altcoin Season# $ETH
Die erste Reaktion war bärisch, genau das, was man erwarten würde. Aber die darauf folgende Erholung hatte mit CLARITY eigentlich gar nichts zu tun: Sie kam daher, dass BTC bei 78.000 US-Dollar, dann erneut bei 82.000 US-Dollar, technischen Widerstand durchbrach. Jede dieser Breakouts löste frische Short-Liquidationen aus, die das nächste Aufwärtsstück mit anfeuerten. CoinGlass-Daten zeigen, dass allein seit heute, als der Kurs bei 82.000 US-Dollar die Marke aufgab, ungefähr 750 Millionen US-Dollar an bärischen Positionen ausgelöscht wurden. Dazu kommt etwa die 15,6 Milliarden US-Dollar schwere Fed-Treasury-Bill-Käufe, die ab dem 18. September zu settlementen begannen. Dann erhält man einen Markt, der sich trotz des regulatorischen Rückschlags erholte – nicht wegen ihm.
Es lohnt sich, hier vorsichtig mit der Einordnung zu sein. Wenn man das als CLARITY-getriebenen Schub bezeichnet, überspringt man die tatsächliche Woche: erst ein echtes Abverkaufs-/Selloff-Intermezzo, dann eine separate, technisch und liquiditätsgetriebene Erholung, die lediglich in denselben Zeitraum fiel. Scotts Melker Einschätzung wirkt dem näher, was tatsächlich stimmt: Schlechte Nachrichten haben einfach aufgehört, den Kurs weiter nach unten zu drücken – das ist eine andere Aussage als die, wonach gute Nachrichten den Kurs nach oben treiben.
Das Open Interest ist seit dem Breakout bei 82.000 US-Dollar um grob 2 Milliarden US-Dollar gestiegen. Das bedeutet: Frische Hebel werden in diese Rally wieder eingepreist, statt dass der Move bis hierher rein ein Short-Covering-Event wäre.
Meine ehrliche Einschätzung: Die Kursbewegung ist real und die bärischen Liquidationen sind real. Aber die direkte Zuschreibung speziell zum Scheitern von CLARITY verkehrt die Kausalität. Das sieht eher nach einem Markt aus, der schlimmere Nachrichten eingepreist hat als letztlich eingetreten sind – und der dann aus eigener Dynamik weiter nach oben geklettert ist.
Worauf ich achte: Ob die Spanne von 86.000 bis 90.000 US-Dollar mit neuem Hebelaufbau hält – oder ob das Ganze so wirkt, als wäre die Rally überdehnt, wie das manchmal passiert, wenn Kursanstiege auf dem Wiederaufbau des Open Interest basieren.
$BTC #BTC Price Analysis# #Altcoin Season# $ETH

73
·
--
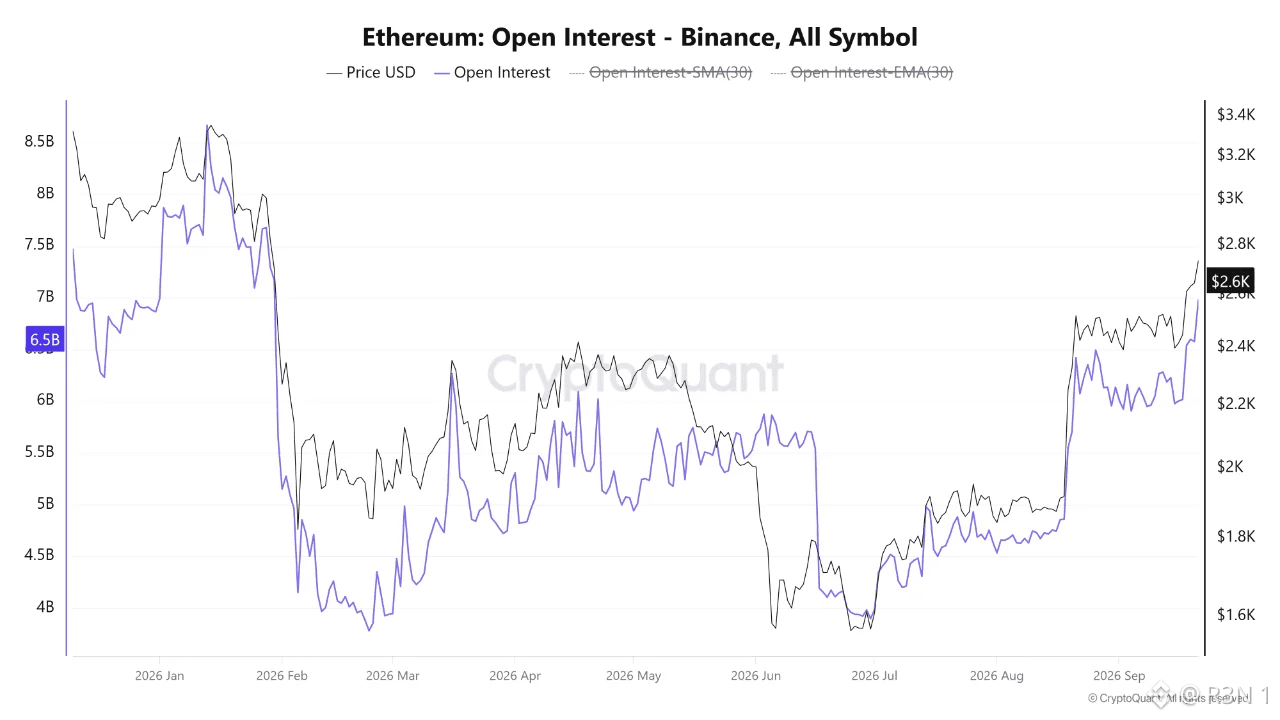
Das Open Interest von Ethereum (ETH) an der Binance ist gerade auf ein Neun-Monats-Hoch gestiegen – ob das bullische Bestätigung ist oder eher ein Hebelrisiko, hängt komplett von einer Detailfrage ab, die allein diese Daten nicht beantworten können. Das Open Interest stieg von rund 4,8 Milliarden US-Dollar Ende August auf etwa 6,58 Milliarden US-Dollar inzwischen – eine echte Beschleunigung durch September, kein langsames Dahintreiben. Gleichzeitig stieg ETH auf ungefähr 2.644 US-Dollar; Kurs und offene Positionen bewegten sich also gemeinsam nach oben. Der Teil, den ich an der Art, wie das normalerweise eingerahmt wird, zurückweisen würde: Steigendes Open Interest zusammen mit steigenden Preisen wird automatisch als bullisch interpretiert – mehr Kapital, mehr Beteiligung, stärkere Überzeugung. Das stimmt zwar, aber es ist unvollständig, ohne die Zusammensetzung zu kennen. Steigendes Open Interest kann bedeuten, dass frische Longs mit echter Überzeugung einsteigen – oder es kann heißen, dass Shorts in eine Falle geraten und zu Verlustpositionen hinzukommen, bevor sie sich irgendwann kapitulieren; oder es kann eine Mischung aus beidem sein, die gleichzeitig passiert. Der Dollarwert allein unterscheidet nicht zwischen diesen Szenarien. Was das tatsächlich klären würde, wären Funding Rates sowie das Long/Short-Verhältnis im selben Zeitraum – beides ist in diesem Datensatz nicht enthalten. Erhöhte positive Funding-Rates zusammen mit diesem OI-Anstieg würden die Lesart „echte bullische Beteiligung“ stützen. Bleiben die Funding Rates hingegen flach oder negativ, während das Open Interest so schnell wächst, würde das auf einen stärker umkämpften Markt hindeuten: Verkäufer drücken gegen den Aufwärtsschub, statt dass Käufer ihn sauber nach oben treiben. Es lohnt sich außerdem, direkt auch die Risikoseite anzusprechen – unabhängig davon, welches Szenario letztlich zutrifft. Ein Neun-Monats-Hoch beim Open Interest bedeutet mehr mit Hebel agierendes Kapital, das gegenüber Preisschwankungen stärker exponiert ist als zu irgendeinem Zeitpunkt seit Januar. Das wirkt in beide Richtungen: Es kann eine Fortsetzung befeuern, wenn der Move hält – oder eine Trendumkehr schneller beschleunigen, wenn der Kurs dreht und Liquidationen auf der Seite erzwingt, die bereits überdehnt ist. Die offene Frage ist nicht, ob die Beteiligung gestiegen ist; die OI-Zahl bestätigt das ganz eindeutig. Entscheidend ist, welche Seite diese Exponierung tatsächlich aufgebaut hat – und genau dieses Detail lässt dieser konkrete Bericht aus. #BTC Price Analysis# $ETH
Das Open Interest von Ethereum (ETH) an der Binance ist gerade auf ein Neun-Monats-Hoch gestiegen – ob das bullische Bestätigung ist oder eher ein Hebelrisiko, hängt komplett von einer Detailfrage ab, die allein diese Daten nicht beantworten können. Das Open Interest stieg von rund 4,8 Milliarden US-Dollar Ende August auf etwa 6,58 Milliarden US-Dollar inzwischen – eine echte Beschleunigung durch September, kein langsames Dahintreiben. Gleichzeitig stieg ETH auf ungefähr 2.644 US-Dollar; Kurs und offene Positionen bewegten sich also gemeinsam nach oben. Der Teil, den ich an der Art, wie das normalerweise eingerahmt wird, zurückweisen würde: Steigendes Open Interest zusammen mit steigenden Preisen wird automatisch als bullisch interpretiert – mehr Kapital, mehr Beteiligung, stärkere Überzeugung. Das stimmt zwar, aber es ist unvollständig, ohne die Zusammensetzung zu kennen. Steigendes Open Interest kann bedeuten, dass frische Longs mit echter Überzeugung einsteigen – oder es kann heißen, dass Shorts in eine Falle geraten und zu Verlustpositionen hinzukommen, bevor sie sich irgendwann kapitulieren; oder es kann eine Mischung aus beidem sein, die gleichzeitig passiert. Der Dollarwert allein unterscheidet nicht zwischen diesen Szenarien. Was das tatsächlich klären würde, wären Funding Rates sowie das Long/Short-Verhältnis im selben Zeitraum – beides ist in diesem Datensatz nicht enthalten. Erhöhte positive Funding-Rates zusammen mit diesem OI-Anstieg würden die Lesart „echte bullische Beteiligung“ stützen. Bleiben die Funding Rates hingegen flach oder negativ, während das Open Interest so schnell wächst, würde das auf einen stärker umkämpften Markt hindeuten: Verkäufer drücken gegen den Aufwärtsschub, statt dass Käufer ihn sauber nach oben treiben. Es lohnt sich außerdem, direkt auch die Risikoseite anzusprechen – unabhängig davon, welches Szenario letztlich zutrifft. Ein Neun-Monats-Hoch beim Open Interest bedeutet mehr mit Hebel agierendes Kapital, das gegenüber Preisschwankungen stärker exponiert ist als zu irgendeinem Zeitpunkt seit Januar. Das wirkt in beide Richtungen: Es kann eine Fortsetzung befeuern, wenn der Move hält – oder eine Trendumkehr schneller beschleunigen, wenn der Kurs dreht und Liquidationen auf der Seite erzwingt, die bereits überdehnt ist. Die offene Frage ist nicht, ob die Beteiligung gestiegen ist; die OI-Zahl bestätigt das ganz eindeutig. Entscheidend ist, welche Seite diese Exponierung tatsächlich aufgebaut hat – und genau dieses Detail lässt dieser konkrete Bericht aus. #BTC Price Analysis# $ETH
27
·
--
100 Millionen POL klingt nach einer großen Zahl, bis man sie gegen die tatsächliche im Umlauf befindliche Menge abgleicht – und auch der Mechanismus selbst hat eine Detail-Note, die auffällt.
Der Burn entspricht 83 % der 121 Millionen POL, die im Basis-Fees-Collector von Polygon liegen, und Sandeep Nailwal sagt, er werde permissionless sein: Jeder kann ihn auslösen, sobald er das Mainnet passiert, nicht nur die Foundation. Bezogen auf das gesamte Angebot sind das jedoch etwa 0,93 % der 10,716 Milliarden POL im Umlauf, laut Blockscout – real, aber bescheiden, also keine Zahl, die den Preis allein mechanisch zwingend in Bewegung setzt.
Was mir auffällt, ist die Umsatzbehauptung, die direkt daneben gestellt wird. Nailwal nannte 24,5 Millionen US-Dollar Umsatz für 2026, vor Arbitrum (8,41 Millionen US-Dollar) und NEAR (5,6 Millionen US-Dollar), führte den Vergleich jedoch auf „meinen Analysten bei ChatGPT“ zurück, ohne ein Datenset oder eine benannte Methodik. Dabei sollte man direkt sein: Eine nicht belegte Behauptung sollte nicht mit derselben Sicherheit bewertet werden wie die Burn-Mechanik, die unabhängig bestätigt ist und bereits auf dem Testnet vorliegt.
Der strukturelle Punkt, der mehr zählt als jede dieser Zahlen, ist, was nach diesem Burn passiert.
Kein einmaliger Schnitt: Es wird ein permissionless quartalsweiser Mechanismus eingerichtet, bei dem angesammelte Basisgebühren künftig verbrannt werden und Netzaktivität direkt in deflationären Druck umgewandelt wird. Nailwal sagt, dass POL seit Januar 2026 netto deflationär ist – unter dem aktuellen Setup. Damit wird formalisiert und öffentlich gemacht, was angeblich bereits intern passiert.
Klarstellen sollte man auch: Der Burn hat noch nicht stattgefunden. Die Contracts sind auf dem Testnet, sie warten auf die finalen Unterschriften des Security Council, bevor es ins Mainnet geht – ein bestätigter Plan, aber noch kein erledigter Deal.
Die offene Frage ist nicht, ob der erste Burn durchgeht; das sieht ziemlich sicher aus. Es geht vielmehr darum, ob der quartalsweise Mechanismus genug wiederkehrendes Fee-Volumen erzeugt, um in großem Maßstab relevant zu sein – denn wenn ein Collector sich langsam wieder auffüllt, ist das eine ganz andere Geschichte als eine einzige Schlagzeilen-Zahl.
$POL #Macro Insights# #Macro Insights#
100 Millionen POL klingt nach einer großen Zahl, bis man sie gegen die tatsächliche im Umlauf befindliche Menge abgleicht – und auch der Mechanismus selbst hat eine Detail-Note, die auffällt.
Der Burn entspricht 83 % der 121 Millionen POL, die im Basis-Fees-Collector von Polygon liegen, und Sandeep Nailwal sagt, er werde permissionless sein: Jeder kann ihn auslösen, sobald er das Mainnet passiert, nicht nur die Foundation. Bezogen auf das gesamte Angebot sind das jedoch etwa 0,93 % der 10,716 Milliarden POL im Umlauf, laut Blockscout – real, aber bescheiden, also keine Zahl, die den Preis allein mechanisch zwingend in Bewegung setzt.
Was mir auffällt, ist die Umsatzbehauptung, die direkt daneben gestellt wird. Nailwal nannte 24,5 Millionen US-Dollar Umsatz für 2026, vor Arbitrum (8,41 Millionen US-Dollar) und NEAR (5,6 Millionen US-Dollar), führte den Vergleich jedoch auf „meinen Analysten bei ChatGPT“ zurück, ohne ein Datenset oder eine benannte Methodik. Dabei sollte man direkt sein: Eine nicht belegte Behauptung sollte nicht mit derselben Sicherheit bewertet werden wie die Burn-Mechanik, die unabhängig bestätigt ist und bereits auf dem Testnet vorliegt.
Der strukturelle Punkt, der mehr zählt als jede dieser Zahlen, ist, was nach diesem Burn passiert.
Kein einmaliger Schnitt: Es wird ein permissionless quartalsweiser Mechanismus eingerichtet, bei dem angesammelte Basisgebühren künftig verbrannt werden und Netzaktivität direkt in deflationären Druck umgewandelt wird. Nailwal sagt, dass POL seit Januar 2026 netto deflationär ist – unter dem aktuellen Setup. Damit wird formalisiert und öffentlich gemacht, was angeblich bereits intern passiert.
Klarstellen sollte man auch: Der Burn hat noch nicht stattgefunden. Die Contracts sind auf dem Testnet, sie warten auf die finalen Unterschriften des Security Council, bevor es ins Mainnet geht – ein bestätigter Plan, aber noch kein erledigter Deal.
Die offene Frage ist nicht, ob der erste Burn durchgeht; das sieht ziemlich sicher aus. Es geht vielmehr darum, ob der quartalsweise Mechanismus genug wiederkehrendes Fee-Volumen erzeugt, um in großem Maßstab relevant zu sein – denn wenn ein Collector sich langsam wieder auffüllt, ist das eine ganz andere Geschichte als eine einzige Schlagzeilen-Zahl.
$POL #Macro Insights# #Macro Insights#
Der Burn entspricht 83 % der 121 Millionen POL, die im Basis-Fees-Collector von Polygon liegen, und Sandeep Nailwal sagt, er werde permissionless sein: Jeder kann ihn auslösen, sobald er das Mainnet passiert, nicht nur die Foundation. Bezogen auf das gesamte Angebot sind das jedoch etwa 0,93 % der 10,716 Milliarden POL im Umlauf, laut Blockscout – real, aber bescheiden, also keine Zahl, die den Preis allein mechanisch zwingend in Bewegung setzt.
Was mir auffällt, ist die Umsatzbehauptung, die direkt daneben gestellt wird. Nailwal nannte 24,5 Millionen US-Dollar Umsatz für 2026, vor Arbitrum (8,41 Millionen US-Dollar) und NEAR (5,6 Millionen US-Dollar), führte den Vergleich jedoch auf „meinen Analysten bei ChatGPT“ zurück, ohne ein Datenset oder eine benannte Methodik. Dabei sollte man direkt sein: Eine nicht belegte Behauptung sollte nicht mit derselben Sicherheit bewertet werden wie die Burn-Mechanik, die unabhängig bestätigt ist und bereits auf dem Testnet vorliegt.
Der strukturelle Punkt, der mehr zählt als jede dieser Zahlen, ist, was nach diesem Burn passiert.
Kein einmaliger Schnitt: Es wird ein permissionless quartalsweiser Mechanismus eingerichtet, bei dem angesammelte Basisgebühren künftig verbrannt werden und Netzaktivität direkt in deflationären Druck umgewandelt wird. Nailwal sagt, dass POL seit Januar 2026 netto deflationär ist – unter dem aktuellen Setup. Damit wird formalisiert und öffentlich gemacht, was angeblich bereits intern passiert.
Klarstellen sollte man auch: Der Burn hat noch nicht stattgefunden. Die Contracts sind auf dem Testnet, sie warten auf die finalen Unterschriften des Security Council, bevor es ins Mainnet geht – ein bestätigter Plan, aber noch kein erledigter Deal.
Die offene Frage ist nicht, ob der erste Burn durchgeht; das sieht ziemlich sicher aus. Es geht vielmehr darum, ob der quartalsweise Mechanismus genug wiederkehrendes Fee-Volumen erzeugt, um in großem Maßstab relevant zu sein – denn wenn ein Collector sich langsam wieder auffüllt, ist das eine ganz andere Geschichte als eine einzige Schlagzeilen-Zahl.
$POL #Macro Insights# #Macro Insights#



1
367
·
--
Der gleiche Trader, der nach dem Selloff im Juni 11,24 Millionen US-Dollar auf einen Short von ZEC gesetzt hatte, hat beim nächsten Versuch mehr als das Dreifache zurückgegeben. Genau darum geht es hier – nicht nur um die Zahl von heute.
Garrett Jin, ehemaliger CEO von BitForex, hat seinen ZEC-Short im Juni neu aufgebaut: mit einer anfänglichen Position von 11.780 ZEC im Wert von etwa 4,92 Millionen US-Dollar. Dann stockte er weiter auf, als Zcash stieg, bis er ihn auf rund 40.000 ZEC anwachsen ließ – bevor er heute 38.000 davon per Market Orders über ungefähr 90 Minuten schloss. Der Exit selbst ließ ZEC kurzzeitig um 2,7% nach oben schnellen, von 1.490 US-Dollar auf 1.530 US-Dollar, und spikte gleichzeitig die Funding Rate von Hyperliquid im Verlauf auf über 170% annualisiert. Die gemeldeten Verlustzahlen unterscheiden sich leicht je nach Quelle: 35,44 Millionen US-Dollar laut Lookonchain und TechFlow, 36,13 Millionen US-Dollar laut Phemex. Erwähnenswert ist hier vor allem die Spanne – nicht dass man eine einzelne Zahl als exakt bis auf den Dollar herausgreift.
Der Kontext ist entscheidend. ZEC liegt im vergangenen Monat ungefähr 178% im Plus, und Zcash-ETFs haben allein letzte Woche 98,2 Millionen US-Dollar eingesammelt – die meiste Summe von allen 14 Produkten in dieser Kategorie. Jin war allerdings nicht der einzige Short-Inhaber, der „gepreßt“ wurde: Laut BeInCrypto befanden sich andere beobachtete Wallets in einem ähnlichen Zeitraum mit kleineren ZEC-Shorts ebenfalls bei einem Minus von 10 bis 12 Millionen US-Dollar. Jin hält nach wie vor 202.078 ZEC im Spot – das entspricht grob 309 Millionen US-Dollar – mit einem geschätzten unrealisierten Gewinn von 221 Millionen US-Dollar auf diese Position. Dazu kommt ein separater 1.330 BTC Long im Wert von etwa 107,77 Millionen US-Dollar.
Mein ehrlicher Eindruck: Der realisierte Verlust auf den Short tilgt nicht, was insgesamt immer noch eine riesige Netto-Position in seinem Vorteil ist. Das liest sich wie genau ein einzelner Trade, der schiefgelaufen ist – innerhalb eines Portfolios, das insgesamt weiterhin deutlich profitabel ist.
Worauf ich achte: Ob Jin wieder in einen ZEC-Short zu einem neuen Niveau einsteigt, angesichts seiner Historie, das nach früheren Verlusten genau so zu tun, oder ob er die Position komplett verlässt.
$ZEC #BTC Price Analysis# #Macro Insights# #BNBChain#
Der gleiche Trader, der nach dem Selloff im Juni 11,24 Millionen US-Dollar auf einen Short von ZEC gesetzt hatte, hat beim nächsten Versuch mehr als das Dreifache zurückgegeben. Genau darum geht es hier – nicht nur um die Zahl von heute.
Garrett Jin, ehemaliger CEO von BitForex, hat seinen ZEC-Short im Juni neu aufgebaut: mit einer anfänglichen Position von 11.780 ZEC im Wert von etwa 4,92 Millionen US-Dollar. Dann stockte er weiter auf, als Zcash stieg, bis er ihn auf rund 40.000 ZEC anwachsen ließ – bevor er heute 38.000 davon per Market Orders über ungefähr 90 Minuten schloss. Der Exit selbst ließ ZEC kurzzeitig um 2,7% nach oben schnellen, von 1.490 US-Dollar auf 1.530 US-Dollar, und spikte gleichzeitig die Funding Rate von Hyperliquid im Verlauf auf über 170% annualisiert. Die gemeldeten Verlustzahlen unterscheiden sich leicht je nach Quelle: 35,44 Millionen US-Dollar laut Lookonchain und TechFlow, 36,13 Millionen US-Dollar laut Phemex. Erwähnenswert ist hier vor allem die Spanne – nicht dass man eine einzelne Zahl als exakt bis auf den Dollar herausgreift.
Der Kontext ist entscheidend. ZEC liegt im vergangenen Monat ungefähr 178% im Plus, und Zcash-ETFs haben allein letzte Woche 98,2 Millionen US-Dollar eingesammelt – die meiste Summe von allen 14 Produkten in dieser Kategorie. Jin war allerdings nicht der einzige Short-Inhaber, der „gepreßt“ wurde: Laut BeInCrypto befanden sich andere beobachtete Wallets in einem ähnlichen Zeitraum mit kleineren ZEC-Shorts ebenfalls bei einem Minus von 10 bis 12 Millionen US-Dollar. Jin hält nach wie vor 202.078 ZEC im Spot – das entspricht grob 309 Millionen US-Dollar – mit einem geschätzten unrealisierten Gewinn von 221 Millionen US-Dollar auf diese Position. Dazu kommt ein separater 1.330 BTC Long im Wert von etwa 107,77 Millionen US-Dollar.
Mein ehrlicher Eindruck: Der realisierte Verlust auf den Short tilgt nicht, was insgesamt immer noch eine riesige Netto-Position in seinem Vorteil ist. Das liest sich wie genau ein einzelner Trade, der schiefgelaufen ist – innerhalb eines Portfolios, das insgesamt weiterhin deutlich profitabel ist.
Worauf ich achte: Ob Jin wieder in einen ZEC-Short zu einem neuen Niveau einsteigt, angesichts seiner Historie, das nach früheren Verlusten genau so zu tun, oder ob er die Position komplett verlässt.
$ZEC #BTC Price Analysis# #Macro Insights# #BNBChain#
Garrett Jin, ehemaliger CEO von BitForex, hat seinen ZEC-Short im Juni neu aufgebaut: mit einer anfänglichen Position von 11.780 ZEC im Wert von etwa 4,92 Millionen US-Dollar. Dann stockte er weiter auf, als Zcash stieg, bis er ihn auf rund 40.000 ZEC anwachsen ließ – bevor er heute 38.000 davon per Market Orders über ungefähr 90 Minuten schloss. Der Exit selbst ließ ZEC kurzzeitig um 2,7% nach oben schnellen, von 1.490 US-Dollar auf 1.530 US-Dollar, und spikte gleichzeitig die Funding Rate von Hyperliquid im Verlauf auf über 170% annualisiert. Die gemeldeten Verlustzahlen unterscheiden sich leicht je nach Quelle: 35,44 Millionen US-Dollar laut Lookonchain und TechFlow, 36,13 Millionen US-Dollar laut Phemex. Erwähnenswert ist hier vor allem die Spanne – nicht dass man eine einzelne Zahl als exakt bis auf den Dollar herausgreift.
Der Kontext ist entscheidend. ZEC liegt im vergangenen Monat ungefähr 178% im Plus, und Zcash-ETFs haben allein letzte Woche 98,2 Millionen US-Dollar eingesammelt – die meiste Summe von allen 14 Produkten in dieser Kategorie. Jin war allerdings nicht der einzige Short-Inhaber, der „gepreßt“ wurde: Laut BeInCrypto befanden sich andere beobachtete Wallets in einem ähnlichen Zeitraum mit kleineren ZEC-Shorts ebenfalls bei einem Minus von 10 bis 12 Millionen US-Dollar. Jin hält nach wie vor 202.078 ZEC im Spot – das entspricht grob 309 Millionen US-Dollar – mit einem geschätzten unrealisierten Gewinn von 221 Millionen US-Dollar auf diese Position. Dazu kommt ein separater 1.330 BTC Long im Wert von etwa 107,77 Millionen US-Dollar.
Mein ehrlicher Eindruck: Der realisierte Verlust auf den Short tilgt nicht, was insgesamt immer noch eine riesige Netto-Position in seinem Vorteil ist. Das liest sich wie genau ein einzelner Trade, der schiefgelaufen ist – innerhalb eines Portfolios, das insgesamt weiterhin deutlich profitabel ist.
Worauf ich achte: Ob Jin wieder in einen ZEC-Short zu einem neuen Niveau einsteigt, angesichts seiner Historie, das nach früheren Verlusten genau so zu tun, oder ob er die Position komplett verlässt.
$ZEC #BTC Price Analysis# #Macro Insights# #BNBChain#
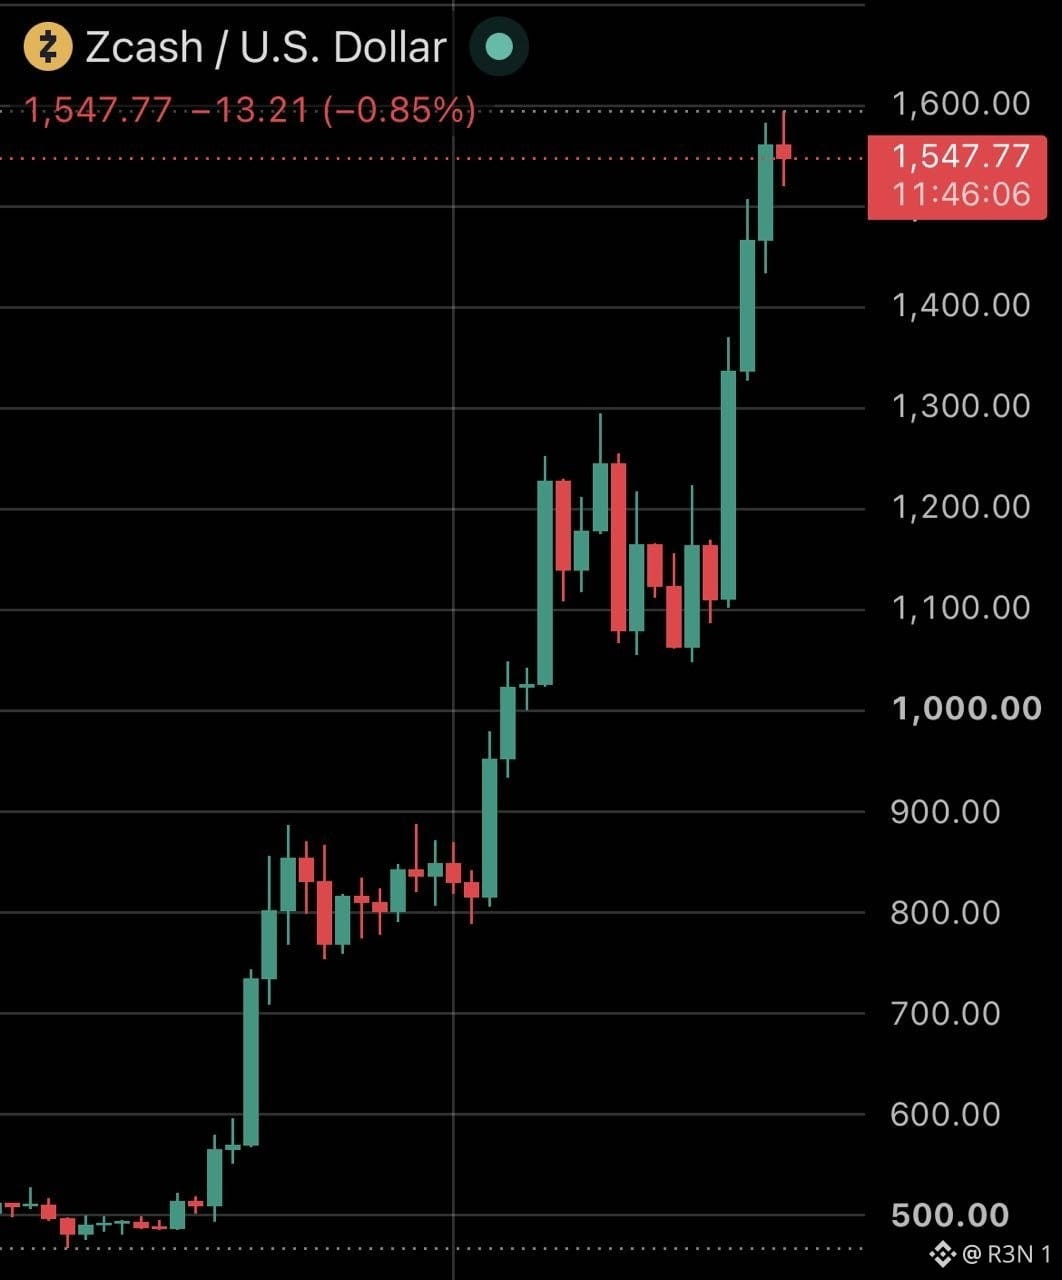

47
·
--
Über 235.000 US-Dollar sind innerhalb von 48 Stunden aus Hunderten von Wallets verschwunden – und niemand nennt die Malware, die das angeblich tut. Diese Lücke zwischen der Dollar-Zahl und den fehlenden Details ist die eigentliche Geschichte.
Die beschriebenen Mechaniken sind ausreichend simpel: Ein Remote-Access-Trojaner stiehlt Zugangsdaten und kapert aktive Sitzungen, um die Authentifizierung komplett zu umgehen. So können Angreifer auf den bereits eingeloggten Zustand eines Opfers aufspringen, statt ein Passwort zu stehlen und sich anschließend separat einzuloggen.
Das ist ein realer, gut verstandener Angriffsmuster. Was fehlt, ist alles, was normalerweise zu einer Behauptung wie dieser gehören würde: keine benannte Malware-Familie, keine bösartigen Domains, keine Dateihashes, keine Command-and-Control-Infrastruktur und keine Sicherheitsforscher, die an die Erkenntnisse angebunden wären.
Aber es gibt einen echten On-Chain-Zug hinter allem. Eine mit dieser Aktivität verknüpfte Ethereum-Adresse tauchte in einem russischsprachigen Telegram-Post auf – zwei Tage, bevor das breitere „Malware“-Framing sich ausbreitete. Dort wurde es als neue „Drainer Wallet“ beschrieben und behauptet, ähnliche Adressen würden mindestens 200.000 US-Dollar pro Tag einsammeln. Auch diese Aussage wurde bislang nicht unabhängig verifiziert, aber es ist im Moment das Nächstliegende an hartem Beleg, der an irgendetwas davon angebunden ist.
Mein ehrlicher Eindruck: Es passiert etwas Reales. Hunderte von Opfern und eine dokumentierte Wallet sind nicht nichts. Aber im Moment ist das eine Wallet-Bilanz mit einer Schlagzeile daran – nicht eine ausgearbeitete Malware-Kampagne. Es als bestätigte RAT-Operation mit bekannten Mechaniken zu bezeichnen, geht weiter, als das, was tatsächlich gezeigt wurde.
Was ich vor einer Einordnung als „abgeschlossen“ bräuchte: ein konkreter Sicherheitsbericht, der den genauen Stamm benennt und erklärt, wie er sich verbreitet. Denn genau dieses eine Teil fehlt in jeder Version dieser Geschichte noch immer.
$BTC #Altcoin Season# $ETH #BTC Price Analysis#
Über 235.000 US-Dollar sind innerhalb von 48 Stunden aus Hunderten von Wallets verschwunden – und niemand nennt die Malware, die das angeblich tut. Diese Lücke zwischen der Dollar-Zahl und den fehlenden Details ist die eigentliche Geschichte.
Die beschriebenen Mechaniken sind ausreichend simpel: Ein Remote-Access-Trojaner stiehlt Zugangsdaten und kapert aktive Sitzungen, um die Authentifizierung komplett zu umgehen. So können Angreifer auf den bereits eingeloggten Zustand eines Opfers aufspringen, statt ein Passwort zu stehlen und sich anschließend separat einzuloggen.
Das ist ein realer, gut verstandener Angriffsmuster. Was fehlt, ist alles, was normalerweise zu einer Behauptung wie dieser gehören würde: keine benannte Malware-Familie, keine bösartigen Domains, keine Dateihashes, keine Command-and-Control-Infrastruktur und keine Sicherheitsforscher, die an die Erkenntnisse angebunden wären.
Aber es gibt einen echten On-Chain-Zug hinter allem. Eine mit dieser Aktivität verknüpfte Ethereum-Adresse tauchte in einem russischsprachigen Telegram-Post auf – zwei Tage, bevor das breitere „Malware“-Framing sich ausbreitete. Dort wurde es als neue „Drainer Wallet“ beschrieben und behauptet, ähnliche Adressen würden mindestens 200.000 US-Dollar pro Tag einsammeln. Auch diese Aussage wurde bislang nicht unabhängig verifiziert, aber es ist im Moment das Nächstliegende an hartem Beleg, der an irgendetwas davon angebunden ist.
Mein ehrlicher Eindruck: Es passiert etwas Reales. Hunderte von Opfern und eine dokumentierte Wallet sind nicht nichts. Aber im Moment ist das eine Wallet-Bilanz mit einer Schlagzeile daran – nicht eine ausgearbeitete Malware-Kampagne. Es als bestätigte RAT-Operation mit bekannten Mechaniken zu bezeichnen, geht weiter, als das, was tatsächlich gezeigt wurde.
Was ich vor einer Einordnung als „abgeschlossen“ bräuchte: ein konkreter Sicherheitsbericht, der den genauen Stamm benennt und erklärt, wie er sich verbreitet. Denn genau dieses eine Teil fehlt in jeder Version dieser Geschichte noch immer.
$BTC #Altcoin Season# $ETH #BTC Price Analysis#
Die beschriebenen Mechaniken sind ausreichend simpel: Ein Remote-Access-Trojaner stiehlt Zugangsdaten und kapert aktive Sitzungen, um die Authentifizierung komplett zu umgehen. So können Angreifer auf den bereits eingeloggten Zustand eines Opfers aufspringen, statt ein Passwort zu stehlen und sich anschließend separat einzuloggen.
Das ist ein realer, gut verstandener Angriffsmuster. Was fehlt, ist alles, was normalerweise zu einer Behauptung wie dieser gehören würde: keine benannte Malware-Familie, keine bösartigen Domains, keine Dateihashes, keine Command-and-Control-Infrastruktur und keine Sicherheitsforscher, die an die Erkenntnisse angebunden wären.
Aber es gibt einen echten On-Chain-Zug hinter allem. Eine mit dieser Aktivität verknüpfte Ethereum-Adresse tauchte in einem russischsprachigen Telegram-Post auf – zwei Tage, bevor das breitere „Malware“-Framing sich ausbreitete. Dort wurde es als neue „Drainer Wallet“ beschrieben und behauptet, ähnliche Adressen würden mindestens 200.000 US-Dollar pro Tag einsammeln. Auch diese Aussage wurde bislang nicht unabhängig verifiziert, aber es ist im Moment das Nächstliegende an hartem Beleg, der an irgendetwas davon angebunden ist.
Mein ehrlicher Eindruck: Es passiert etwas Reales. Hunderte von Opfern und eine dokumentierte Wallet sind nicht nichts. Aber im Moment ist das eine Wallet-Bilanz mit einer Schlagzeile daran – nicht eine ausgearbeitete Malware-Kampagne. Es als bestätigte RAT-Operation mit bekannten Mechaniken zu bezeichnen, geht weiter, als das, was tatsächlich gezeigt wurde.
Was ich vor einer Einordnung als „abgeschlossen“ bräuchte: ein konkreter Sicherheitsbericht, der den genauen Stamm benennt und erklärt, wie er sich verbreitet. Denn genau dieses eine Teil fehlt in jeder Version dieser Geschichte noch immer.
$BTC #Altcoin Season# $ETH #BTC Price Analysis#
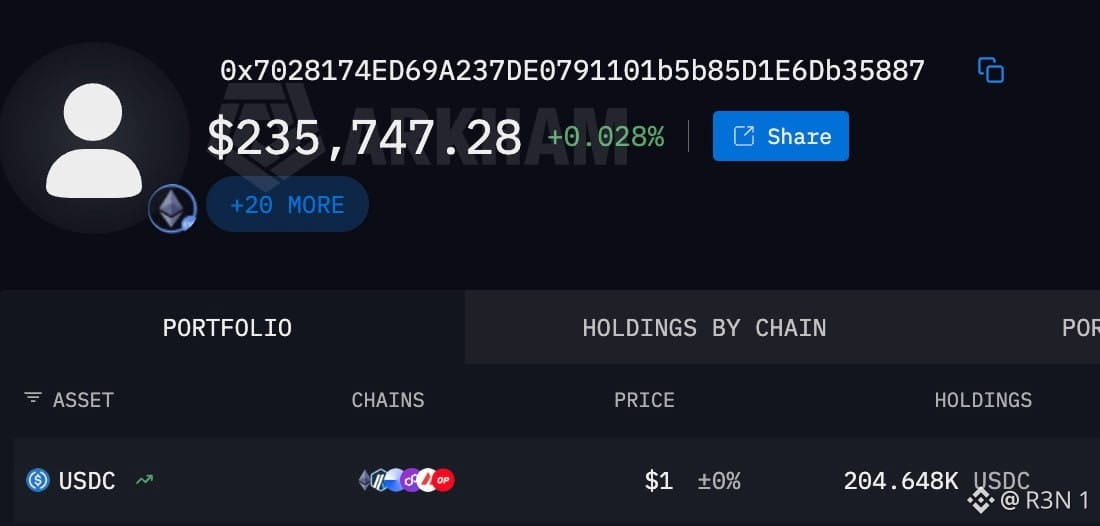
60
·
--
NEAR ist in den vergangenen sieben Tagen um 80,95% gestiegen und kletterte von etwa 2,30 US-Dollar auf 4,16 US-Dollar – eine der markanteren Wochenbewegungen am Markt im Moment. Die Marktkapitalisierung sprang allein in letzter Zeit von 4,51 Mrd. US-Dollar auf 5,61 Mrd. US-Dollar, und das in etwas mehr als einem Tag, bei 4,31 Mrd. US-Dollar im Volumen.
Der Auslöser dahinter ist real und bereits ausgeliefert – nicht nur eine Story. NEAR hat am 17. September vertrauliche Perpetual-Futures gelaunched, angetrieben von der Execution Engine von Hyperliquid. Dadurch können Trader Positionen eröffnen, ohne sie öffentlich mit ihren Konten zu verknüpfen.
Das Funding bleibt privat, die Abwicklung erfolgt auf einem öffentlichen Orderbuch. Das ist eine bedeutende Designentscheidung: Die meisten dezentralen Perp-Handelsplätze, inklusive der nativen Benutzeroberfläche von Hyperliquid, halten die Kontobewegungen vollständig nachvollziehbar. Das TVL in diesem Produkt erreichte 70 Millionen US-Dollar und löste ein Anreizprogramm aus, das 333.333 Tokens freischaltet, sobald der dreitägige volumengewichtete Durchschnittspreis bei oder über 3,33 US-Dollar liegt. Das 24-Stunden-Handelsvolumen soll parallel zum Move um über 120% angestiegen sein.
Was ich hier wirklich interessant finde, ist die strukturelle Entscheidung: NEAR hat die Execution vollständig an Hyperliquid ausgelagert, statt sein eigenes Orderbuch von Grund auf neu zu bauen. Dabei wird auf etwa 240 Mrd. US-Dollar an monatlichem Perp-Volumen von Hyperliquid zurückgegriffen, statt Liquidität von null aufzubauen.
Mein ehrlicher Eindruck: Dieser Run hat echte Fundamentaldaten dahinter – ein ausgeliefertes Produkt mit tatsächlichem TVL, nicht nur mit Narrativ. Allerdings soll der wöchentliche RSI Berichten zufolge über 70 liegen, also im überkauften Bereich, und ein Teil dieses Moves hängt speziell mit dieser Incentive-Schwelle zusammen. Das erzeugt eine eigene Art von reflexivem Druck rund um 3,33.
Was ich beobachte: Ob NEAR über dieser Incentive-Schwelle bleibt, sobald das Token-Unlock-Event vorbei ist, oder ob dies nachlässt, sobald die mechanische Nachfrage dahinter wegfällt.
#BTC Price Analysis# #Macro Insights# $NEAR
NEAR ist in den vergangenen sieben Tagen um 80,95% gestiegen und kletterte von etwa 2,30 US-Dollar auf 4,16 US-Dollar – eine der markanteren Wochenbewegungen am Markt im Moment. Die Marktkapitalisierung sprang allein in letzter Zeit von 4,51 Mrd. US-Dollar auf 5,61 Mrd. US-Dollar, und das in etwas mehr als einem Tag, bei 4,31 Mrd. US-Dollar im Volumen.
Der Auslöser dahinter ist real und bereits ausgeliefert – nicht nur eine Story. NEAR hat am 17. September vertrauliche Perpetual-Futures gelaunched, angetrieben von der Execution Engine von Hyperliquid. Dadurch können Trader Positionen eröffnen, ohne sie öffentlich mit ihren Konten zu verknüpfen.
Das Funding bleibt privat, die Abwicklung erfolgt auf einem öffentlichen Orderbuch. Das ist eine bedeutende Designentscheidung: Die meisten dezentralen Perp-Handelsplätze, inklusive der nativen Benutzeroberfläche von Hyperliquid, halten die Kontobewegungen vollständig nachvollziehbar. Das TVL in diesem Produkt erreichte 70 Millionen US-Dollar und löste ein Anreizprogramm aus, das 333.333 Tokens freischaltet, sobald der dreitägige volumengewichtete Durchschnittspreis bei oder über 3,33 US-Dollar liegt. Das 24-Stunden-Handelsvolumen soll parallel zum Move um über 120% angestiegen sein.
Was ich hier wirklich interessant finde, ist die strukturelle Entscheidung: NEAR hat die Execution vollständig an Hyperliquid ausgelagert, statt sein eigenes Orderbuch von Grund auf neu zu bauen. Dabei wird auf etwa 240 Mrd. US-Dollar an monatlichem Perp-Volumen von Hyperliquid zurückgegriffen, statt Liquidität von null aufzubauen.
Mein ehrlicher Eindruck: Dieser Run hat echte Fundamentaldaten dahinter – ein ausgeliefertes Produkt mit tatsächlichem TVL, nicht nur mit Narrativ. Allerdings soll der wöchentliche RSI Berichten zufolge über 70 liegen, also im überkauften Bereich, und ein Teil dieses Moves hängt speziell mit dieser Incentive-Schwelle zusammen. Das erzeugt eine eigene Art von reflexivem Druck rund um 3,33.
Was ich beobachte: Ob NEAR über dieser Incentive-Schwelle bleibt, sobald das Token-Unlock-Event vorbei ist, oder ob dies nachlässt, sobald die mechanische Nachfrage dahinter wegfällt.
#BTC Price Analysis# #Macro Insights# $NEAR
Der Auslöser dahinter ist real und bereits ausgeliefert – nicht nur eine Story. NEAR hat am 17. September vertrauliche Perpetual-Futures gelaunched, angetrieben von der Execution Engine von Hyperliquid. Dadurch können Trader Positionen eröffnen, ohne sie öffentlich mit ihren Konten zu verknüpfen.
Das Funding bleibt privat, die Abwicklung erfolgt auf einem öffentlichen Orderbuch. Das ist eine bedeutende Designentscheidung: Die meisten dezentralen Perp-Handelsplätze, inklusive der nativen Benutzeroberfläche von Hyperliquid, halten die Kontobewegungen vollständig nachvollziehbar. Das TVL in diesem Produkt erreichte 70 Millionen US-Dollar und löste ein Anreizprogramm aus, das 333.333 Tokens freischaltet, sobald der dreitägige volumengewichtete Durchschnittspreis bei oder über 3,33 US-Dollar liegt. Das 24-Stunden-Handelsvolumen soll parallel zum Move um über 120% angestiegen sein.
Was ich hier wirklich interessant finde, ist die strukturelle Entscheidung: NEAR hat die Execution vollständig an Hyperliquid ausgelagert, statt sein eigenes Orderbuch von Grund auf neu zu bauen. Dabei wird auf etwa 240 Mrd. US-Dollar an monatlichem Perp-Volumen von Hyperliquid zurückgegriffen, statt Liquidität von null aufzubauen.
Mein ehrlicher Eindruck: Dieser Run hat echte Fundamentaldaten dahinter – ein ausgeliefertes Produkt mit tatsächlichem TVL, nicht nur mit Narrativ. Allerdings soll der wöchentliche RSI Berichten zufolge über 70 liegen, also im überkauften Bereich, und ein Teil dieses Moves hängt speziell mit dieser Incentive-Schwelle zusammen. Das erzeugt eine eigene Art von reflexivem Druck rund um 3,33.
Was ich beobachte: Ob NEAR über dieser Incentive-Schwelle bleibt, sobald das Token-Unlock-Event vorbei ist, oder ob dies nachlässt, sobald die mechanische Nachfrage dahinter wegfällt.
#BTC Price Analysis# #Macro Insights# $NEAR
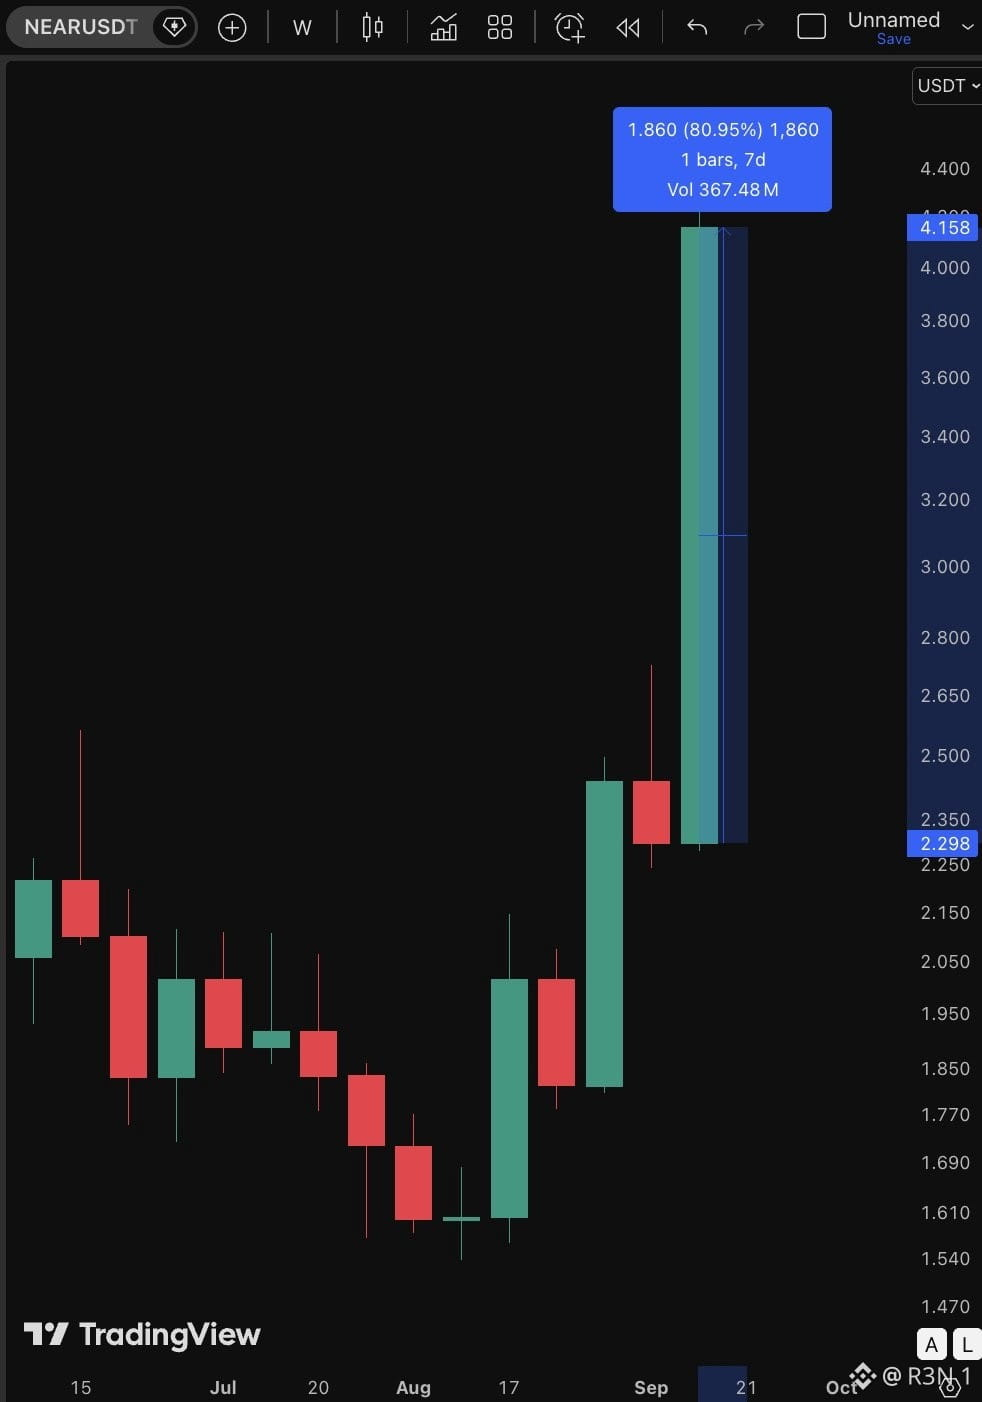
26
·
--
Ein bisschen mehr Orange." Das ist der komplette Post – keine Dollarzahl, kein BTC-Count, nur Saylor, der heute auf X den Bitcoin-Tracker von Strategy teilt. Die Märkte werten das ohnehin als Kaufsignal, und historisch hat sich diese Lesart häufiger bewahrheitet als nicht.
Strategy hat die letzte bestätigte Anschaffung am 31. August getätigt: 4.603 BTC zu einem durchschnittlichen Preis von 80.318 US-Dollar. Damit belaufen sich die Bestände auf insgesamt ungefähr 846.060 BTC aus 114 Käufen – weiterhin die mit Abstand größte Unternehmensposition in Bitcoin. Seitdem ist das Unternehmen beim Aufstocken eher still geblieben und konzentriert sich stattdessen darauf, sein STRC-Vorzugsaktienpaket zurückzukaufen. Dieses ist inzwischen auf 98,51 US-Dollar geklettert, nahe an seinem 100-Dollar-Nennwert, nachdem es in diesem Jahr zeitweise bis auf 75 US-Dollar gefallen war.
Es lohnt sich, hier ehrlich zur Erfolgsbilanz zu sein, statt jeden Teaser als garantiert zu behandeln. Saylors kryptische Posts, „We’re ₿ack“, „Orange or Green“ und jetzt „A little more orange“, gingen schon mehrmals tatsächlichen Käufen voraus. AMBCrypto hat jedoch speziell darauf hingewiesen, dass mehrere jüngste Teaser eher BTC-Verkäufe ankündigten statt Rallyes. Es gibt noch keine bestätigte Transaktion: Das ist Mustererkennung anhand der Social-Media-Beiträge einer öffentlichen Person – kein angekündigter Kauf.
Mein ehrlicher Eindruck: Die Basisrate dafür, dass aus solchen Posts innerhalb weniger Tage tatsächlich ein realer Kauf folgt, ist aufgrund von Strategys Historie wirklich hoch – das ist nicht „nichts“. Aber es als bestätigtes Signal zu bezeichnen, bevor die tatsächliche 8-K-Meldung oder eine Pressemitteilung landet, überzeichnet, was ein Zwei-Wort-Post tatsächlich über den nächsten Schritt aussagt.
Worauf ich achte: Ob Strategy in den nächsten Tagen eine tatsächliche Offenlegung des Kaufs einreicht – und falls ja, zu welchem Preis das geschieht, angesichts der eigenen Volatilität von BTC rund um die Schlagzeilen der Fed und CLARITY dieser Woche.
$BTC #BTC Price Analysis# #Bitcoin Price Prediction: What is Bitcoins next move?#
Ein bisschen mehr Orange." Das ist der komplette Post – keine Dollarzahl, kein BTC-Count, nur Saylor, der heute auf X den Bitcoin-Tracker von Strategy teilt. Die Märkte werten das ohnehin als Kaufsignal, und historisch hat sich diese Lesart häufiger bewahrheitet als nicht.
Strategy hat die letzte bestätigte Anschaffung am 31. August getätigt: 4.603 BTC zu einem durchschnittlichen Preis von 80.318 US-Dollar. Damit belaufen sich die Bestände auf insgesamt ungefähr 846.060 BTC aus 114 Käufen – weiterhin die mit Abstand größte Unternehmensposition in Bitcoin. Seitdem ist das Unternehmen beim Aufstocken eher still geblieben und konzentriert sich stattdessen darauf, sein STRC-Vorzugsaktienpaket zurückzukaufen. Dieses ist inzwischen auf 98,51 US-Dollar geklettert, nahe an seinem 100-Dollar-Nennwert, nachdem es in diesem Jahr zeitweise bis auf 75 US-Dollar gefallen war.
Es lohnt sich, hier ehrlich zur Erfolgsbilanz zu sein, statt jeden Teaser als garantiert zu behandeln. Saylors kryptische Posts, „We’re ₿ack“, „Orange or Green“ und jetzt „A little more orange“, gingen schon mehrmals tatsächlichen Käufen voraus. AMBCrypto hat jedoch speziell darauf hingewiesen, dass mehrere jüngste Teaser eher BTC-Verkäufe ankündigten statt Rallyes. Es gibt noch keine bestätigte Transaktion: Das ist Mustererkennung anhand der Social-Media-Beiträge einer öffentlichen Person – kein angekündigter Kauf.
Mein ehrlicher Eindruck: Die Basisrate dafür, dass aus solchen Posts innerhalb weniger Tage tatsächlich ein realer Kauf folgt, ist aufgrund von Strategys Historie wirklich hoch – das ist nicht „nichts“. Aber es als bestätigtes Signal zu bezeichnen, bevor die tatsächliche 8-K-Meldung oder eine Pressemitteilung landet, überzeichnet, was ein Zwei-Wort-Post tatsächlich über den nächsten Schritt aussagt.
Worauf ich achte: Ob Strategy in den nächsten Tagen eine tatsächliche Offenlegung des Kaufs einreicht – und falls ja, zu welchem Preis das geschieht, angesichts der eigenen Volatilität von BTC rund um die Schlagzeilen der Fed und CLARITY dieser Woche.
$BTC #BTC Price Analysis# #Bitcoin Price Prediction: What is Bitcoins next move?#
Strategy hat die letzte bestätigte Anschaffung am 31. August getätigt: 4.603 BTC zu einem durchschnittlichen Preis von 80.318 US-Dollar. Damit belaufen sich die Bestände auf insgesamt ungefähr 846.060 BTC aus 114 Käufen – weiterhin die mit Abstand größte Unternehmensposition in Bitcoin. Seitdem ist das Unternehmen beim Aufstocken eher still geblieben und konzentriert sich stattdessen darauf, sein STRC-Vorzugsaktienpaket zurückzukaufen. Dieses ist inzwischen auf 98,51 US-Dollar geklettert, nahe an seinem 100-Dollar-Nennwert, nachdem es in diesem Jahr zeitweise bis auf 75 US-Dollar gefallen war.
Es lohnt sich, hier ehrlich zur Erfolgsbilanz zu sein, statt jeden Teaser als garantiert zu behandeln. Saylors kryptische Posts, „We’re ₿ack“, „Orange or Green“ und jetzt „A little more orange“, gingen schon mehrmals tatsächlichen Käufen voraus. AMBCrypto hat jedoch speziell darauf hingewiesen, dass mehrere jüngste Teaser eher BTC-Verkäufe ankündigten statt Rallyes. Es gibt noch keine bestätigte Transaktion: Das ist Mustererkennung anhand der Social-Media-Beiträge einer öffentlichen Person – kein angekündigter Kauf.
Mein ehrlicher Eindruck: Die Basisrate dafür, dass aus solchen Posts innerhalb weniger Tage tatsächlich ein realer Kauf folgt, ist aufgrund von Strategys Historie wirklich hoch – das ist nicht „nichts“. Aber es als bestätigtes Signal zu bezeichnen, bevor die tatsächliche 8-K-Meldung oder eine Pressemitteilung landet, überzeichnet, was ein Zwei-Wort-Post tatsächlich über den nächsten Schritt aussagt.
Worauf ich achte: Ob Strategy in den nächsten Tagen eine tatsächliche Offenlegung des Kaufs einreicht – und falls ja, zu welchem Preis das geschieht, angesichts der eigenen Volatilität von BTC rund um die Schlagzeilen der Fed und CLARITY dieser Woche.
$BTC #BTC Price Analysis# #Bitcoin Price Prediction: What is Bitcoins next move?#
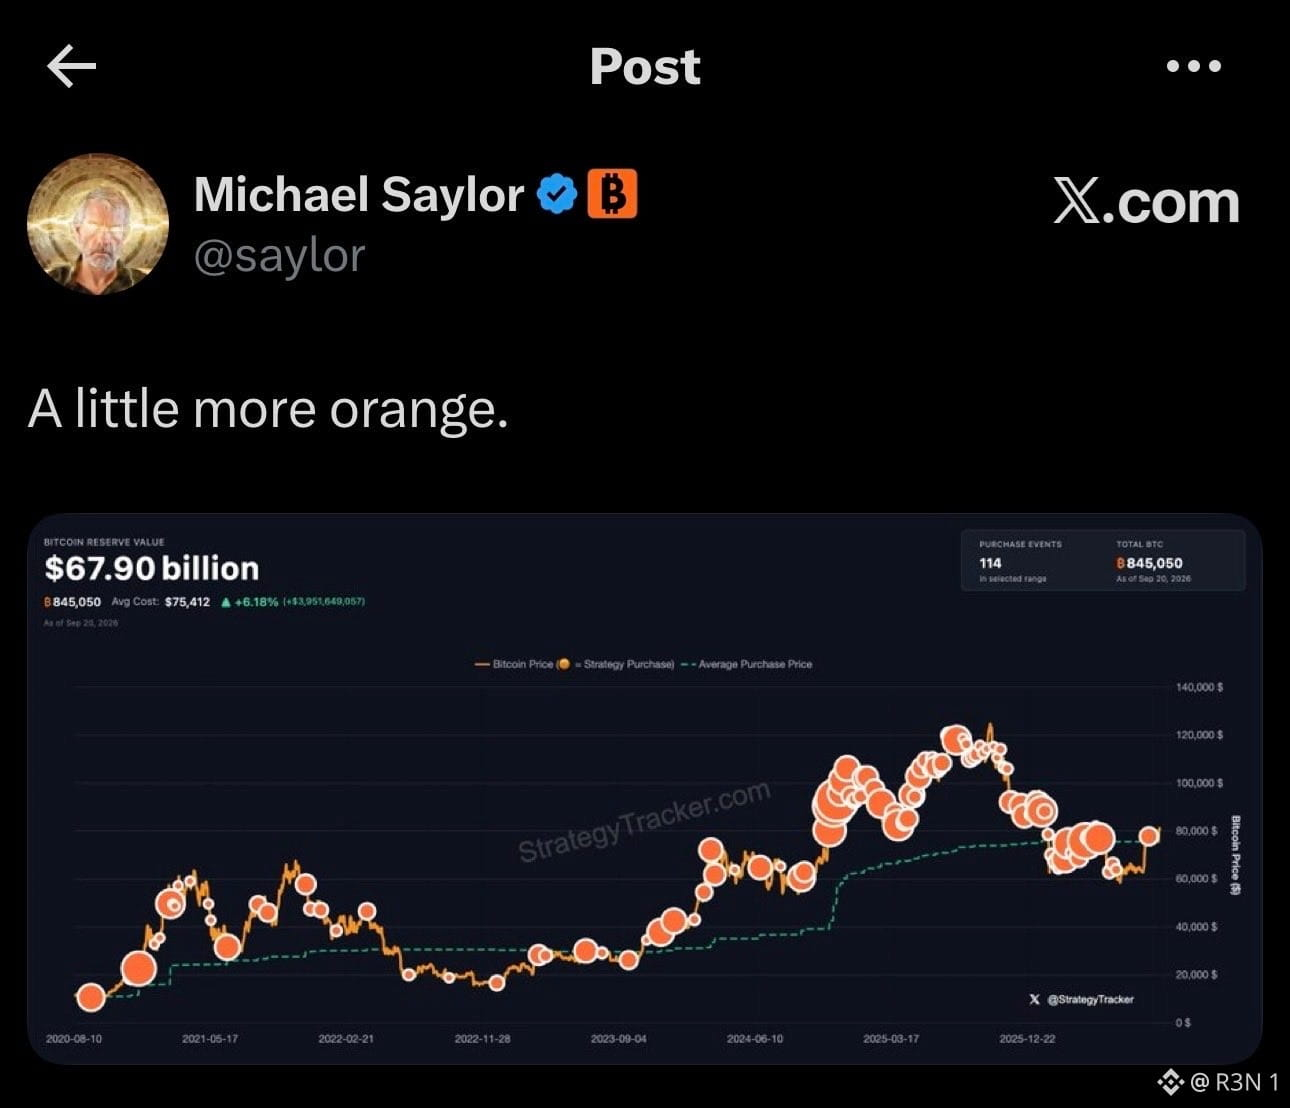
84
·
--
Sui hat gerade die 16 Milliarden Lifetime-Transaktionen überschritten und nähert sich der Marke von 18 Milliarden. Und der nützlichere Vergleich hier ist nicht die rohe Gesamtsumme, sondern die darunterliegende Beschleunigungskurve.
SuiVision-Daten setzten die Zahl vor etwa einer Woche auf ungefähr 16,17 Milliarden. Wenn sie jetzt nahe bei 16,44 Milliarden liegt und in Richtung 18 Milliarden drängt, dann ist das ein echtes, anhaltendes Wachstumstempo – kein einmaliger Peak durch ein einzelnes Ereignis oder eine Airdrop-Farming-Welle.
Was mir dabei auffällt, ist, wie das im Vergleich zu Sui's eigenen jüngsten Stresstests steht. Das Netzwerk zeigte in einem kontrollierten Juli-Experiment mit offchain programmierbaren Payment-Tunneln einen Peak von über 6 Millionen TPS. Diese Zahl ist ausdrücklich nicht mit der üblichen täglichen Durchsatzrate vergleichbar, da sie gebündelte Aktivitäten abbildet und nicht die dauerhaft anhaltende On-Chain-Last. Die 80,3 TPS-Zahl – unabhängig davon, wie aktuell sie ist – ist die ehrlichere Einschätzung dafür, wie die typische Netzwerkaktivität im Alltag tatsächlich aussieht.
Ein Kontext, der wichtig ist, um die Transaktionszahl selbst zu interpretieren: Sui verarbeitet einfache Transfers mit minimalem Konsens-Overhead. Strukturell führt das dazu, dass die Roh-Transaktionszahlen im Vergleich zu Chains, bei denen jede Aktion durch den vollständigen Konsens geht, höher ausfallen. Das ist keine Kritik, sondern eine Designentscheidung: Sie macht Sui's Transaktions-Total wirklich schwer, ohne Anpassungen für das zu vergleichen, was in jedem System als „Transaktion“ zählt.
Die offene Frage ist nicht, ob Sui 18 Milliarden erreicht – die Entwicklung deutet darauf hin, dass es passieren wird. Die Frage ist, ob dieses Wachstum durch nachhaltige Nutzung getragen wird: durch stabilecoin-basierte Abwicklungen, das Hashi-Bitcoin-Kollateralprotokoll, echte Anwendungsaktivität – oder ob ein bedeutender Anteil aus niedrigwertigen, hochfrequenten Transfers besteht, die die Zahl aufblähen, ohne dass das eine proportionalen Abbildung wirtschaftlicher Aktivität im Netzwerk entspricht.
#BTC Price Analysis# #Macro Insights# #Macro Insights# $SUI
Sui hat gerade die 16 Milliarden Lifetime-Transaktionen überschritten und nähert sich der Marke von 18 Milliarden. Und der nützlichere Vergleich hier ist nicht die rohe Gesamtsumme, sondern die darunterliegende Beschleunigungskurve.
SuiVision-Daten setzten die Zahl vor etwa einer Woche auf ungefähr 16,17 Milliarden. Wenn sie jetzt nahe bei 16,44 Milliarden liegt und in Richtung 18 Milliarden drängt, dann ist das ein echtes, anhaltendes Wachstumstempo – kein einmaliger Peak durch ein einzelnes Ereignis oder eine Airdrop-Farming-Welle.
Was mir dabei auffällt, ist, wie das im Vergleich zu Sui's eigenen jüngsten Stresstests steht. Das Netzwerk zeigte in einem kontrollierten Juli-Experiment mit offchain programmierbaren Payment-Tunneln einen Peak von über 6 Millionen TPS. Diese Zahl ist ausdrücklich nicht mit der üblichen täglichen Durchsatzrate vergleichbar, da sie gebündelte Aktivitäten abbildet und nicht die dauerhaft anhaltende On-Chain-Last. Die 80,3 TPS-Zahl – unabhängig davon, wie aktuell sie ist – ist die ehrlichere Einschätzung dafür, wie die typische Netzwerkaktivität im Alltag tatsächlich aussieht.
Ein Kontext, der wichtig ist, um die Transaktionszahl selbst zu interpretieren: Sui verarbeitet einfache Transfers mit minimalem Konsens-Overhead. Strukturell führt das dazu, dass die Roh-Transaktionszahlen im Vergleich zu Chains, bei denen jede Aktion durch den vollständigen Konsens geht, höher ausfallen. Das ist keine Kritik, sondern eine Designentscheidung: Sie macht Sui's Transaktions-Total wirklich schwer, ohne Anpassungen für das zu vergleichen, was in jedem System als „Transaktion“ zählt.
Die offene Frage ist nicht, ob Sui 18 Milliarden erreicht – die Entwicklung deutet darauf hin, dass es passieren wird. Die Frage ist, ob dieses Wachstum durch nachhaltige Nutzung getragen wird: durch stabilecoin-basierte Abwicklungen, das Hashi-Bitcoin-Kollateralprotokoll, echte Anwendungsaktivität – oder ob ein bedeutender Anteil aus niedrigwertigen, hochfrequenten Transfers besteht, die die Zahl aufblähen, ohne dass das eine proportionalen Abbildung wirtschaftlicher Aktivität im Netzwerk entspricht.
#BTC Price Analysis# #Macro Insights# #Macro Insights# $SUI
SuiVision-Daten setzten die Zahl vor etwa einer Woche auf ungefähr 16,17 Milliarden. Wenn sie jetzt nahe bei 16,44 Milliarden liegt und in Richtung 18 Milliarden drängt, dann ist das ein echtes, anhaltendes Wachstumstempo – kein einmaliger Peak durch ein einzelnes Ereignis oder eine Airdrop-Farming-Welle.
Was mir dabei auffällt, ist, wie das im Vergleich zu Sui's eigenen jüngsten Stresstests steht. Das Netzwerk zeigte in einem kontrollierten Juli-Experiment mit offchain programmierbaren Payment-Tunneln einen Peak von über 6 Millionen TPS. Diese Zahl ist ausdrücklich nicht mit der üblichen täglichen Durchsatzrate vergleichbar, da sie gebündelte Aktivitäten abbildet und nicht die dauerhaft anhaltende On-Chain-Last. Die 80,3 TPS-Zahl – unabhängig davon, wie aktuell sie ist – ist die ehrlichere Einschätzung dafür, wie die typische Netzwerkaktivität im Alltag tatsächlich aussieht.
Ein Kontext, der wichtig ist, um die Transaktionszahl selbst zu interpretieren: Sui verarbeitet einfache Transfers mit minimalem Konsens-Overhead. Strukturell führt das dazu, dass die Roh-Transaktionszahlen im Vergleich zu Chains, bei denen jede Aktion durch den vollständigen Konsens geht, höher ausfallen. Das ist keine Kritik, sondern eine Designentscheidung: Sie macht Sui's Transaktions-Total wirklich schwer, ohne Anpassungen für das zu vergleichen, was in jedem System als „Transaktion“ zählt.
Die offene Frage ist nicht, ob Sui 18 Milliarden erreicht – die Entwicklung deutet darauf hin, dass es passieren wird. Die Frage ist, ob dieses Wachstum durch nachhaltige Nutzung getragen wird: durch stabilecoin-basierte Abwicklungen, das Hashi-Bitcoin-Kollateralprotokoll, echte Anwendungsaktivität – oder ob ein bedeutender Anteil aus niedrigwertigen, hochfrequenten Transfers besteht, die die Zahl aufblähen, ohne dass das eine proportionalen Abbildung wirtschaftlicher Aktivität im Netzwerk entspricht.
#BTC Price Analysis# #Macro Insights# #Macro Insights# $SUI
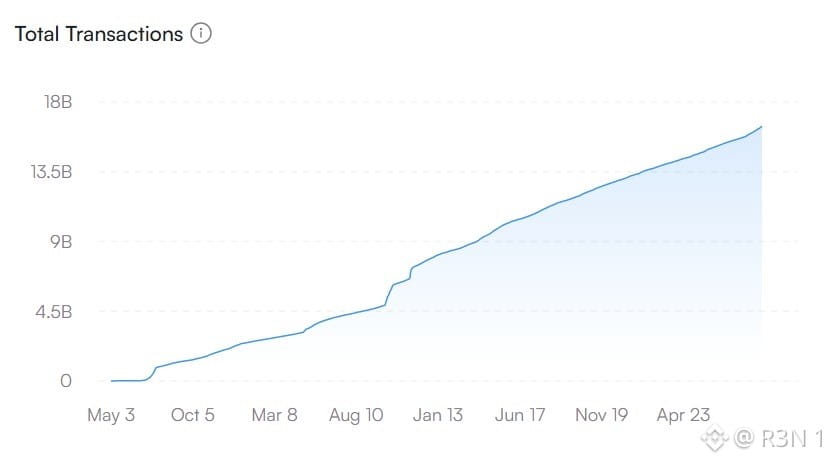
52
·
--
MSTR schlug den Zweitplatzierten beim Nasdaq-100-Finish deutlich mit mehr als dem Doppelten Abstand. Meta gewann im selben Monat 21,9 %, Strategy gewann 47,7 bis 48 %, je nach der genauen Quelle, und wurde damit der beste Einzelwert im gesamten Index.
Die Aktie schloss am 18. September bei 153,92 US-Dollar, nachdem allein an einem einzigen Handelstag ein Sprung von 16,39 % gelungen war. Zwei Kräfte treiben das laut mehreren Berichten zusammen. Der offensichtliche erste Treiber ist der eigene Vorstoß von Bitcoin zurück in Richtung 80.000 US-Dollar; MSTR handelt als starkes Beta-Proxy für BTC, gestützt durch die Bilanz. Der zweite Treiber ist regulatorisch: Der Ausschuss für Finanzdienstleistungen des US-Repräsentantenhauses arbeitet an einem Gesetzesentwurf für eine Strategische Bitcoin-Reserve, und die SEC erteilt eine separate Ausnahme im Zusammenhang mit tokenisiertem Wertpapierhandel. Beide Maßnahmen fallen in dasselbe Zeitfenster und liefern zusätzlich Rückenwind für die Preisbewegung.
Es lohnt sich, direkt zu benennen, was MSTR an diesem Punkt tatsächlich ist. Funktional ist es eine Ein-Asset-Gesellschaft: Das Software-Geschäft existiert zwar noch auf dem Papier, ist aber im Vergleich zu den Bitcoin-Beständen, die die Bilanz dominieren, praktisch nur eine Rundungsgröße. Das ist im Grunde die gesamte Investment-These: MSTR bietet regulierten Börsenhandel Zugang zu einer konzentrierten BTC-Exposure, ohne Wallets oder Custody einzubeziehen. Aber das Schicksal der Aktie hängt nahezu vollständig von der Kursentwicklung von Bitcoin selbst ab, wobei der Hebel in die Struktur der Bilanz eingebaut ist.
Meine ehrliche Einschätzung: Das ist eine legitime, gut dokumentierte Outperformance, keine isolierte Anomalie. Sie folgt sauber der eigenen Bewegung von BTC und den realen regulatorischen Katalysatoren, die zeitgleich auftreffen. Allerdings funktioniert das Konzentrationsrisiko in beide Richtungen: Dieselbe Struktur, die in einem Monat, in dem BTC stieg, 48 % ermöglichte, würde bei einer Gegenbewegung von BTC ebenso eine entsprechend große Bewegung erzeugen.
Darauf schaue ich: Ob sich MSTRs Aufschlag auf seine tatsächlichen Bitcoin-Bestände von hier aus ausweitet oder verengt, denn diese Spanne ist für den weiteren Kursverlauf dieser Aktie ebenso entscheidend wie der BTC-Preis selbst.
$BTC #Altcoin Season# #BTC Price Analysis# $XAUt
MSTR schlug den Zweitplatzierten beim Nasdaq-100-Finish deutlich mit mehr als dem Doppelten Abstand. Meta gewann im selben Monat 21,9 %, Strategy gewann 47,7 bis 48 %, je nach der genauen Quelle, und wurde damit der beste Einzelwert im gesamten Index.
Die Aktie schloss am 18. September bei 153,92 US-Dollar, nachdem allein an einem einzigen Handelstag ein Sprung von 16,39 % gelungen war. Zwei Kräfte treiben das laut mehreren Berichten zusammen. Der offensichtliche erste Treiber ist der eigene Vorstoß von Bitcoin zurück in Richtung 80.000 US-Dollar; MSTR handelt als starkes Beta-Proxy für BTC, gestützt durch die Bilanz. Der zweite Treiber ist regulatorisch: Der Ausschuss für Finanzdienstleistungen des US-Repräsentantenhauses arbeitet an einem Gesetzesentwurf für eine Strategische Bitcoin-Reserve, und die SEC erteilt eine separate Ausnahme im Zusammenhang mit tokenisiertem Wertpapierhandel. Beide Maßnahmen fallen in dasselbe Zeitfenster und liefern zusätzlich Rückenwind für die Preisbewegung.
Es lohnt sich, direkt zu benennen, was MSTR an diesem Punkt tatsächlich ist. Funktional ist es eine Ein-Asset-Gesellschaft: Das Software-Geschäft existiert zwar noch auf dem Papier, ist aber im Vergleich zu den Bitcoin-Beständen, die die Bilanz dominieren, praktisch nur eine Rundungsgröße. Das ist im Grunde die gesamte Investment-These: MSTR bietet regulierten Börsenhandel Zugang zu einer konzentrierten BTC-Exposure, ohne Wallets oder Custody einzubeziehen. Aber das Schicksal der Aktie hängt nahezu vollständig von der Kursentwicklung von Bitcoin selbst ab, wobei der Hebel in die Struktur der Bilanz eingebaut ist.
Meine ehrliche Einschätzung: Das ist eine legitime, gut dokumentierte Outperformance, keine isolierte Anomalie. Sie folgt sauber der eigenen Bewegung von BTC und den realen regulatorischen Katalysatoren, die zeitgleich auftreffen. Allerdings funktioniert das Konzentrationsrisiko in beide Richtungen: Dieselbe Struktur, die in einem Monat, in dem BTC stieg, 48 % ermöglichte, würde bei einer Gegenbewegung von BTC ebenso eine entsprechend große Bewegung erzeugen.
Darauf schaue ich: Ob sich MSTRs Aufschlag auf seine tatsächlichen Bitcoin-Bestände von hier aus ausweitet oder verengt, denn diese Spanne ist für den weiteren Kursverlauf dieser Aktie ebenso entscheidend wie der BTC-Preis selbst.
$BTC #Altcoin Season# #BTC Price Analysis# $XAUt
Die Aktie schloss am 18. September bei 153,92 US-Dollar, nachdem allein an einem einzigen Handelstag ein Sprung von 16,39 % gelungen war. Zwei Kräfte treiben das laut mehreren Berichten zusammen. Der offensichtliche erste Treiber ist der eigene Vorstoß von Bitcoin zurück in Richtung 80.000 US-Dollar; MSTR handelt als starkes Beta-Proxy für BTC, gestützt durch die Bilanz. Der zweite Treiber ist regulatorisch: Der Ausschuss für Finanzdienstleistungen des US-Repräsentantenhauses arbeitet an einem Gesetzesentwurf für eine Strategische Bitcoin-Reserve, und die SEC erteilt eine separate Ausnahme im Zusammenhang mit tokenisiertem Wertpapierhandel. Beide Maßnahmen fallen in dasselbe Zeitfenster und liefern zusätzlich Rückenwind für die Preisbewegung.
Es lohnt sich, direkt zu benennen, was MSTR an diesem Punkt tatsächlich ist. Funktional ist es eine Ein-Asset-Gesellschaft: Das Software-Geschäft existiert zwar noch auf dem Papier, ist aber im Vergleich zu den Bitcoin-Beständen, die die Bilanz dominieren, praktisch nur eine Rundungsgröße. Das ist im Grunde die gesamte Investment-These: MSTR bietet regulierten Börsenhandel Zugang zu einer konzentrierten BTC-Exposure, ohne Wallets oder Custody einzubeziehen. Aber das Schicksal der Aktie hängt nahezu vollständig von der Kursentwicklung von Bitcoin selbst ab, wobei der Hebel in die Struktur der Bilanz eingebaut ist.
Meine ehrliche Einschätzung: Das ist eine legitime, gut dokumentierte Outperformance, keine isolierte Anomalie. Sie folgt sauber der eigenen Bewegung von BTC und den realen regulatorischen Katalysatoren, die zeitgleich auftreffen. Allerdings funktioniert das Konzentrationsrisiko in beide Richtungen: Dieselbe Struktur, die in einem Monat, in dem BTC stieg, 48 % ermöglichte, würde bei einer Gegenbewegung von BTC ebenso eine entsprechend große Bewegung erzeugen.
Darauf schaue ich: Ob sich MSTRs Aufschlag auf seine tatsächlichen Bitcoin-Bestände von hier aus ausweitet oder verengt, denn diese Spanne ist für den weiteren Kursverlauf dieser Aktie ebenso entscheidend wie der BTC-Preis selbst.
$BTC #Altcoin Season# #BTC Price Analysis# $XAUt
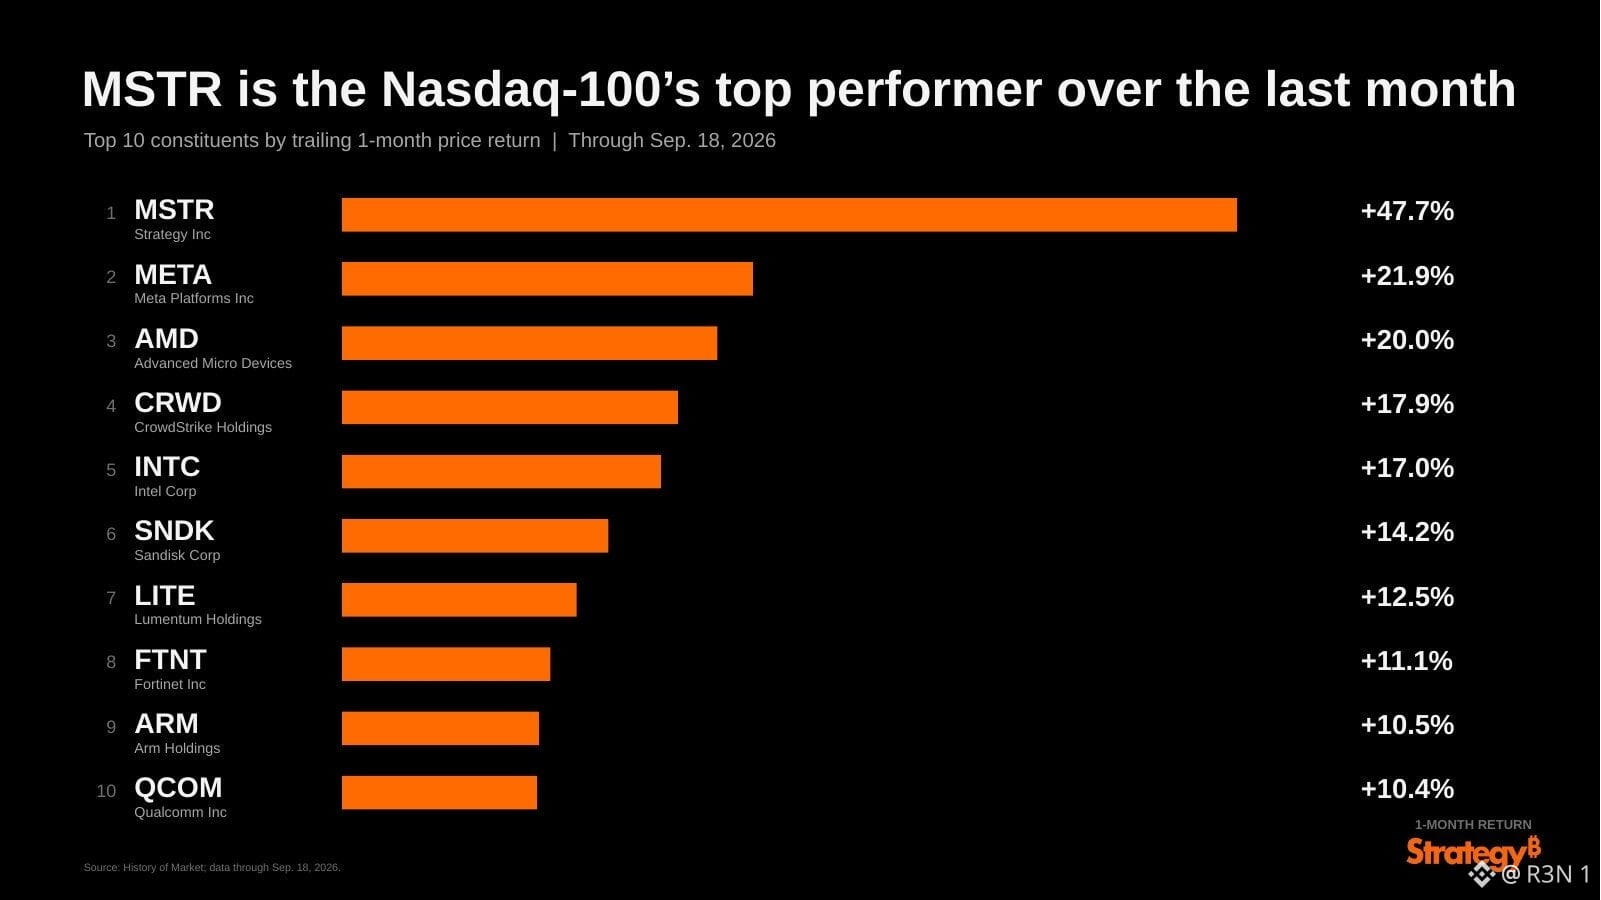
58
Anmelden und weiter Inhalte entdecken
Krypto-Nutzer weltweit auf Binance Square kennenlernen
⚡️ Bleib in Sachen Krypto stets am Puls.
💬 Die weltgrößte Kryptobörse vertraut darauf.
👍 Erhalte verlässliche Einblicke von verifizierten Creators.
E-Mail-Adresse/Telefonnummer