
Anonymustrader
222 Beiträge

Anonymustrader
Crypto explorer turning market chaos into opportunity. Risk-taker, trend-hunter
Trade eröffnen
Regelmäßiger Trader
1.5 Jahre
144 Following
186 Follower
244 Like gegeben
Beiträge
Portfolio
Alle
Zitierungen
Videos
Übersetzung ansehen
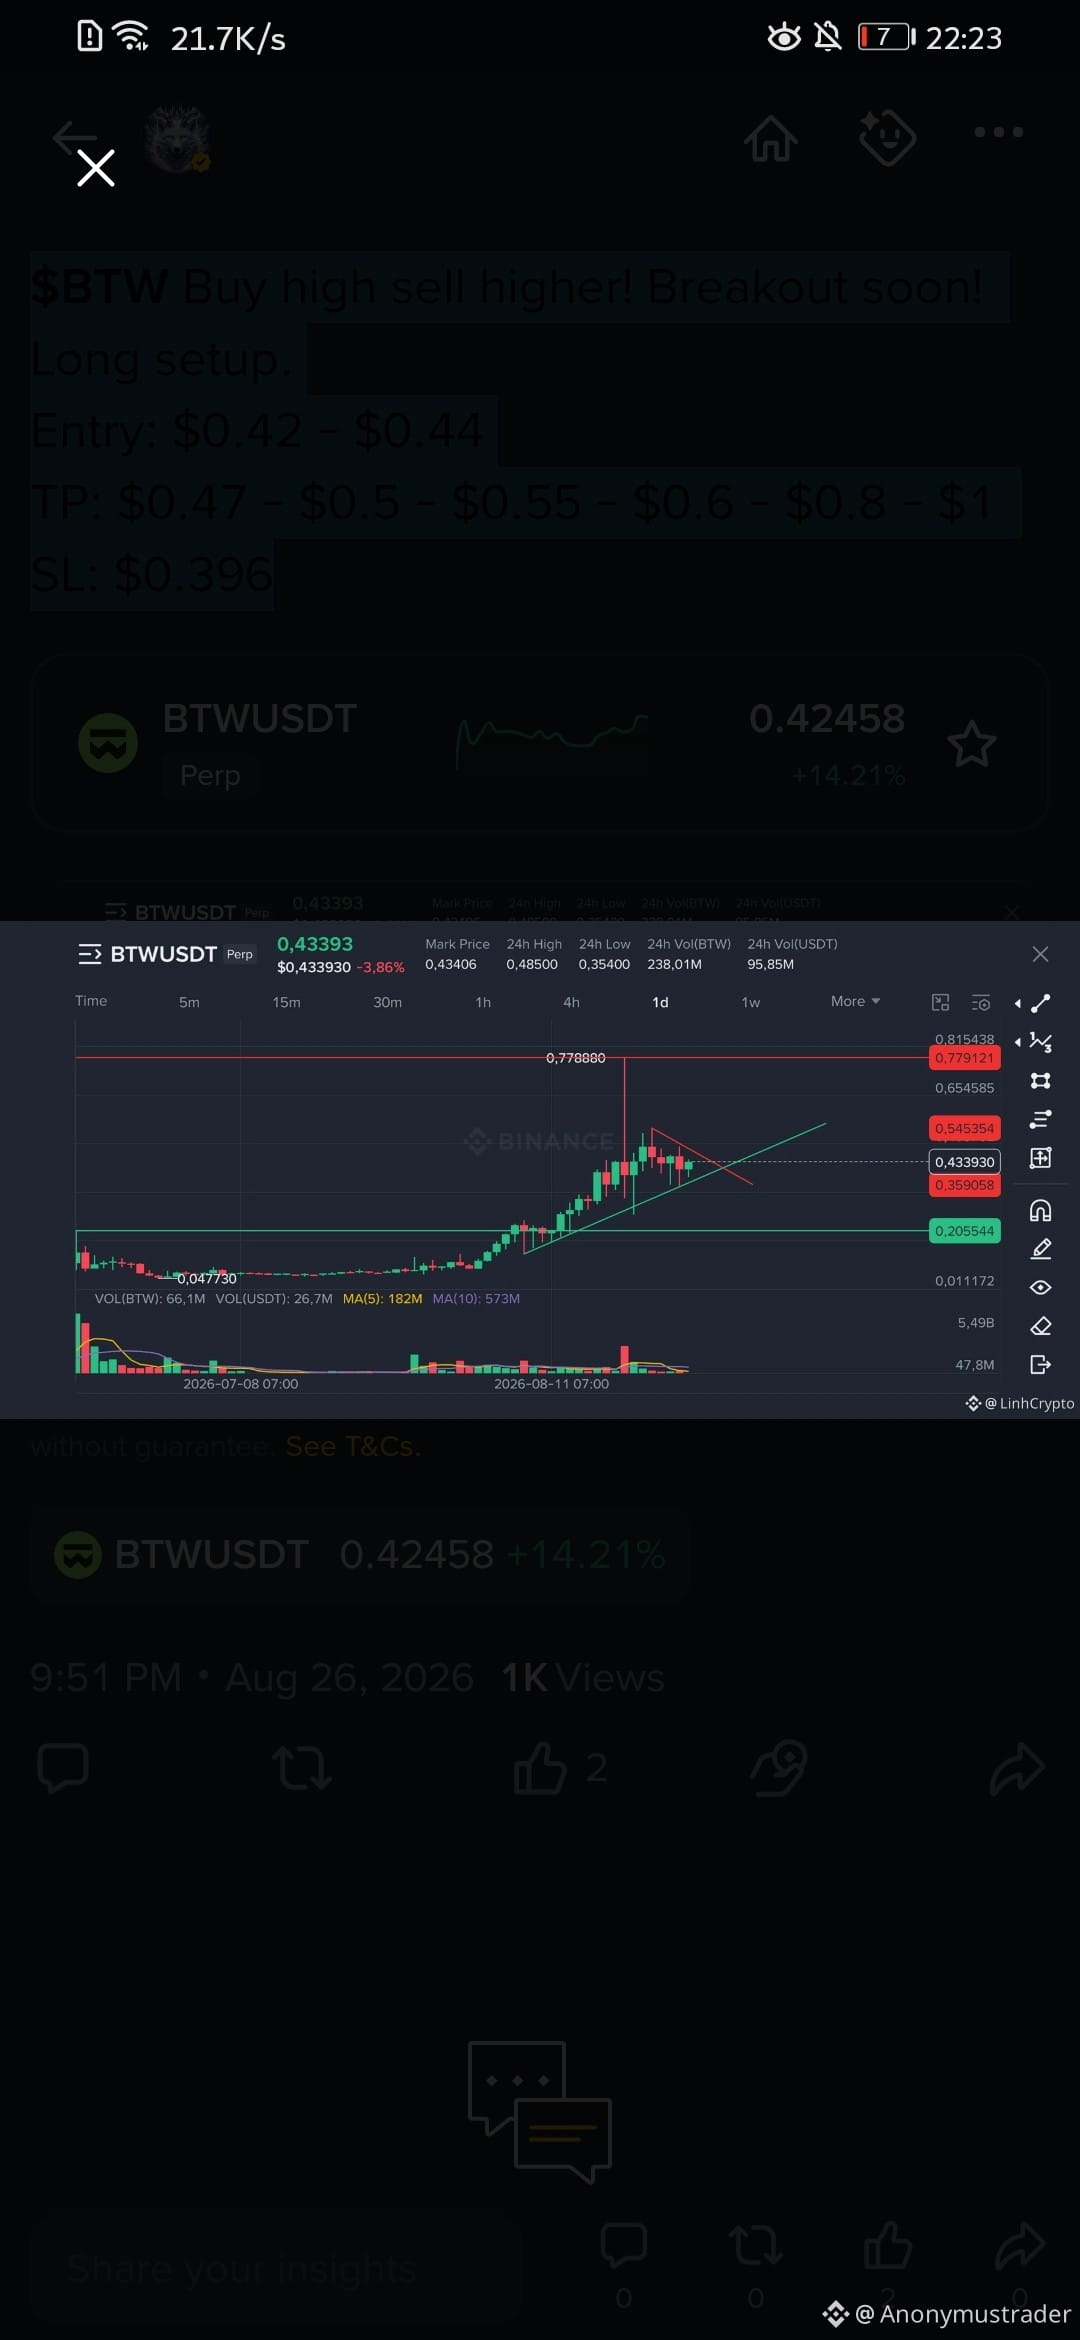
$BTW Buy high sell higher! Breakout soon! Long setup.
Entry: $0.42 - $0.44
TP: $0.47 - $0.5 - $0.55 - $0.6 - $0.8 - $1
SL: $0.396
#CryptoSignals #TradingSetup
Entry: $0.42 - $0.44
TP: $0.47 - $0.5 - $0.55 - $0.6 - $0.8 - $1
SL: $0.396
#CryptoSignals #TradingSetup
Übersetzung ansehen
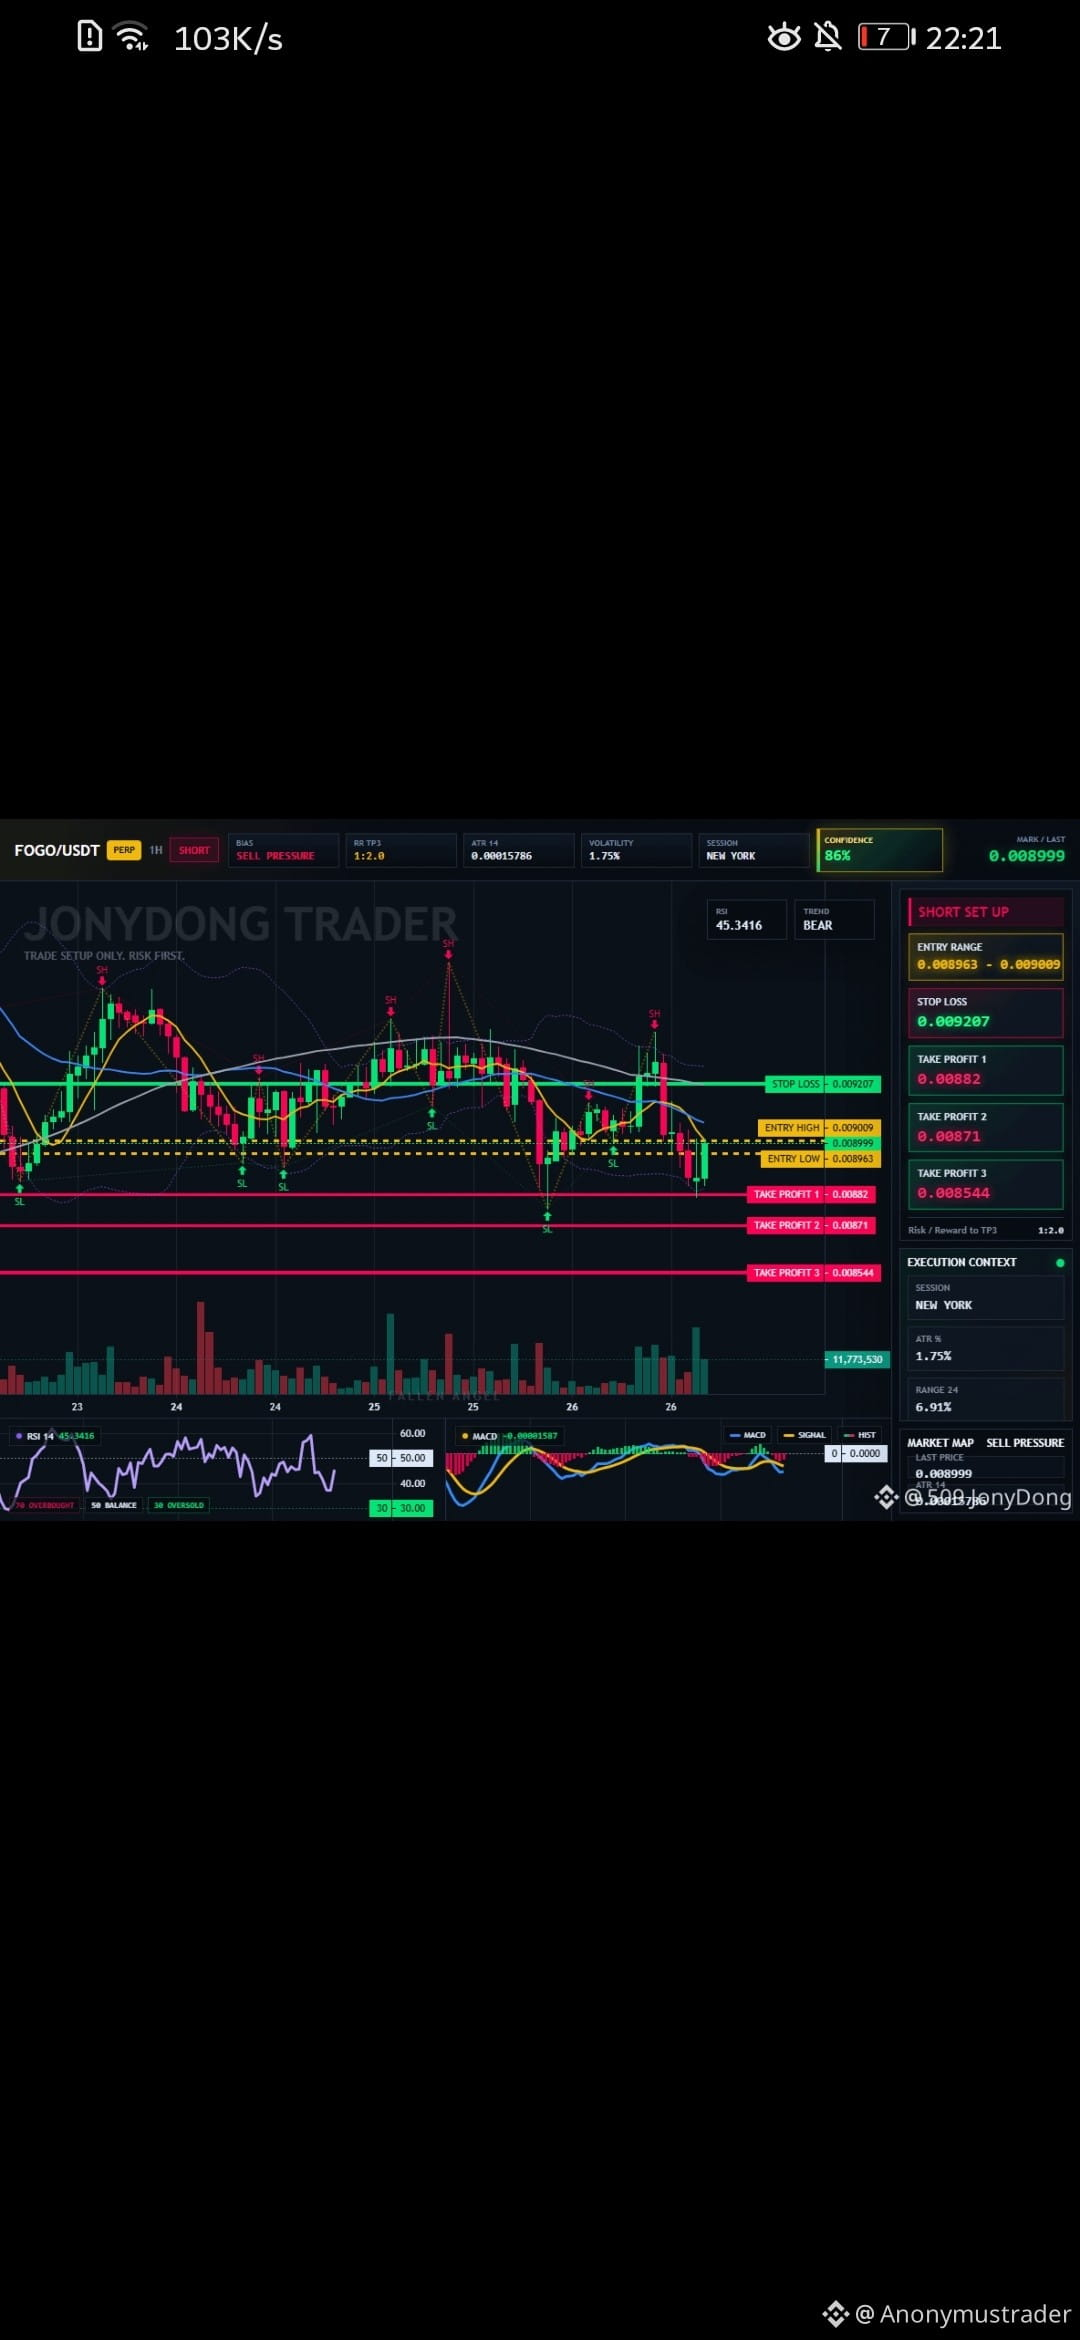
$FOGO Short 50x | Supply must hold or the idea is cancelled.
I sold my BMW bike to short
FOGO just tapped the zone I mapped out — this is where the trade gets real. I'm in this short with a clear invalidation — no guessing from mid-range.
Trade Plan:
- Entry: 0.00896 – 0.00901
- TP1: 0.00882 (R:R 1:0.8)
- TP2: 0.00871 (R:R 1:1.2)
- TP3: 0.00854 (R:R 1:2.0)
- SL: 0.00921
I sold my BMW bike to short
FOGO just tapped the zone I mapped out — this is where the trade gets real. I'm in this short with a clear invalidation — no guessing from mid-range.
Trade Plan:
- Entry: 0.00896 – 0.00901
- TP1: 0.00882 (R:R 1:0.8)
- TP2: 0.00871 (R:R 1:1.2)
- TP3: 0.00854 (R:R 1:2.0)
- SL: 0.00921
Lasst uns Geld drucken 💵
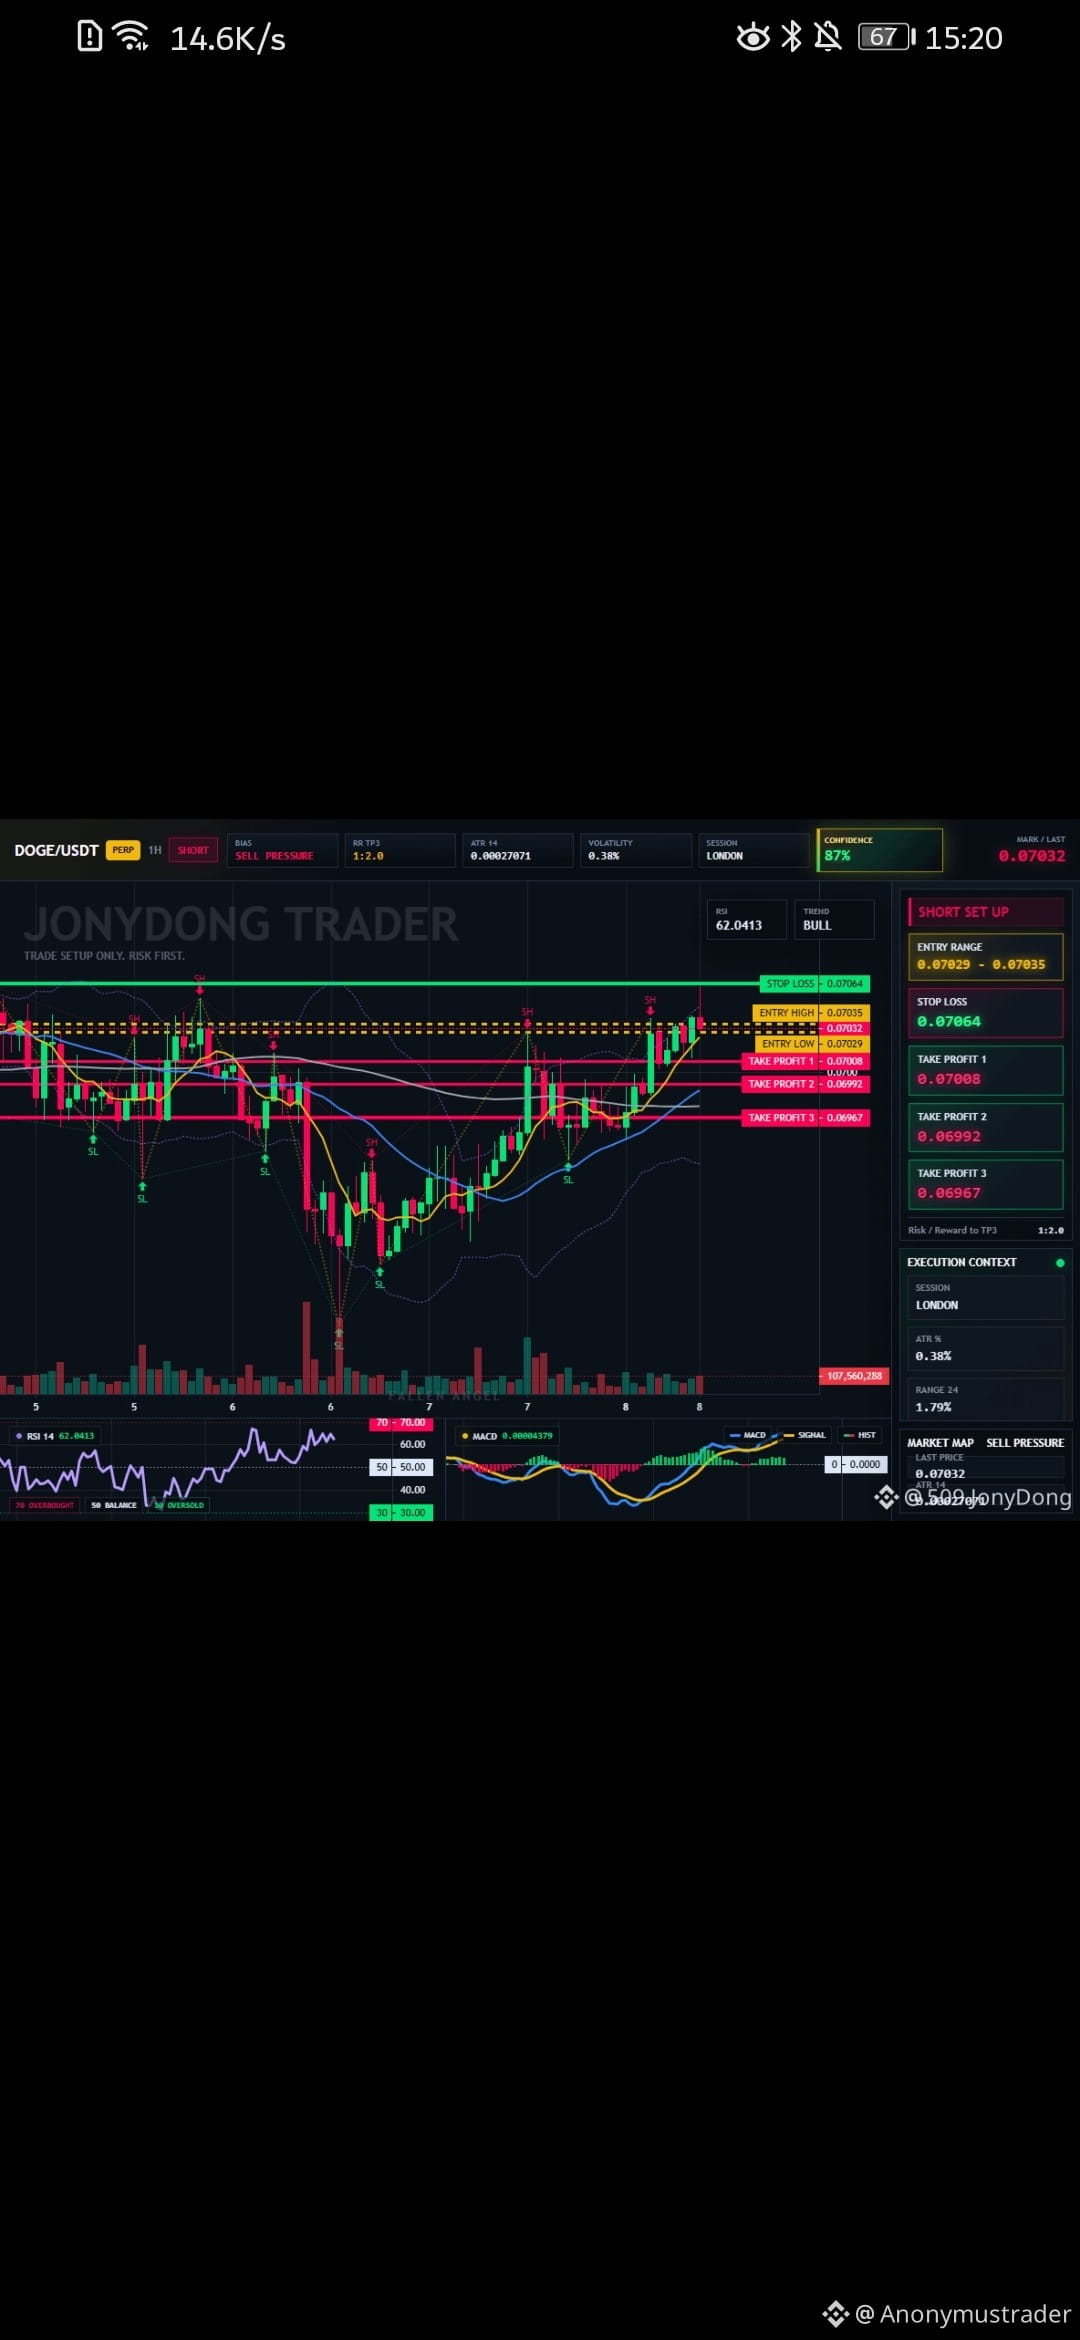
$DOGE Kurz 75x | Live bei Supply, Risiko definiert.
DOGE drückt endlich in die Zone, die ich eingezeichnet habe—das ist der Plan, keine Reaktion. Ich bin in diesem Short mit einer klaren Invalidierung—kein Raten aus dem Mid-Range.
Trade-Plan:
- Einstieg: 0.07029 – 0.07035
- TP1: 0.07008 (R:R 1:0.7)
- TP2: 0.06992 (R:R 1:1.2)
- TP3: 0.06967 (R:R 1:2.0)
- SL: 0.07064
#Crypto
$DOGE Kurz 75x | Live bei Supply, Risiko definiert.
DOGE drückt endlich in die Zone, die ich eingezeichnet habe—das ist der Plan, keine Reaktion. Ich bin in diesem Short mit einer klaren Invalidierung—kein Raten aus dem Mid-Range.
Trade-Plan:
- Einstieg: 0.07029 – 0.07035
- TP1: 0.07008 (R:R 1:0.7)
- TP2: 0.06992 (R:R 1:1.2)
- TP3: 0.06967 (R:R 1:2.0)
- SL: 0.07064
#Crypto
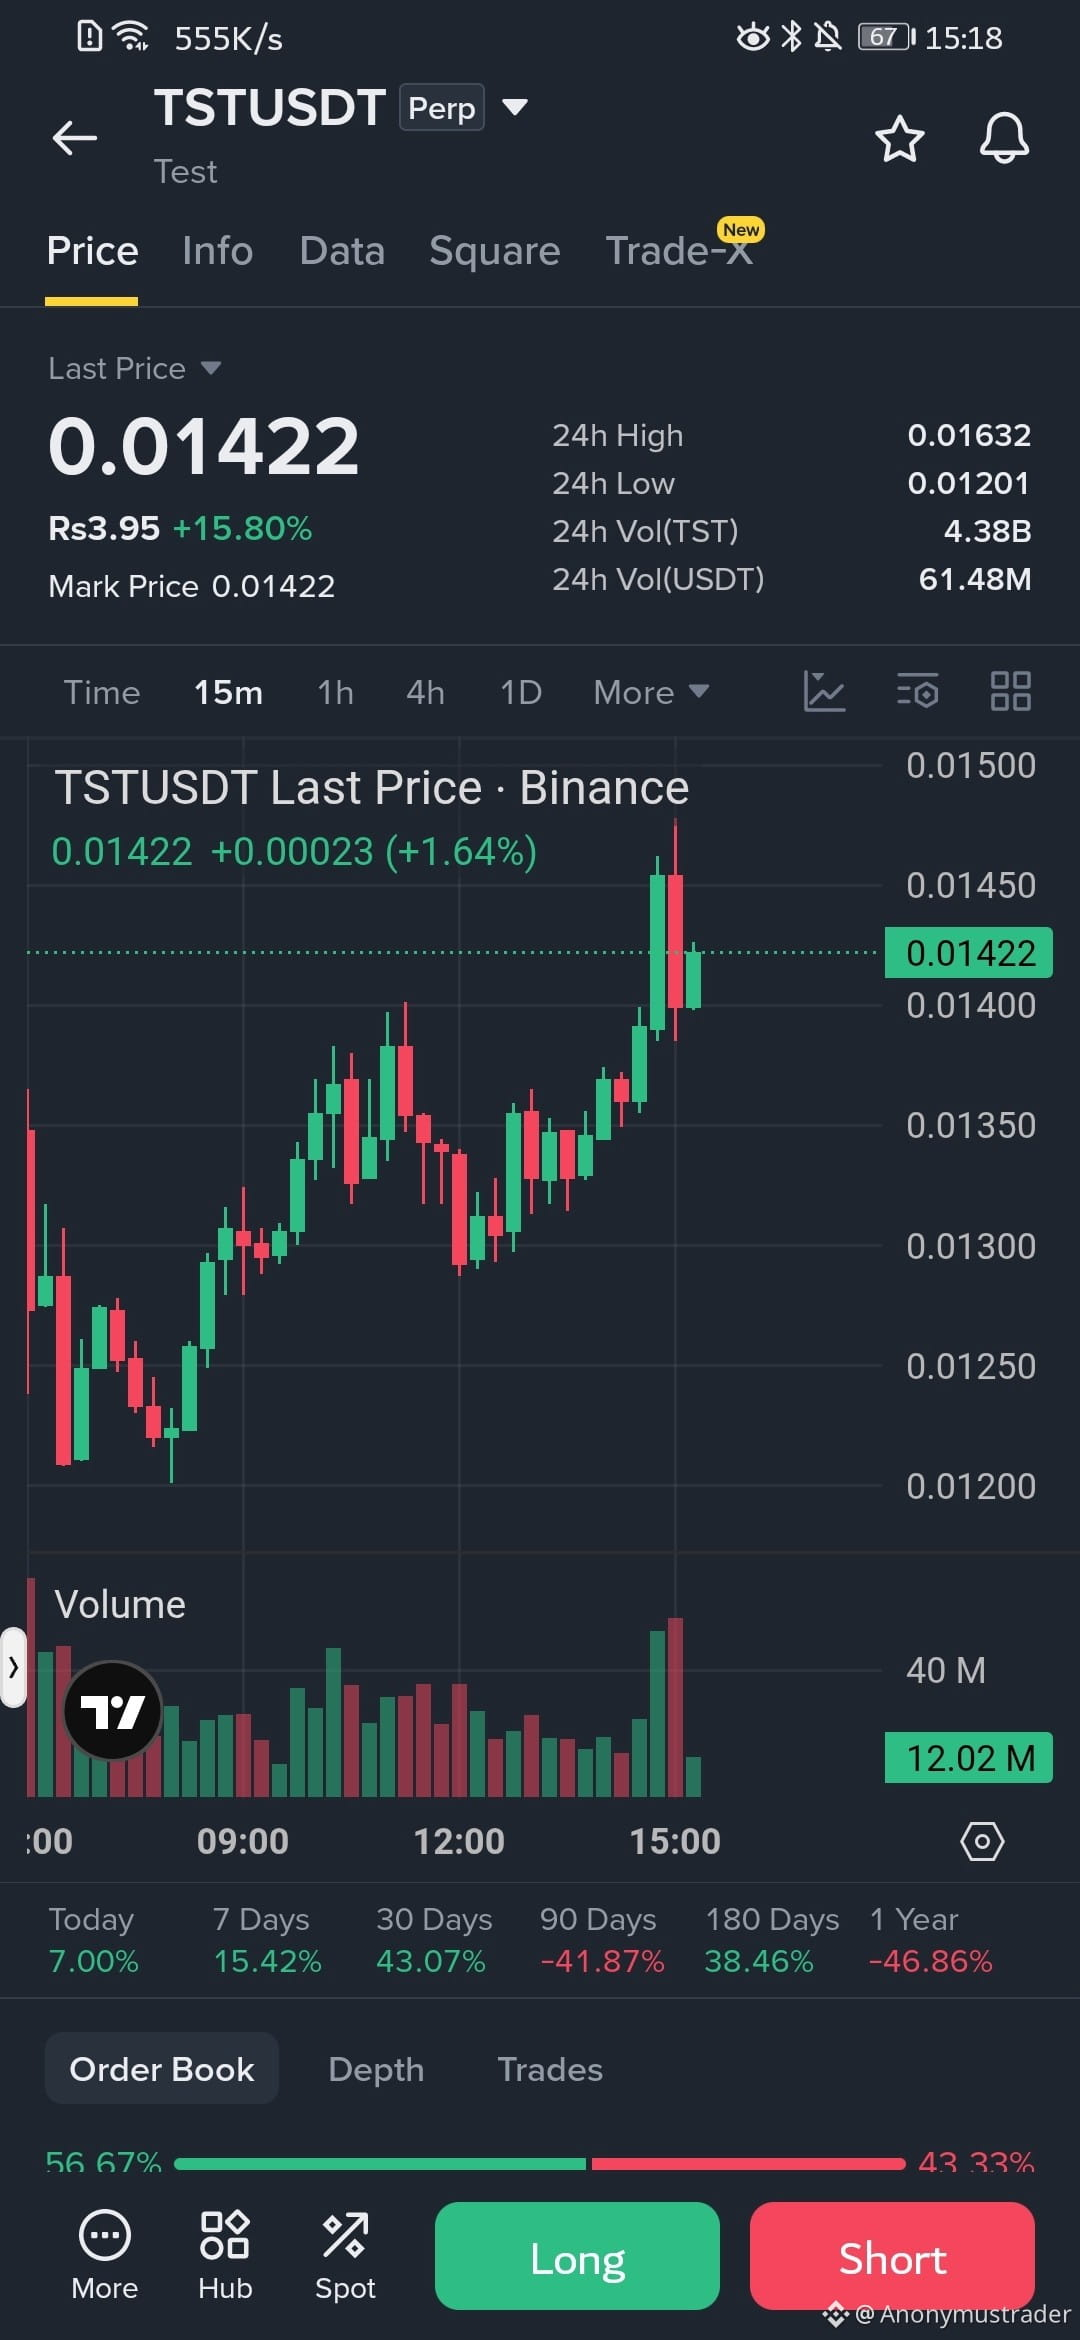
Die Lücke zwischen den Long- und Short-Positionen der Hyperliquid-Whales liegt bei 0,27 Mrd. US-Dollar und zeigt keinen nennenswerten Unterschied.
Allerdings nimmt die Größe der Short-Positionen ab.
Obwohl das Clarity Act verschoben wurde, nehmen die bärischen Wetten tatsächlich ab.
$BTC
Allerdings nimmt die Größe der Short-Positionen ab.
Obwohl das Clarity Act verschoben wurde, nehmen die bärischen Wetten tatsächlich ab.
$BTC
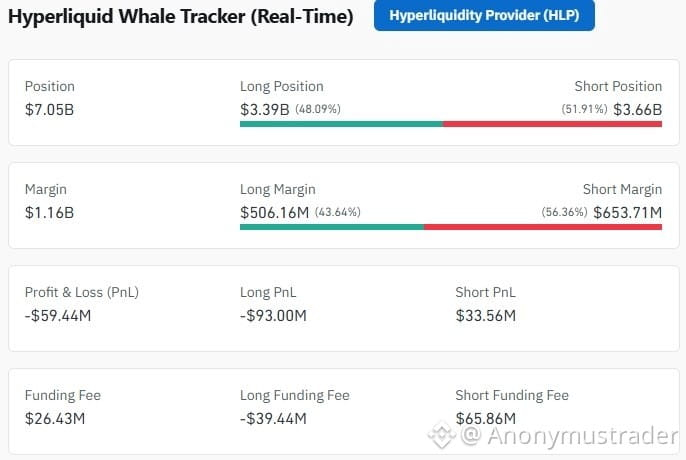
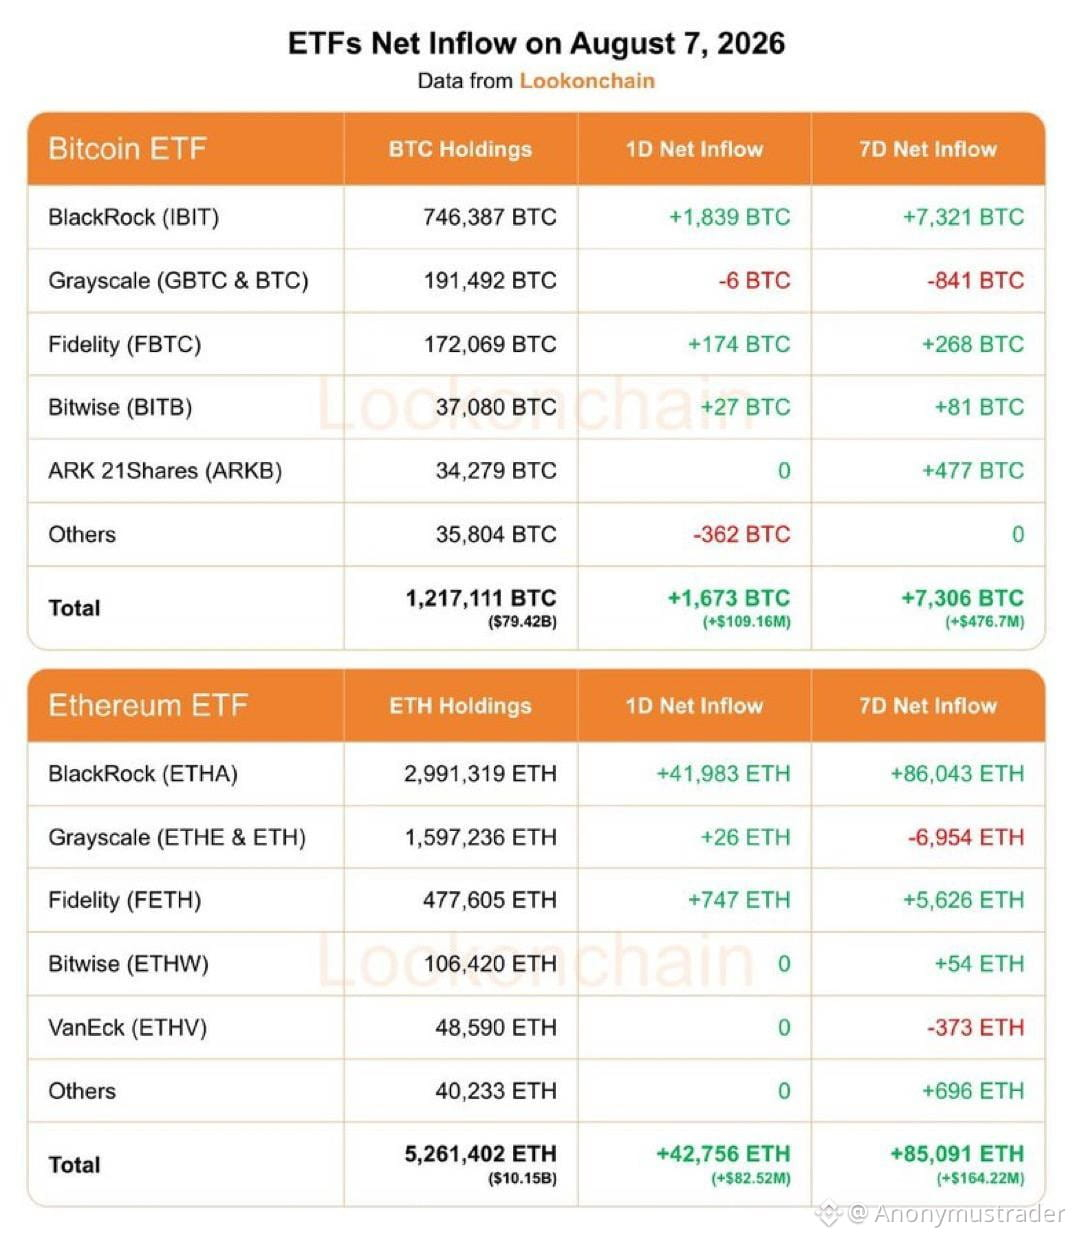

Japan geht mit Klarheit in Bezug auf Krypto schneller voran, als die meisten Menschen es realisieren.
Während in den USA weiterhin Gesetzesvorhaben zur Marktstruktur und SEC-Regeln diskutiert werden, hat Japan gerade eine eigene Abteilung für „Crypto Assets & Stablecoins“ unter der FSA eingerichtet. Sie haben Krypto als Finanzinstrumente neu klassifiziert, den Weg für niedrigere Steuern geebnet (hin zu 20 %) und die Tür für zukünftige ETFs geöffnet.
Klare Regeln + niedrigere Steuern = mehr institutionelles und Retail-Kapital. Japan positioniert sich still und leise als einer der ernsthaftesten Krypto-freundlichen großen Märkte in Asien.
Glaubst du, dass Japan in den nächsten 12 Monaten mehr ernsthaftes Geld anziehen wird als die USA – oder wird die amerikanische Regulierung endlich aufholen?
#BTC #ETH #Crypto #Japan $BTC
Während in den USA weiterhin Gesetzesvorhaben zur Marktstruktur und SEC-Regeln diskutiert werden, hat Japan gerade eine eigene Abteilung für „Crypto Assets & Stablecoins“ unter der FSA eingerichtet. Sie haben Krypto als Finanzinstrumente neu klassifiziert, den Weg für niedrigere Steuern geebnet (hin zu 20 %) und die Tür für zukünftige ETFs geöffnet.
Klare Regeln + niedrigere Steuern = mehr institutionelles und Retail-Kapital. Japan positioniert sich still und leise als einer der ernsthaftesten Krypto-freundlichen großen Märkte in Asien.
Glaubst du, dass Japan in den nächsten 12 Monaten mehr ernsthaftes Geld anziehen wird als die USA – oder wird die amerikanische Regulierung endlich aufholen?
#BTC #ETH #Crypto #Japan $BTC

Drucke 💵 🖨️
$DODOX - KURZ
Handelsplan:
Einstieg: 0.0206929 – 0.0209111
SL: 0.0248343
TP1: 0.0177778
TP2: 0.0157616
TP3: 0.0127374
Warum dieses Setup?
- RSI 15m bei 31.19: Momentum ist erschöpft, nicht überverkauft genug, um einen Bounce zu erzeugen.
- ATR 1h (0.00168) zeigt enge Coils—Ausbrüche hier sind gewalttätig, und die Richtung begünstigt Verkäufer.
- Referenz Einstieg: 0.0208020. TP1 liegt 14% darunter; TP3 ist ein 38%iger Rückgang. Der Range-Trend auf 1D ist die perfekte Falle für späte Longs.
- Warum jetzt? Der Status „Armed“ bedeutet, dass der Trigger aktiv ist—es gilt abzuwarten, dass der Preis die Invalidierung bei 0.0214080 respektiert.
#Crypto #BinanceSquare #MemeCoin
$DODOX - KURZ
Handelsplan:
Einstieg: 0.0206929 – 0.0209111
SL: 0.0248343
TP1: 0.0177778
TP2: 0.0157616
TP3: 0.0127374
Warum dieses Setup?
- RSI 15m bei 31.19: Momentum ist erschöpft, nicht überverkauft genug, um einen Bounce zu erzeugen.
- ATR 1h (0.00168) zeigt enge Coils—Ausbrüche hier sind gewalttätig, und die Richtung begünstigt Verkäufer.
- Referenz Einstieg: 0.0208020. TP1 liegt 14% darunter; TP3 ist ein 38%iger Rückgang. Der Range-Trend auf 1D ist die perfekte Falle für späte Longs.
- Warum jetzt? Der Status „Armed“ bedeutet, dass der Trigger aktiv ist—es gilt abzuwarten, dass der Preis die Invalidierung bei 0.0214080 respektiert.
#Crypto #BinanceSquare #MemeCoin
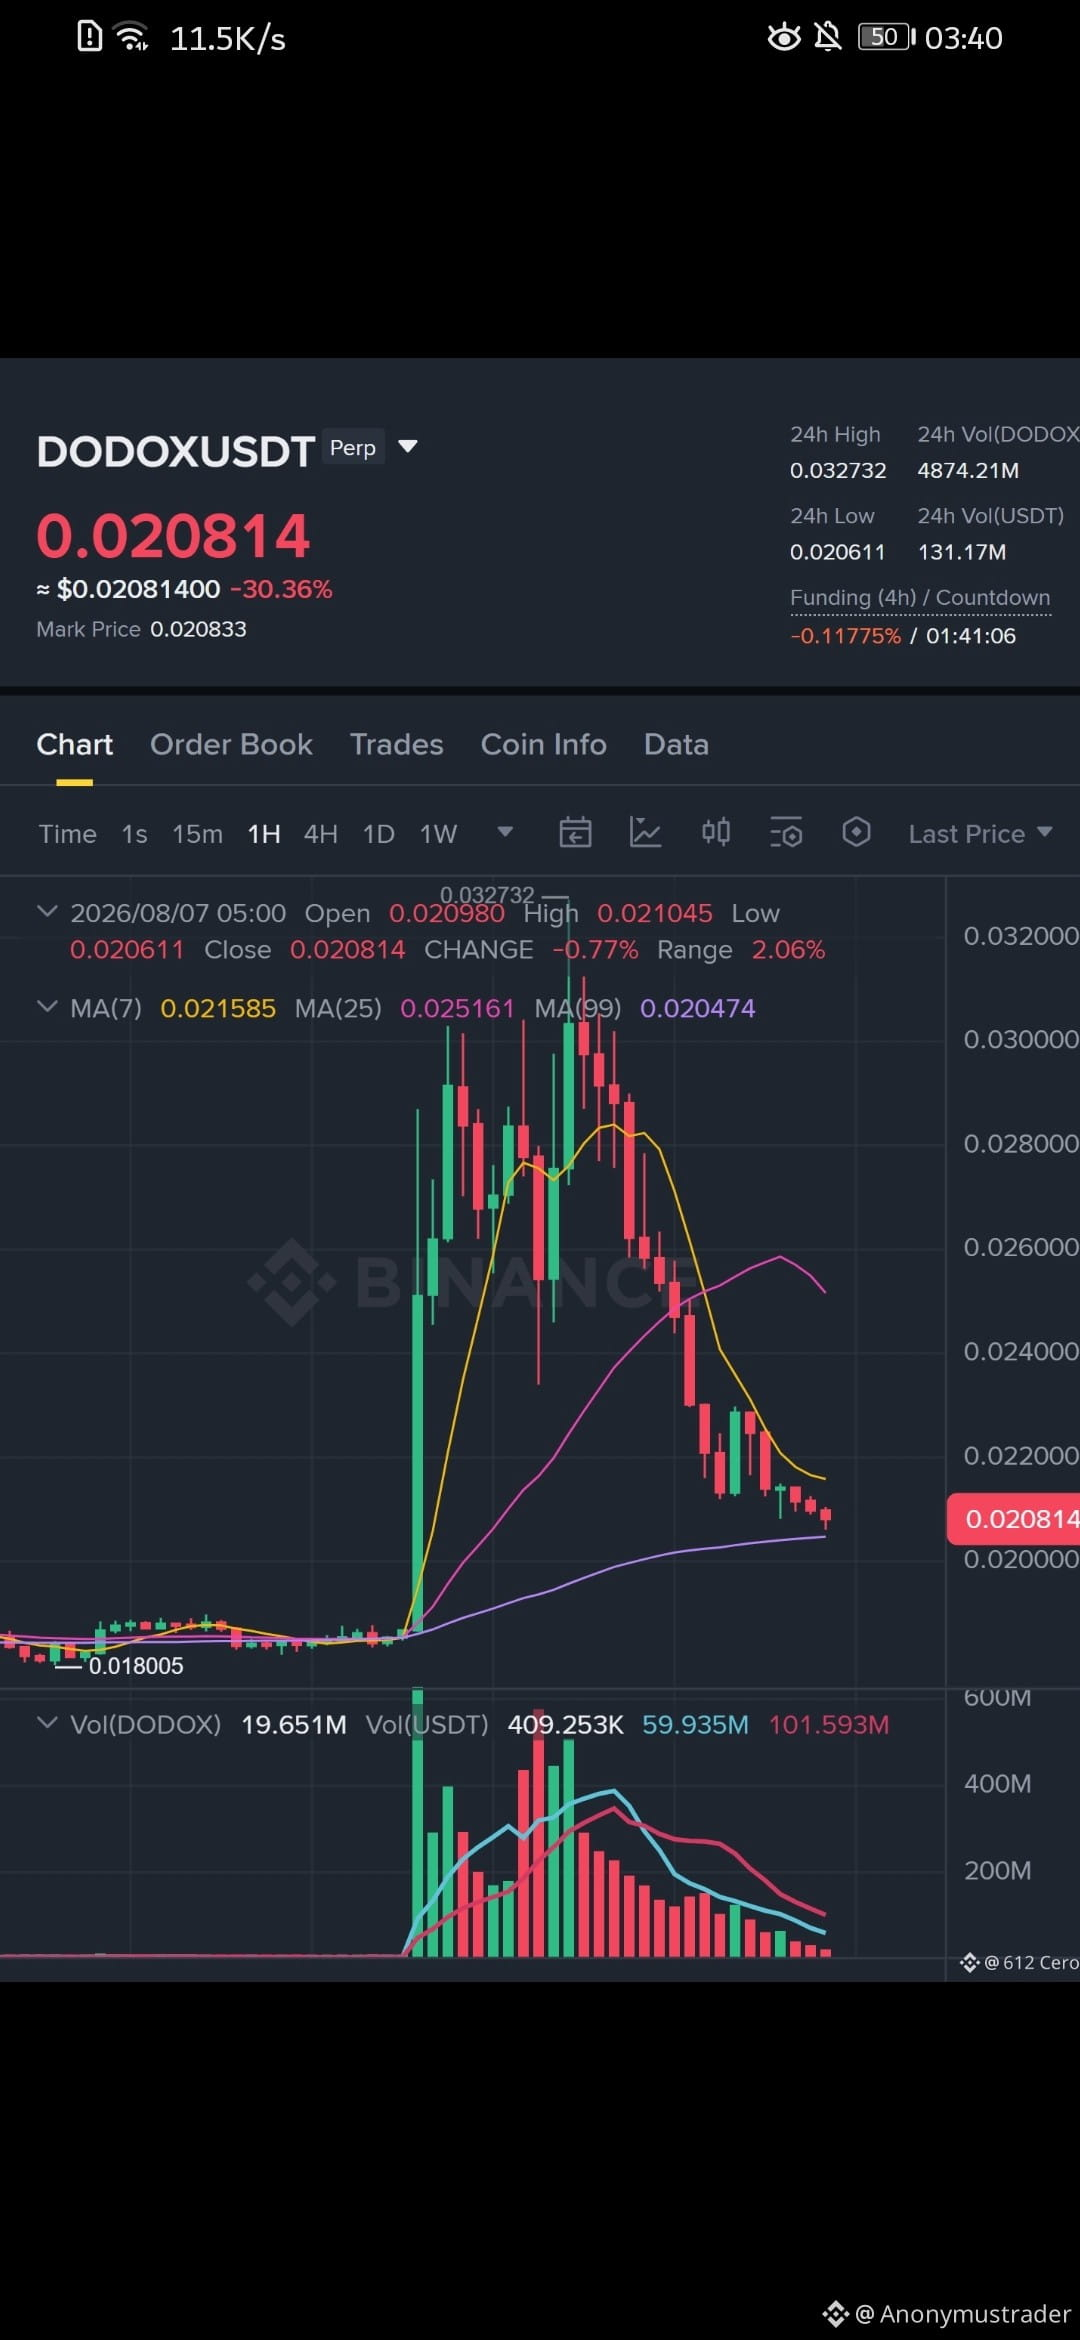
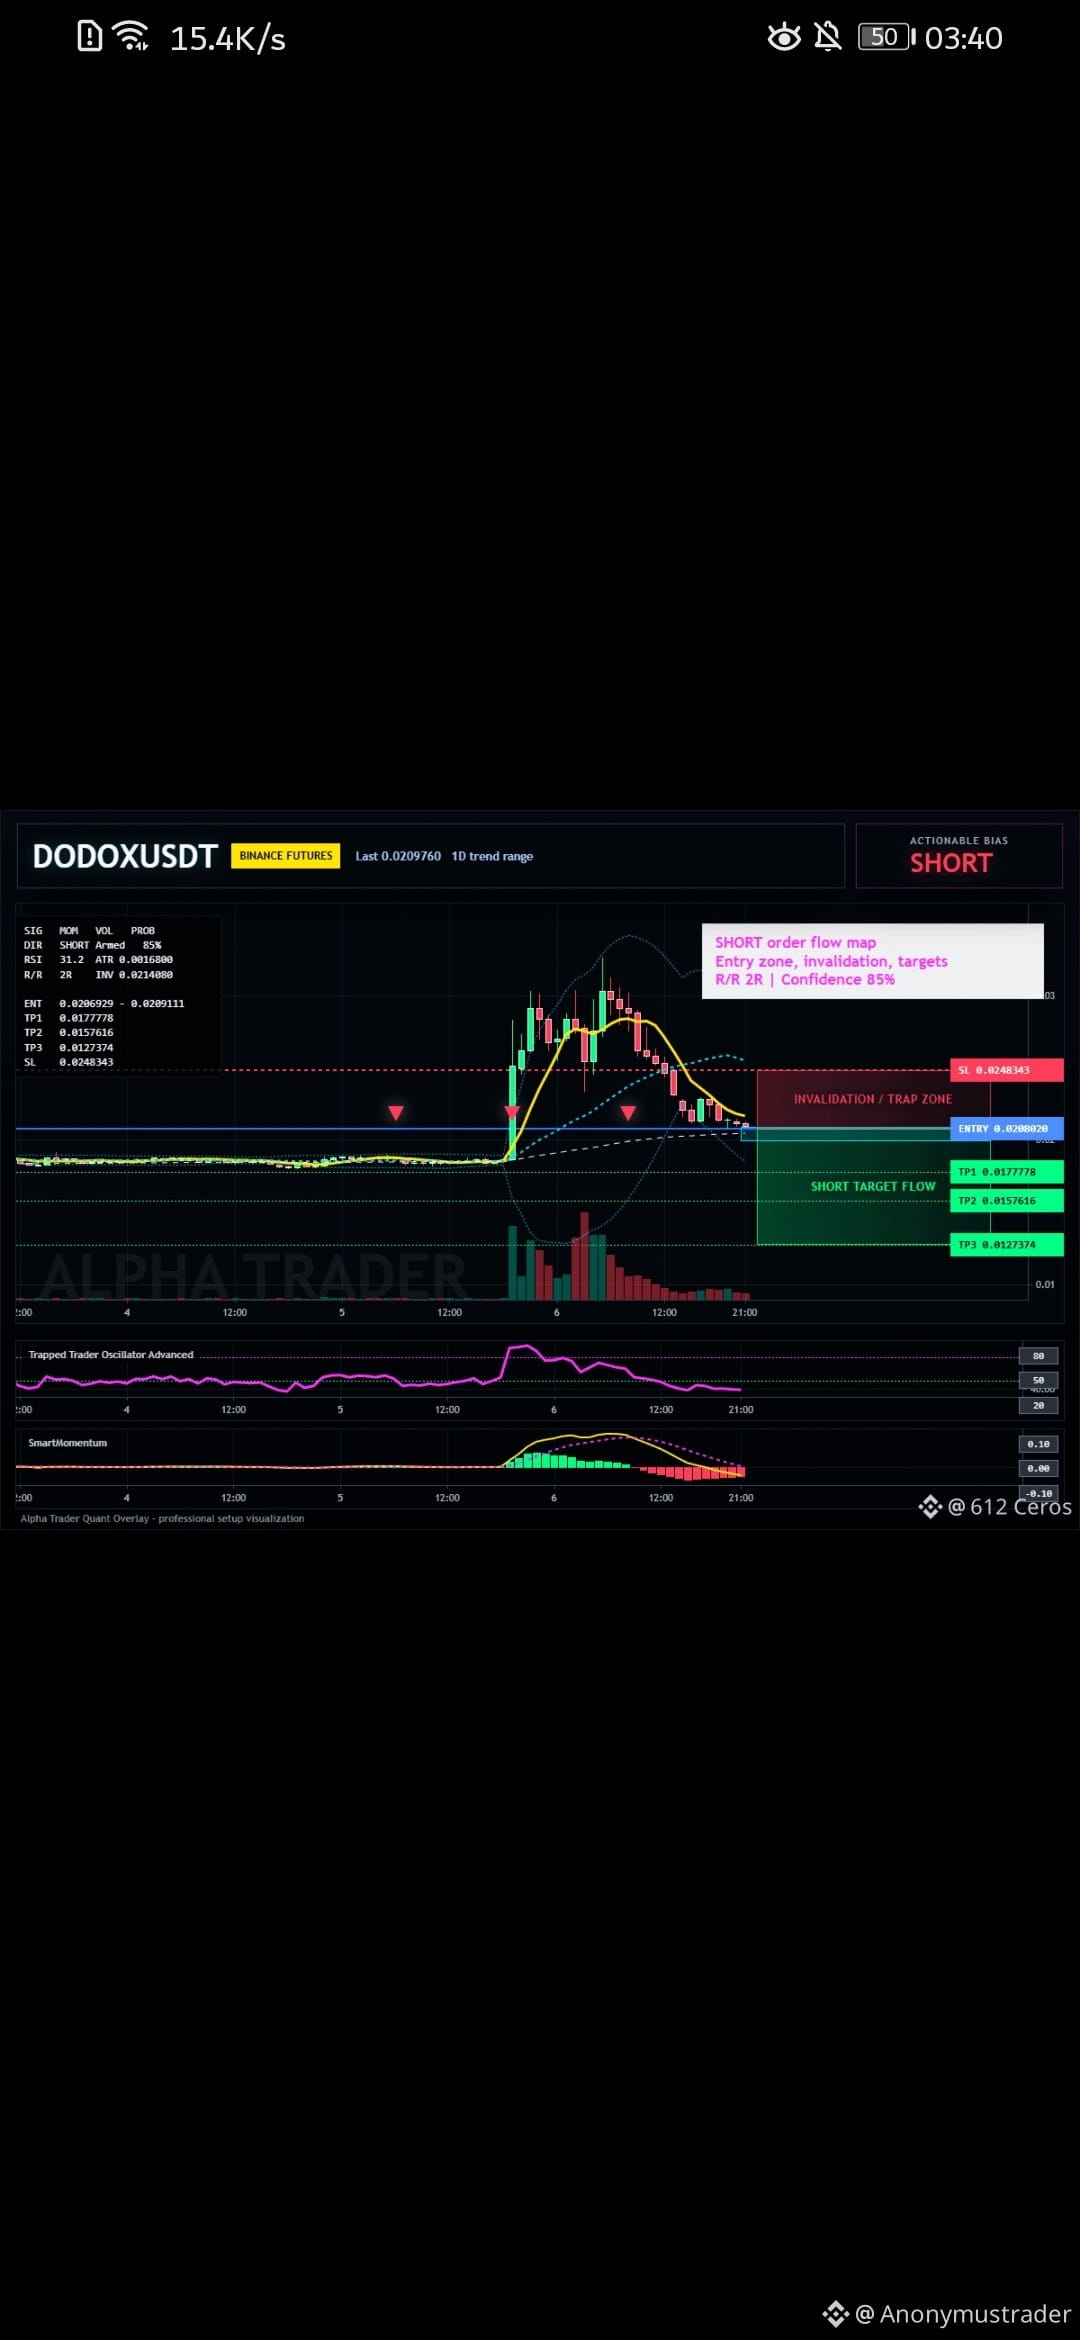
$HFT ist gerade hart aufgewacht.
Nachdem Hashflow seit Wochen nahe den Tiefs geschwankt ist, riss er mit massiver Volumenbildung und täglichen Bewegungen im zweistelligen Bereich nach oben. Der Kurs klettert aus dem Bereich unter 0,01$ in die 0,03$-Region, während die meisten Trader noch woanders beschäftigt waren.
Das ist das klassische Low-Cap-Muster: ruhige Akkumulation → plötzliches Interesse → Volatilität. Das Setup wirkt auf dem kurzfristigen Chart interessant, aber diese Bewegungen können sich genauso schnell wieder umkehren.
Beobachtest du $HFT für eine Fortsetzung, oder denkst du, der Pump ist schon zu weit gelaufen?
#HFT #crypto
Nachdem Hashflow seit Wochen nahe den Tiefs geschwankt ist, riss er mit massiver Volumenbildung und täglichen Bewegungen im zweistelligen Bereich nach oben. Der Kurs klettert aus dem Bereich unter 0,01$ in die 0,03$-Region, während die meisten Trader noch woanders beschäftigt waren.
Das ist das klassische Low-Cap-Muster: ruhige Akkumulation → plötzliches Interesse → Volatilität. Das Setup wirkt auf dem kurzfristigen Chart interessant, aber diese Bewegungen können sich genauso schnell wieder umkehren.
Beobachtest du $HFT für eine Fortsetzung, oder denkst du, der Pump ist schon zu weit gelaufen?
#HFT #crypto
$ETH richtet sich leise ein, während die meisten Blicke noch auf $BTC fixiert sind.
Der Kurs wirkt auf den ersten Blick ruhig, aber die Funding Rates, das Open Interest und die DeFi-Aktivität beginnen sich zu verändern. Jedes Mal, wenn Ethereum so leises Kapital anzieht, folgt der breitere Markt normalerweise — oder dreht sich abrupt.
Die entscheidende Frage lautet nicht, ob ETH sich bewegt.
Sondern: Ob der Einzelhandel es früh bemerkt… oder wieder zu spät kommt.
Bullish auf $ETH diese Woche, oder wartest du noch auf ein klareres Signal?
#ETH #crypto
Der Kurs wirkt auf den ersten Blick ruhig, aber die Funding Rates, das Open Interest und die DeFi-Aktivität beginnen sich zu verändern. Jedes Mal, wenn Ethereum so leises Kapital anzieht, folgt der breitere Markt normalerweise — oder dreht sich abrupt.
Die entscheidende Frage lautet nicht, ob ETH sich bewegt.
Sondern: Ob der Einzelhandel es früh bemerkt… oder wieder zu spät kommt.
Bullish auf $ETH diese Woche, oder wartest du noch auf ein klareres Signal?
#ETH #crypto
$ETH ist das eine Krypto-Asset, das Händler gerade jetzt möglicherweise unterschätzen.
Während die meisten der Menge hinter allem herjagen, was gerade für einen Tag im Trend liegt, bleibt Ethereum im Zentrum des gesamten Marktes: DeFi, Staking, Smart Contracts, Layer-2-Aktivität und Kapitalrotation.
Deshalb ist ETH mehr wert als nur „ein weiterer großer Cap“.
Wenn Ethereum echte Aufmerksamkeit bekommt, breitet sich der Effekt oft auf den gesamten Markt aus:
Der Altcoin-Sentiment beginnt sich zu verschieben
Händler rotieren zurück in Qualität
On-Chain-Aktivität rückt stärker in den Fokus
der gesamte Markt beginnt, die ETH-Kurse genauer zu beobachten
Viele Menschen wollen sofortige 10x-Narrative.
Aber ETH ist immer noch das Asset, das den Ton des gesamten Marktes still und leise verändern kann.
Wenn Momentum, Volumen und die Marktaufmerksamkeit rund um Ethereum weiter wachsen, könnte dies wieder eines der wichtigsten Assets sein, die man im Krypto-Bereich im Blick behalten sollte.
Die Menge liebt es, zu spät zu kommen.
Gute Händler fangen normalerweise schon an, aufmerksam zu werden, bevor das Narrativ offensichtlich wird.
Wird ETH gerade ignoriert – oder beginnt hier die nächste große Bewegung?
Vorgeschlagene Tags:
$ETH #Ethereum #Crypto #Altcoins
Während die meisten der Menge hinter allem herjagen, was gerade für einen Tag im Trend liegt, bleibt Ethereum im Zentrum des gesamten Marktes: DeFi, Staking, Smart Contracts, Layer-2-Aktivität und Kapitalrotation.
Deshalb ist ETH mehr wert als nur „ein weiterer großer Cap“.
Wenn Ethereum echte Aufmerksamkeit bekommt, breitet sich der Effekt oft auf den gesamten Markt aus:
Der Altcoin-Sentiment beginnt sich zu verschieben
Händler rotieren zurück in Qualität
On-Chain-Aktivität rückt stärker in den Fokus
der gesamte Markt beginnt, die ETH-Kurse genauer zu beobachten
Viele Menschen wollen sofortige 10x-Narrative.
Aber ETH ist immer noch das Asset, das den Ton des gesamten Marktes still und leise verändern kann.
Wenn Momentum, Volumen und die Marktaufmerksamkeit rund um Ethereum weiter wachsen, könnte dies wieder eines der wichtigsten Assets sein, die man im Krypto-Bereich im Blick behalten sollte.
Die Menge liebt es, zu spät zu kommen.
Gute Händler fangen normalerweise schon an, aufmerksam zu werden, bevor das Narrativ offensichtlich wird.
Wird ETH gerade ignoriert – oder beginnt hier die nächste große Bewegung?
Vorgeschlagene Tags:
$ETH #Ethereum #Crypto #Altcoins
$BTC $SOL $ETH
🚨 Markt-Update
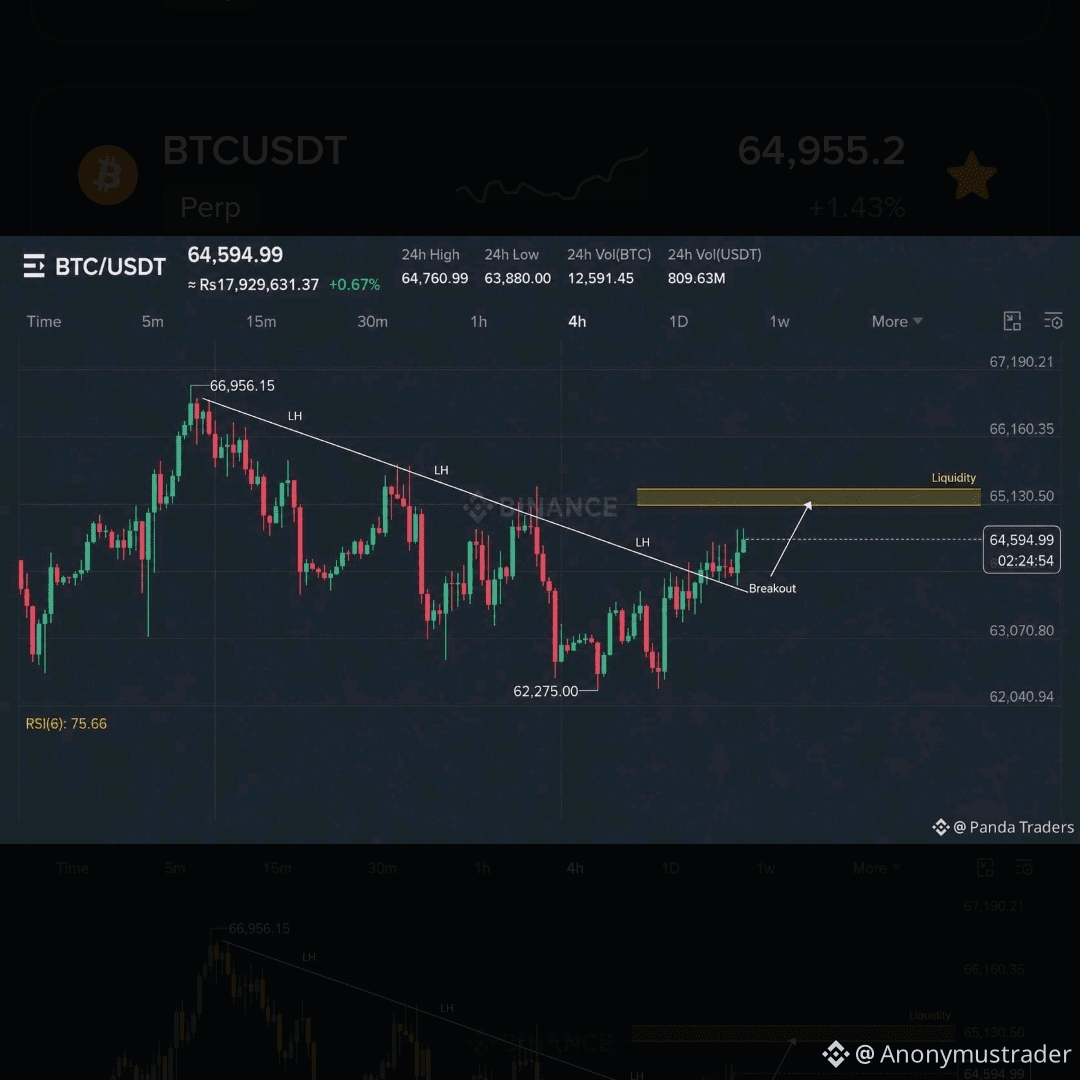
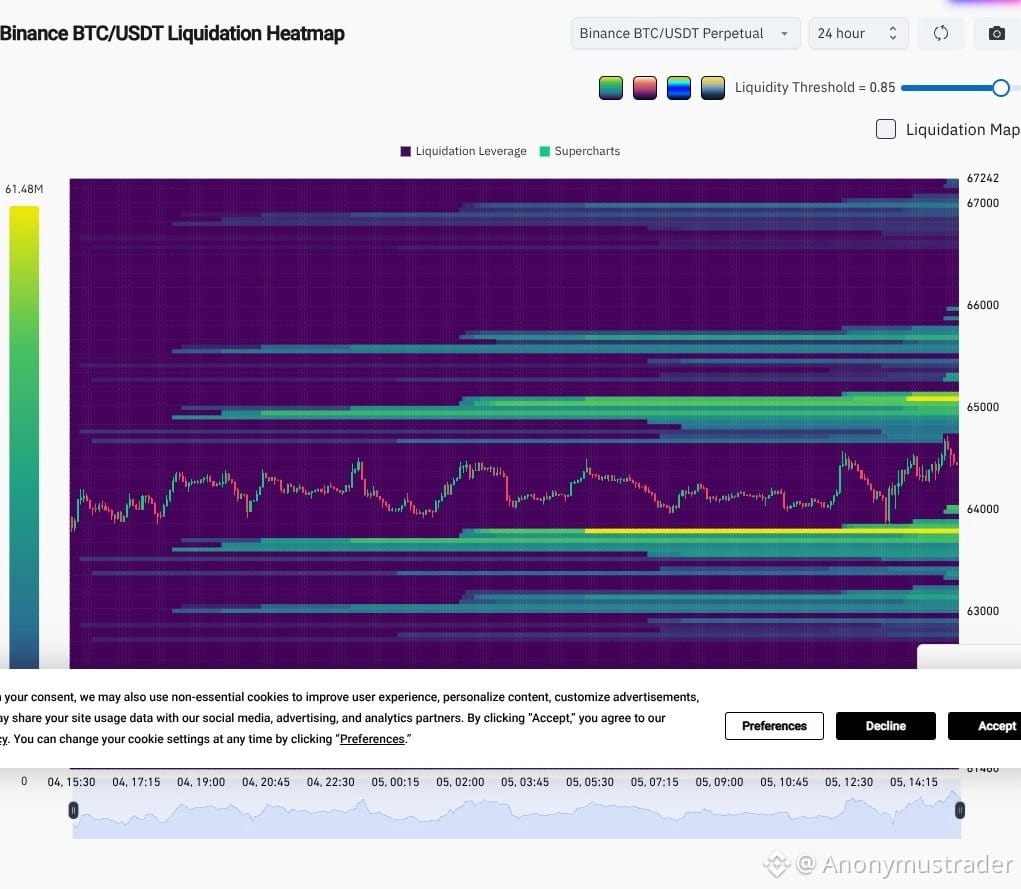
Wir sind in BTC-Shorts bei $64.000–$64.600 eingestiegen (plus ETH/SOL-Shorts). Der Kurs ist jetzt nahe am Einstieg — gehe mit dem Risiko sorgfältig um.
Das Aufwärts-Liquiditätsniveau bleibt stark bei $65.000–$65.250 und $65.700–$66.000. BTC könnte diese Levels abräumen, bevor es zu einer echten bärischen Bewegung kommt.
Hinweis:
Halte den Short nicht blind fest
Bewege dich in Richtung Break-even oder schließe, wenn du das Risiko senken willst
Besser ist es, auf einen Liquiditäts-Sweep + klare Ablehnung zu warten, bevor du erneut Shorts eröffnest
Frische Shorts hier haben ein schlechtes Chance-Risiko-Verhältnis.
Wenn BTC stattdessen fällt, konzentriere dich auf Spot-Käufe aus Nachfrage: $64.200 dann $63.880–$63.400.
Shorts sind leicht riskant, bis die Struktur bestätigt.
#ADPJulyPrivatePayrollsMissedExpectations
🚨 Markt-Update
Wir sind in BTC-Shorts bei $64.000–$64.600 eingestiegen (plus ETH/SOL-Shorts). Der Kurs ist jetzt nahe am Einstieg — gehe mit dem Risiko sorgfältig um.
Das Aufwärts-Liquiditätsniveau bleibt stark bei $65.000–$65.250 und $65.700–$66.000. BTC könnte diese Levels abräumen, bevor es zu einer echten bärischen Bewegung kommt.
Hinweis:
Halte den Short nicht blind fest
Bewege dich in Richtung Break-even oder schließe, wenn du das Risiko senken willst
Besser ist es, auf einen Liquiditäts-Sweep + klare Ablehnung zu warten, bevor du erneut Shorts eröffnest
Frische Shorts hier haben ein schlechtes Chance-Risiko-Verhältnis.
Wenn BTC stattdessen fällt, konzentriere dich auf Spot-Käufe aus Nachfrage: $64.200 dann $63.880–$63.400.
Shorts sind leicht riskant, bis die Struktur bestätigt.
#ADPJulyPrivatePayrollsMissedExpectations
ADP hat gerade einen sanften Treffer gelandet.
Die privaten US-Lohnlisten im Juli lagen bei +44.000.
Wall Street hatte mit ~70-75k gerechnet.
Juni wurde auf 95k nach unten korrigiert.
Deutlicher Ausreißer.
Fast alle Neueinstellungen kamen aus dem Dienstleistungssektor (insbesondere Bildung & Gesundheit), während Jobs in der Güterproduktion tatsächlich zurückgingen.
Das Gehalt für Job-Wechsler stieg auf +7% — das stärkste seit fast einem Jahr — während Job-Bleiber bei +4,4% blieben.
Der Arbeitsmarkt kühlt ab. Nicht im Sturzflug, aber eindeutig mit nachlassendem Tempo.
Das sind die Daten, die die Zinssenkungs-Hoffnungen bis in den offiziellen Jobs-Report am Freitag am Leben halten.
Märkte mögen normalerweise schwache ADP-Daten…
Wir sehen, wie sie das hier verdauen. #ADPJulyPrivatePayrollsMissedExpectations #viral
Die privaten US-Lohnlisten im Juli lagen bei +44.000.
Wall Street hatte mit ~70-75k gerechnet.
Juni wurde auf 95k nach unten korrigiert.
Deutlicher Ausreißer.
Fast alle Neueinstellungen kamen aus dem Dienstleistungssektor (insbesondere Bildung & Gesundheit), während Jobs in der Güterproduktion tatsächlich zurückgingen.
Das Gehalt für Job-Wechsler stieg auf +7% — das stärkste seit fast einem Jahr — während Job-Bleiber bei +4,4% blieben.
Der Arbeitsmarkt kühlt ab. Nicht im Sturzflug, aber eindeutig mit nachlassendem Tempo.
Das sind die Daten, die die Zinssenkungs-Hoffnungen bis in den offiziellen Jobs-Report am Freitag am Leben halten.
Märkte mögen normalerweise schwache ADP-Daten…
Wir sehen, wie sie das hier verdauen. #ADPJulyPrivatePayrollsMissedExpectations #viral
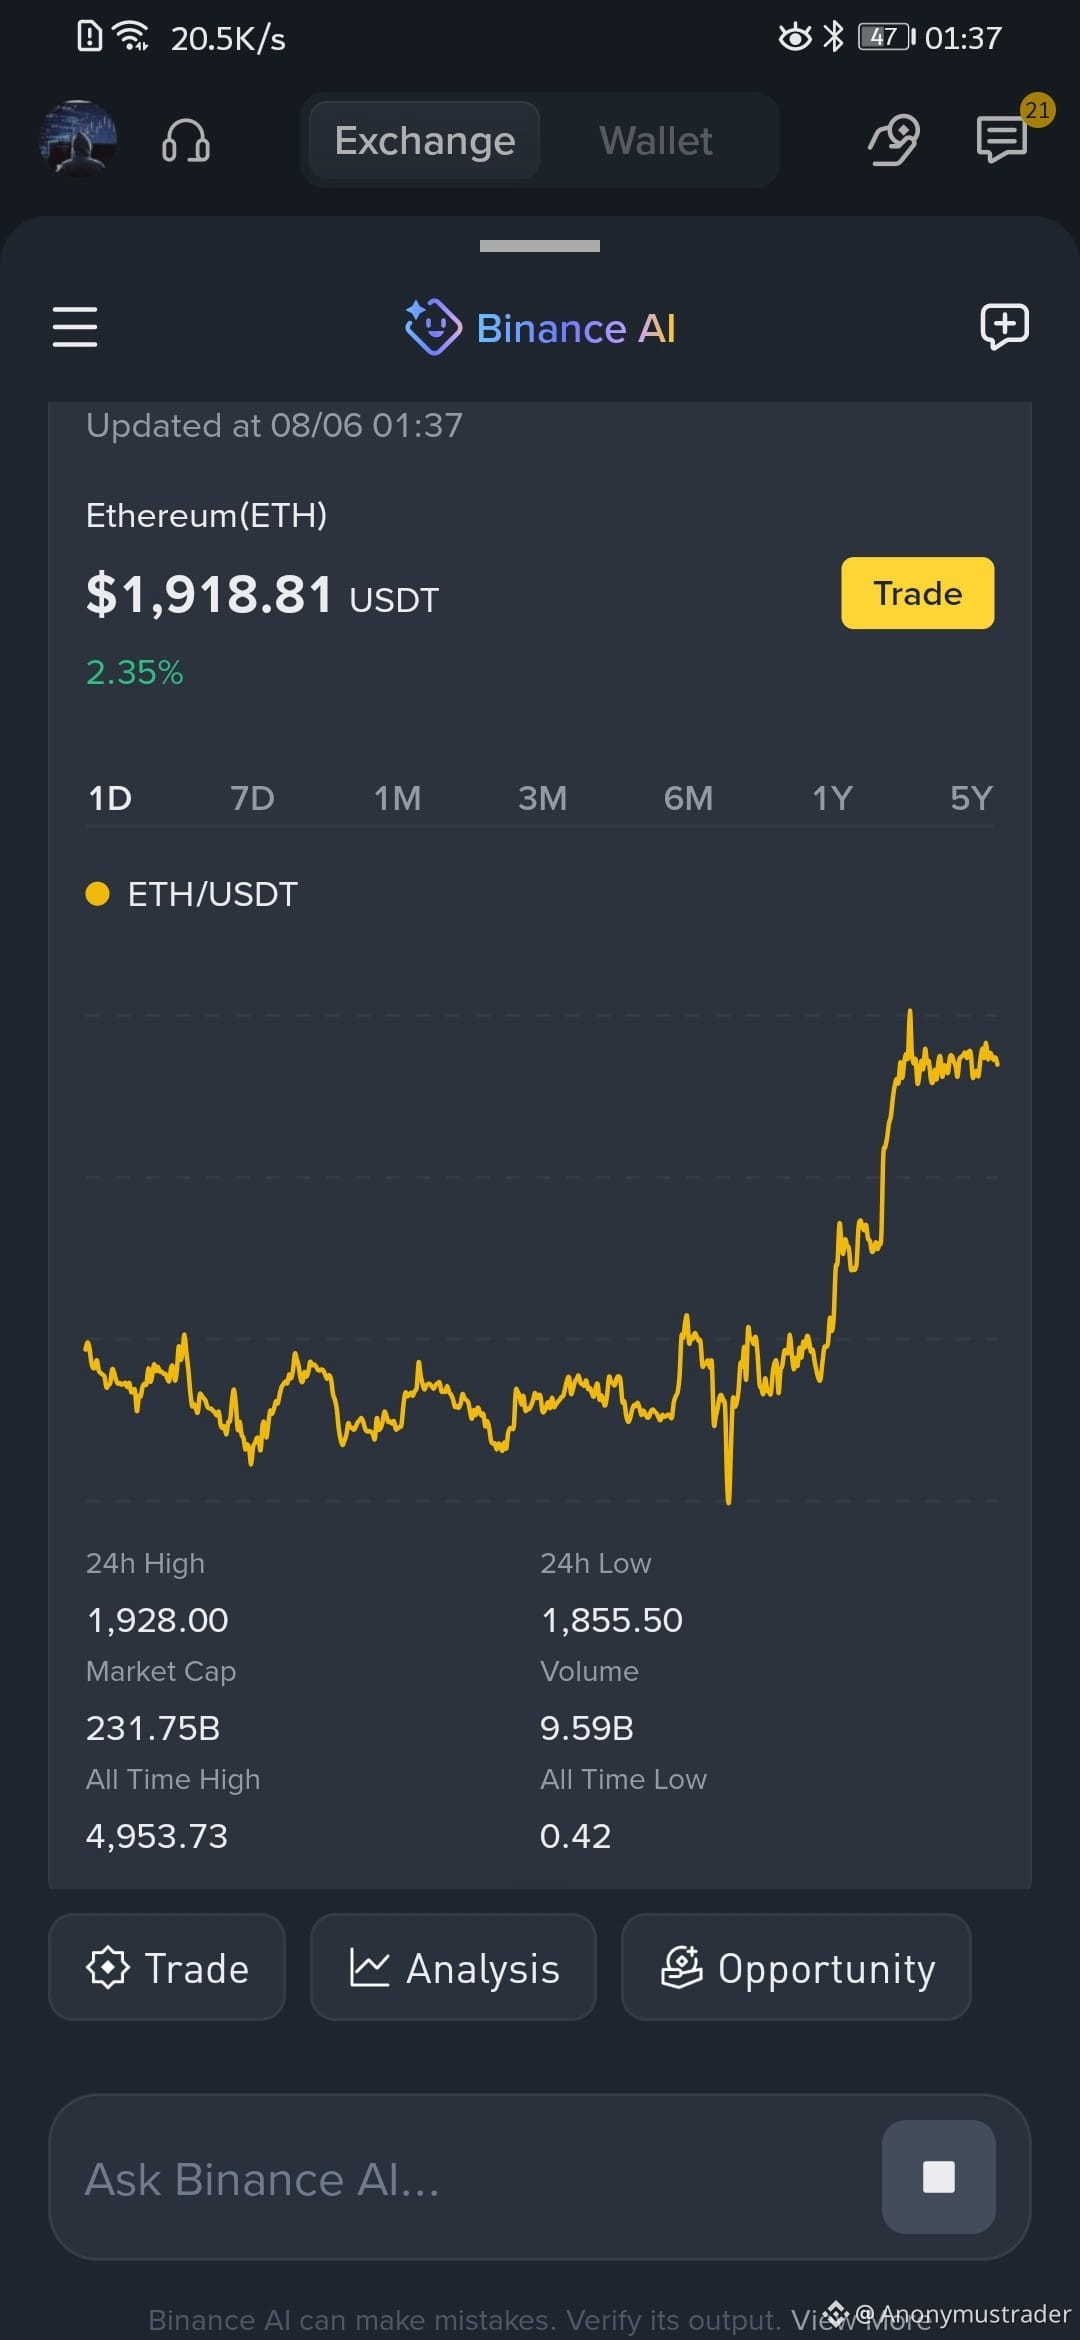
$BTC ist derzeit $64.200
BTCUSDT Perp ≈ 64.500 +0,5%
**$ETH ist derzeit $1.880**
ETHUSDT Perp ≈ 1.915 +1,8%
Wenn $BTC eine Zyklus-Tiefstmarke bei $50k findet, wäre das ein ~22% Rückgang von dem, wo es heute ist.
Meiner Meinung nach wäre $50k tatsächlich recht bullish für ein Bärenmarkt-Tief, weil es nur ein ~60% Rückgang von den Hochs wäre. Das wäre eine großartige Performance für einen Bärenmarkt.
$ETH, als Beta zu BTC, würde wahrscheinlich mehr fallen als BTC, also würde ich annehmen, dass es um 30% oder mehr fällt. Das würde es näher an $1.300 oder niedriger bringen.
ETH drängt immer noch in den Widerstand hinein, daher wirken niedrigere Kurse weiterhin wahrscheinlich.
Nur ein bisschen überschlägige Rechnung.
BTCUSDT Perp ≈ 64.500 +0,5%
**$ETH ist derzeit $1.880**
ETHUSDT Perp ≈ 1.915 +1,8%
Wenn $BTC eine Zyklus-Tiefstmarke bei $50k findet, wäre das ein ~22% Rückgang von dem, wo es heute ist.
Meiner Meinung nach wäre $50k tatsächlich recht bullish für ein Bärenmarkt-Tief, weil es nur ein ~60% Rückgang von den Hochs wäre. Das wäre eine großartige Performance für einen Bärenmarkt.
$ETH, als Beta zu BTC, würde wahrscheinlich mehr fallen als BTC, also würde ich annehmen, dass es um 30% oder mehr fällt. Das würde es näher an $1.300 oder niedriger bringen.
ETH drängt immer noch in den Widerstand hinein, daher wirken niedrigere Kurse weiterhin wahrscheinlich.
Nur ein bisschen überschlägige Rechnung.
FBI-Agent wird zum Krypto-Robin-Hood… und stellt sich dann selbst
Patrick Yaroh, ein echter FBI-Counterintelligence-Agent, stahl still und leise etwa 1 Million US-Dollar in Krypto von feindlichen, mit einem Staat verknüpften Wallets.
Seine Methode? Er fand deren Seed-Phrases und entleerte die Wallets selbst – nicht einmal, sondern 10–12 Mal.
Warum? Frust. Er hatte keine Lust mehr, zuzusehen, wie das FBI diese Konten unangetastet ließ.
Er transferierte die Gelder zu Kraken und schickte dann 1,02 Mio. US-Dollar in das DeFi-Protokoll Suilend (über Slush)… weil er das Wassertröpfchen-Logo mochte.
Am 28. Juli meldete er sich bei einem ehemaligen Kollegen aus dem Justizministerium. Am nächsten Tag stellte er sich.
Die Ermittler stellten 925.426 US-Dollar der Krypto wieder sicher.
Ein FBI-Agent, der entschied, das System sei zu langsam… also wurde er selbst zum System.
Die verrückteste „Ich hab’s selbst gemacht“-Beichte des Jahres.
🤯 #Crypto #FBI #story
Patrick Yaroh, ein echter FBI-Counterintelligence-Agent, stahl still und leise etwa 1 Million US-Dollar in Krypto von feindlichen, mit einem Staat verknüpften Wallets.
Seine Methode? Er fand deren Seed-Phrases und entleerte die Wallets selbst – nicht einmal, sondern 10–12 Mal.
Warum? Frust. Er hatte keine Lust mehr, zuzusehen, wie das FBI diese Konten unangetastet ließ.
Er transferierte die Gelder zu Kraken und schickte dann 1,02 Mio. US-Dollar in das DeFi-Protokoll Suilend (über Slush)… weil er das Wassertröpfchen-Logo mochte.
Am 28. Juli meldete er sich bei einem ehemaligen Kollegen aus dem Justizministerium. Am nächsten Tag stellte er sich.
Die Ermittler stellten 925.426 US-Dollar der Krypto wieder sicher.
Ein FBI-Agent, der entschied, das System sei zu langsam… also wurde er selbst zum System.
Die verrückteste „Ich hab’s selbst gemacht“-Beichte des Jahres.
🤯 #Crypto #FBI #story

🔥 $HEI /USDT steht gerade total unter Dampf!
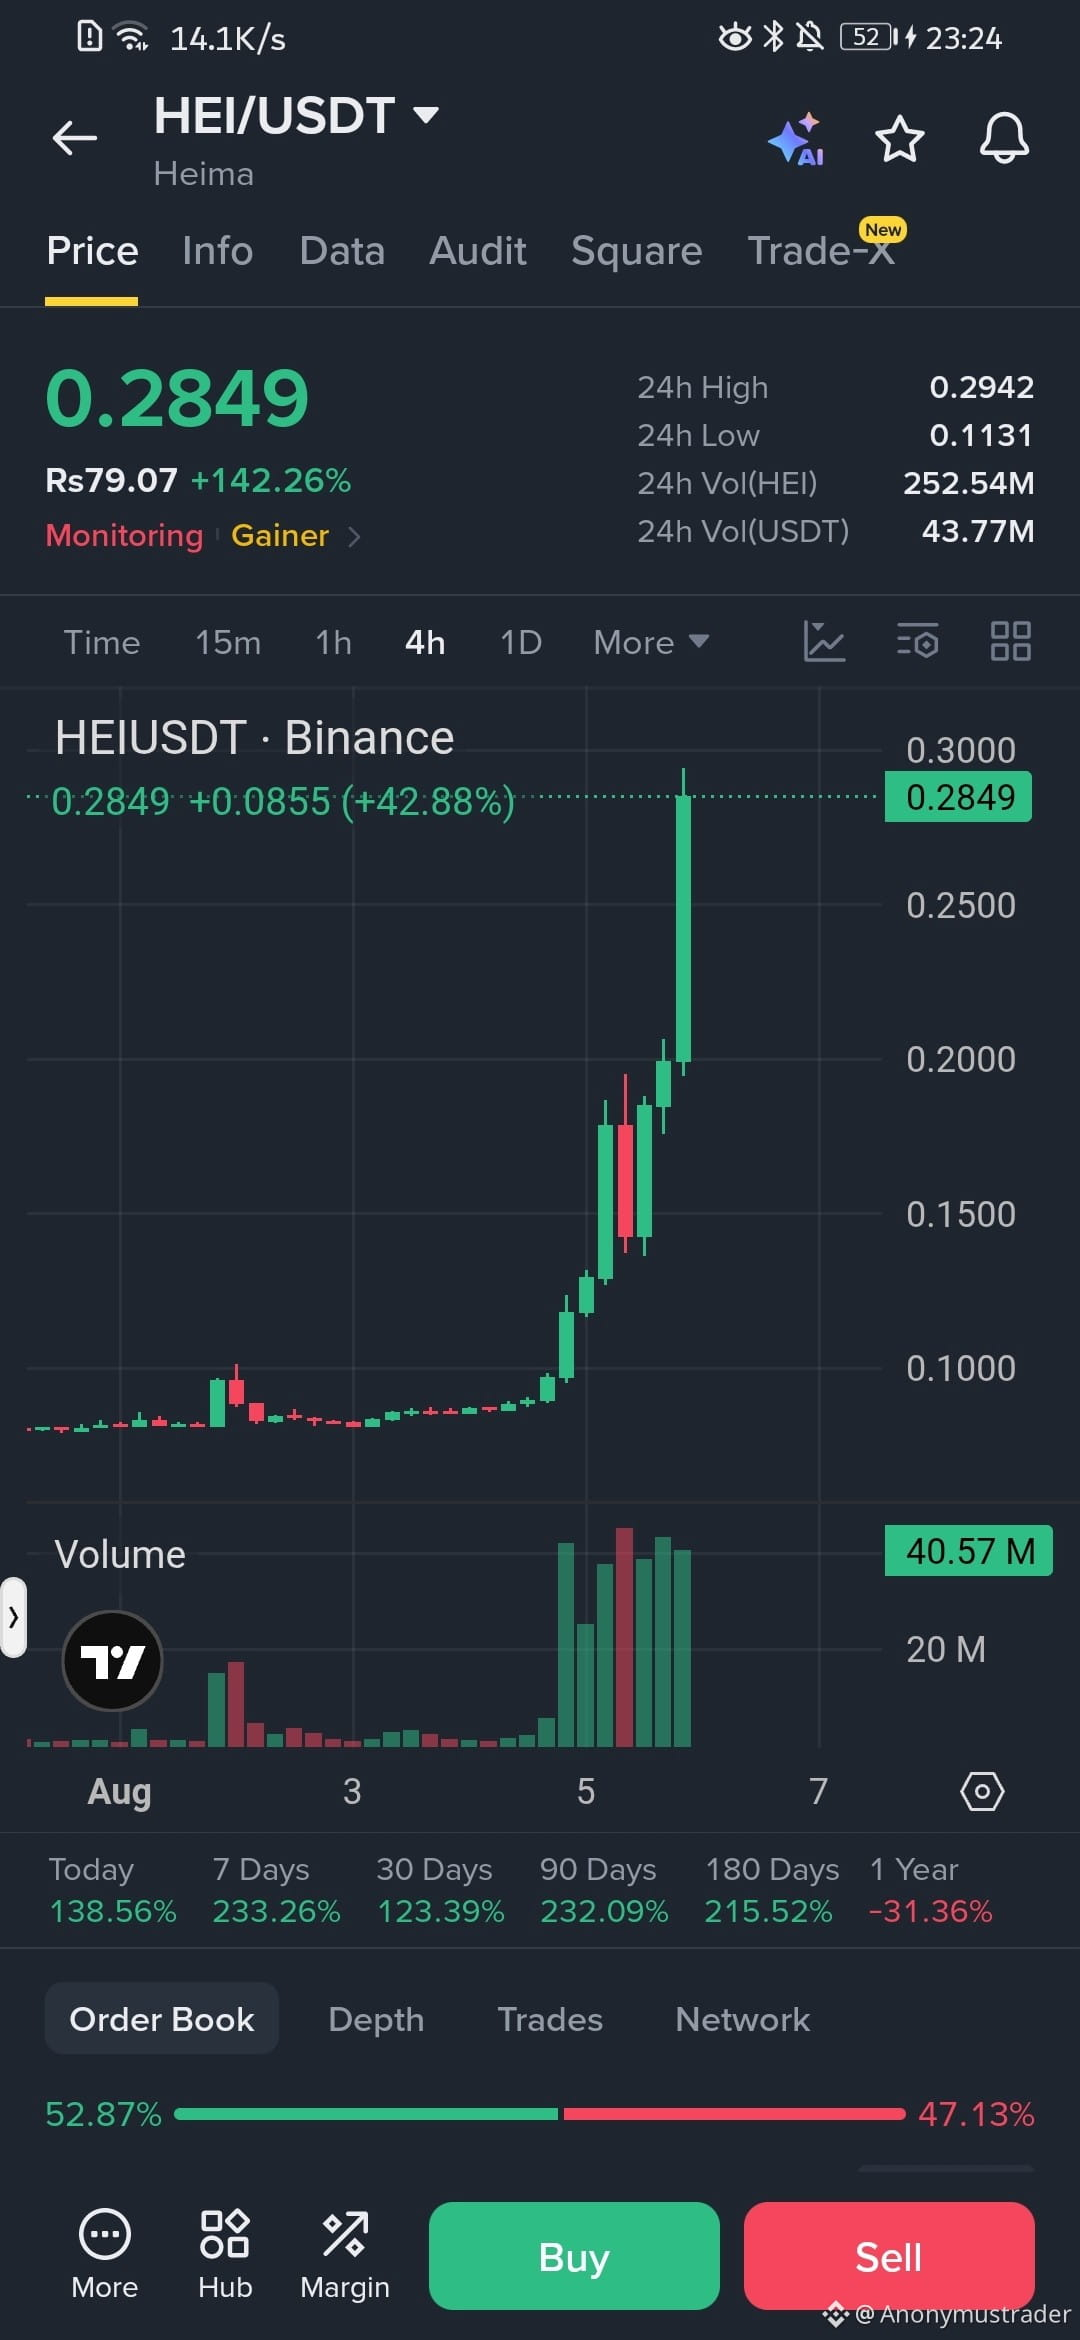
Heima hat gerade von ~0,11 auf 0,2849 abgerissen – in wenigen Stunden: +142% am Tag und es geht noch weiter.
24h-Statistiken:
Hoch: 0,2942
Tief: 0,1131
Volumen: 252 Mio. HEI / 43,7 Mio. USDT
Diese 4H-Kerze ist pure Aggression. Volumenexplosion + starke grüne Kerzen = klares Momentum.
Wer hält noch? Wer hat den frühen Move erwischt?
Lasst uns eure Meinungen hören – früher Einstieg, FOMO oder abwarten auf einen Rücksetzer?
#HEI #Heima a #BinanceSquareTalks #CryptoGains
Heima hat gerade von ~0,11 auf 0,2849 abgerissen – in wenigen Stunden: +142% am Tag und es geht noch weiter.
24h-Statistiken:
Hoch: 0,2942
Tief: 0,1131
Volumen: 252 Mio. HEI / 43,7 Mio. USDT
Diese 4H-Kerze ist pure Aggression. Volumenexplosion + starke grüne Kerzen = klares Momentum.
Wer hält noch? Wer hat den frühen Move erwischt?
Lasst uns eure Meinungen hören – früher Einstieg, FOMO oder abwarten auf einen Rücksetzer?
#HEI #Heima a #BinanceSquareTalks #CryptoGains
🔥 $BANK ERHOLUNG STARK 🔥
Schließlich hat sich $BANK nach dem letzten Dump fast vollständig erholt, und der Momentum sieht gerade ernsthaft bullisch aus.
Wenn es über 0,28 schließt, mache ich mir nicht mal im Ansatz Gedanken — ich eröffne eine Long-Position im Wert von 300.000 USD mit geschlossenen Augen auf BANKUSDT Perpetual.
Denn wenn dieses Momentum hält und $BANK den Ausbruch richtig bestätigt, glaube ich wirklich, dass der nächste große Schritt es in Richtung 0,50 (und darüber hinaus) treiben könnte.
Das ist genau das Setup, auf das ich gewartet habe. High-Conviction-Trade.
DYOR — Krypto bewegt sich schnell, manage dein Risiko! 🚀
Schließlich hat sich $BANK nach dem letzten Dump fast vollständig erholt, und der Momentum sieht gerade ernsthaft bullisch aus.
Wenn es über 0,28 schließt, mache ich mir nicht mal im Ansatz Gedanken — ich eröffne eine Long-Position im Wert von 300.000 USD mit geschlossenen Augen auf BANKUSDT Perpetual.
Denn wenn dieses Momentum hält und $BANK den Ausbruch richtig bestätigt, glaube ich wirklich, dass der nächste große Schritt es in Richtung 0,50 (und darüber hinaus) treiben könnte.
Das ist genau das Setup, auf das ich gewartet habe. High-Conviction-Trade.
DYOR — Krypto bewegt sich schnell, manage dein Risiko! 🚀
Anmelden und weiter Inhalte entdecken