

AR _Trader
50.8k Beiträge

AR _Trader
Melden
Nutzer blockieren
Trade eröffnen
1.4 Jahre
30 Following
14.0K+ Follower
80.6K+ Like gegeben
Beiträge
Portfolio
Alle
Zitierungen
Live
PINNED
·
--
Bullisch
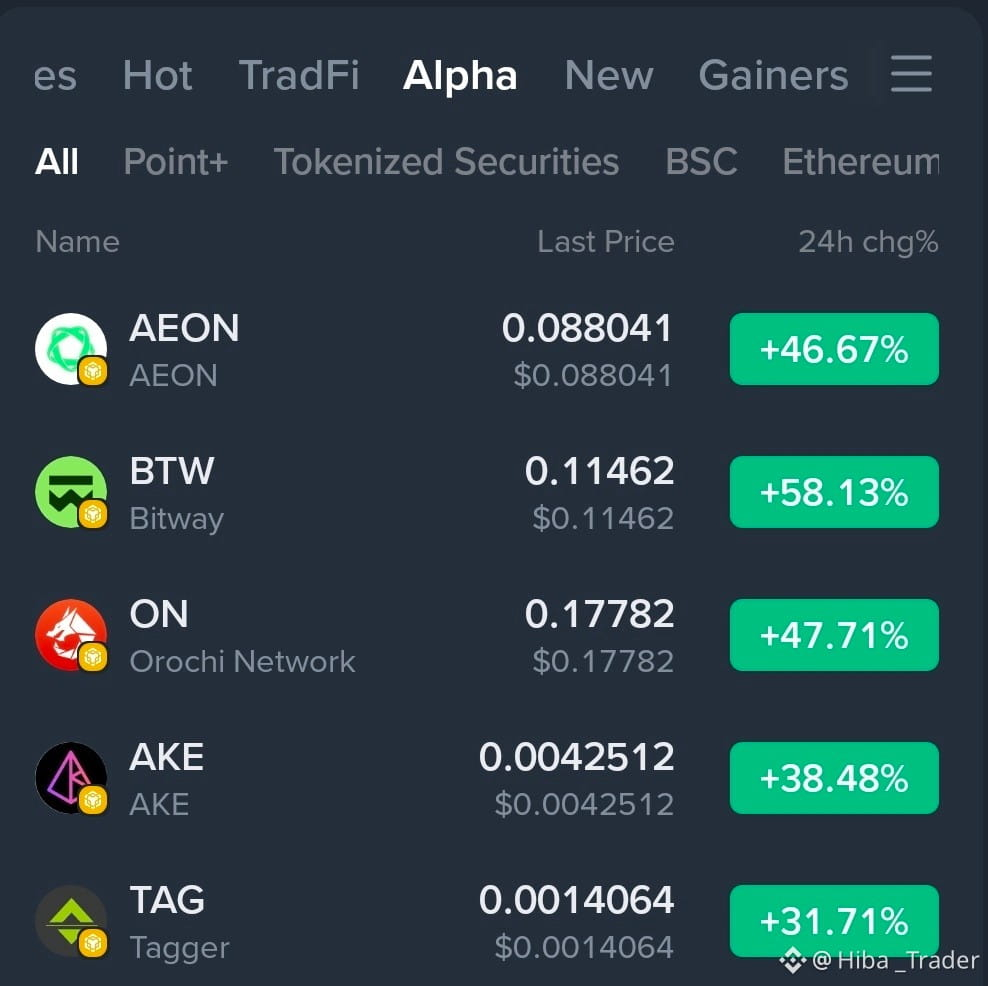
🔥 TOP GEWINNER DES TAGES 🔥
🥇 $BTW — +58,13% 🚀🚀🚀🚀🚀
🥈 #ONDO:
Orochi Network (ON) — +47,71% 🚀🚀🚀🚀⭐
🥉 $AEON — +46,67% 🚀🚀🚀🚀
⭐ $AKE — +38,48% 🚀🚀🚀
📈 #TAG — Beobachtungsliste 👀
Marktstimmung: 🟢 Aufwärtsgerichtet
Momentum-Bewertung: ⭐⭐⭐⭐⭐ (5/5)
Dieses Format wirkt viel auffälliger und ansprechender für Telegram, X oder andere Krypto-Communities.
{future}(BTWUSDT)
{alpha}(560x277add739c6e0477616948357af9e79fe1ec9b80)
{future}(AKEUSDT)
🔥 TOP GEWINNER DES TAGES 🔥
🥇 $BTW — +58,13% 🚀🚀🚀🚀🚀
🥈 #ONDO:
Orochi Network (ON) — +47,71% 🚀🚀🚀🚀⭐
🥉 $AEON — +46,67% 🚀🚀🚀🚀
⭐ $AKE — +38,48% 🚀🚀🚀
📈 #TAG — Beobachtungsliste 👀
Marktstimmung: 🟢 Aufwärtsgerichtet
Momentum-Bewertung: ⭐⭐⭐⭐⭐ (5/5)
Dieses Format wirkt viel auffälliger und ansprechender für Telegram, X oder andere Krypto-Communities.
🥇 $BTW — +58,13% 🚀🚀🚀🚀🚀
🥈 #ONDO:
Orochi Network (ON) — +47,71% 🚀🚀🚀🚀⭐
🥉 $AEON — +46,67% 🚀🚀🚀🚀
⭐ $AKE — +38,48% 🚀🚀🚀
📈 #TAG — Beobachtungsliste 👀
Marktstimmung: 🟢 Aufwärtsgerichtet
Momentum-Bewertung: ⭐⭐⭐⭐⭐ (5/5)
Dieses Format wirkt viel auffälliger und ansprechender für Telegram, X oder andere Krypto-Communities.
2
1
24
1.7k
PINNED
·
--
Bullisch
Verifiziert
🔥 #usfiresontankerbreakingiranblockade | ACHTEN SIE AUF DIE STRIKTHEIT VON ORMUZ
Berichte über einen Vorfall, bei dem US-Kräfte angeblich das Feuer auf einen Öltanker eröffnet haben sollen, der versuchte, die um den Iran verhängte maritime Blockade zu durchbrechen, im Zusammenhang mit der Krise um die Straße von Hormus.
Diese Episode fällt in eine weitaus umfassendere militärische Eskalation, die mit den Bemühungen der USA zusammenhängt, die Schifffahrt in der Region offen zu halten.
📊 WAS BEDEUTET DAS?
Unabhängig davon, wie sich der Konflikt entwickelt, erhöht diese Art von Ereignis in der Regel die Unsicherheit an den Märkten.
Wenn eine Route, durch die ein erheblicher Anteil des weltweiten Öls transportiert wird, bedroht ist, beginnen Anleger, besonders genau hinzuschauen:
• Öl
• Dollar
• Gold
• Krypto
💬 Was denkst du? Wird das die globalen Märkte beeinflussen?
🔥 #usfiresontankerbreakingiranblockade | ACHTEN SIE AUF DIE STRIKTHEIT VON ORMUZ
Berichte über einen Vorfall, bei dem US-Kräfte angeblich das Feuer auf einen Öltanker eröffnet haben sollen, der versuchte, die um den Iran verhängte maritime Blockade zu durchbrechen, im Zusammenhang mit der Krise um die Straße von Hormus.
Diese Episode fällt in eine weitaus umfassendere militärische Eskalation, die mit den Bemühungen der USA zusammenhängt, die Schifffahrt in der Region offen zu halten.
📊 WAS BEDEUTET DAS?
Unabhängig davon, wie sich der Konflikt entwickelt, erhöht diese Art von Ereignis in der Regel die Unsicherheit an den Märkten.
Wenn eine Route, durch die ein erheblicher Anteil des weltweiten Öls transportiert wird, bedroht ist, beginnen Anleger, besonders genau hinzuschauen:
• Öl
• Dollar
• Gold
• Krypto
💬 Was denkst du? Wird das die globalen Märkte beeinflussen?
Berichte über einen Vorfall, bei dem US-Kräfte angeblich das Feuer auf einen Öltanker eröffnet haben sollen, der versuchte, die um den Iran verhängte maritime Blockade zu durchbrechen, im Zusammenhang mit der Krise um die Straße von Hormus.
Diese Episode fällt in eine weitaus umfassendere militärische Eskalation, die mit den Bemühungen der USA zusammenhängt, die Schifffahrt in der Region offen zu halten.
📊 WAS BEDEUTET DAS?
Unabhängig davon, wie sich der Konflikt entwickelt, erhöht diese Art von Ereignis in der Regel die Unsicherheit an den Märkten.
Wenn eine Route, durch die ein erheblicher Anteil des weltweiten Öls transportiert wird, bedroht ist, beginnen Anleger, besonders genau hinzuschauen:
• Öl
• Dollar
• Gold
• Krypto
💬 Was denkst du? Wird das die globalen Märkte beeinflussen?

2
36
24k
·
--
Bullisch
Übersetzung ansehen
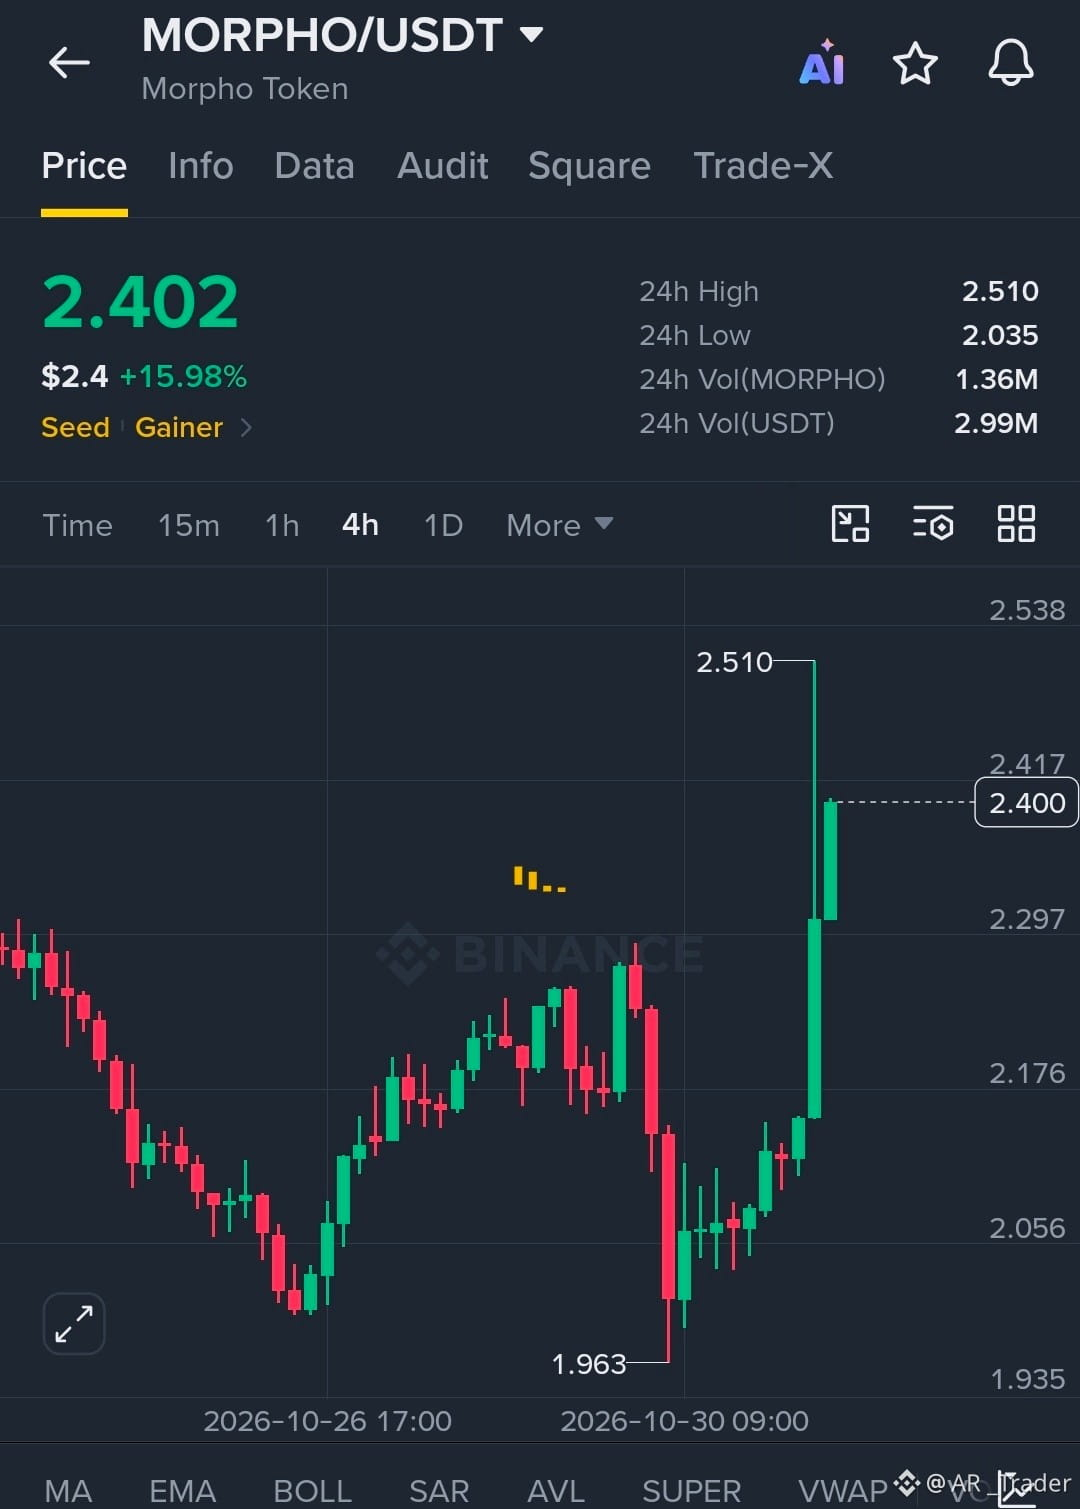
$MORPHO /USDT Breaks Above Resistance as Bulls Target Further Upside
Trade Setup: LONG
Entry Zone: 2.37–2.41
TP1: 2.48
TP2: 2.55
TP3: 2.65
SL: 2.29
Market Setup: The 4-hour chart shows a strong bullish breakout from the 2.17 resistance area, with price climbing toward 2.51 before a slight pullback. Holding above 2.30 could support another upward move, while a confirmed break above 2.51 may open the path toward higher targets. Avoid chasing the sharp rally.
Buy and trade $MORPHO
{future}(MORPHOUSDT)
.
$MORPHO /USDT Breaks Above Resistance as Bulls Target Further Upside
Trade Setup: LONG
Entry Zone: 2.37–2.41
TP1: 2.48
TP2: 2.55
TP3: 2.65
SL: 2.29
Market Setup: The 4-hour chart shows a strong bullish breakout from the 2.17 resistance area, with price climbing toward 2.51 before a slight pullback. Holding above 2.30 could support another upward move, while a confirmed break above 2.51 may open the path toward higher targets. Avoid chasing the sharp rally.
Buy and trade $MORPHO
.
Trade Setup: LONG
Entry Zone: 2.37–2.41
TP1: 2.48
TP2: 2.55
TP3: 2.65
SL: 2.29
Market Setup: The 4-hour chart shows a strong bullish breakout from the 2.17 resistance area, with price climbing toward 2.51 before a slight pullback. Holding above 2.30 could support another upward move, while a confirmed break above 2.51 may open the path toward higher targets. Avoid chasing the sharp rally.
Buy and trade $MORPHO
.
1
29
·
--
Bullisch
Übersetzung ansehen
$MORPHO /USDT Breaks Above Resistance as Bulls Target Further Upside
Trade Setup: LONG
Entry Zone: 2.37–2.41
TP1: 2.48
TP2: 2.55
TP3: 2.65
SL: 2.29
Market Setup: The 4-hour chart shows a strong bullish breakout from the 2.17 resistance area, with price climbing toward 2.51 before a slight pullback. Holding above 2.30 could support another upward move, while a confirmed break above 2.51 may open the path toward higher targets. Avoid chasing the sharp rally.
Buy and trade $MORPHO
{future}(MORPHOUSDT)
.
$MORPHO /USDT Breaks Above Resistance as Bulls Target Further Upside
Trade Setup: LONG
Entry Zone: 2.37–2.41
TP1: 2.48
TP2: 2.55
TP3: 2.65
SL: 2.29
Market Setup: The 4-hour chart shows a strong bullish breakout from the 2.17 resistance area, with price climbing toward 2.51 before a slight pullback. Holding above 2.30 could support another upward move, while a confirmed break above 2.51 may open the path toward higher targets. Avoid chasing the sharp rally.
Buy and trade $MORPHO
.
Trade Setup: LONG
Entry Zone: 2.37–2.41
TP1: 2.48
TP2: 2.55
TP3: 2.65
SL: 2.29
Market Setup: The 4-hour chart shows a strong bullish breakout from the 2.17 resistance area, with price climbing toward 2.51 before a slight pullback. Holding above 2.30 could support another upward move, while a confirmed break above 2.51 may open the path toward higher targets. Avoid chasing the sharp rally.
Buy and trade $MORPHO
.
1
22
·
--
Bullisch
Übersetzung ansehen
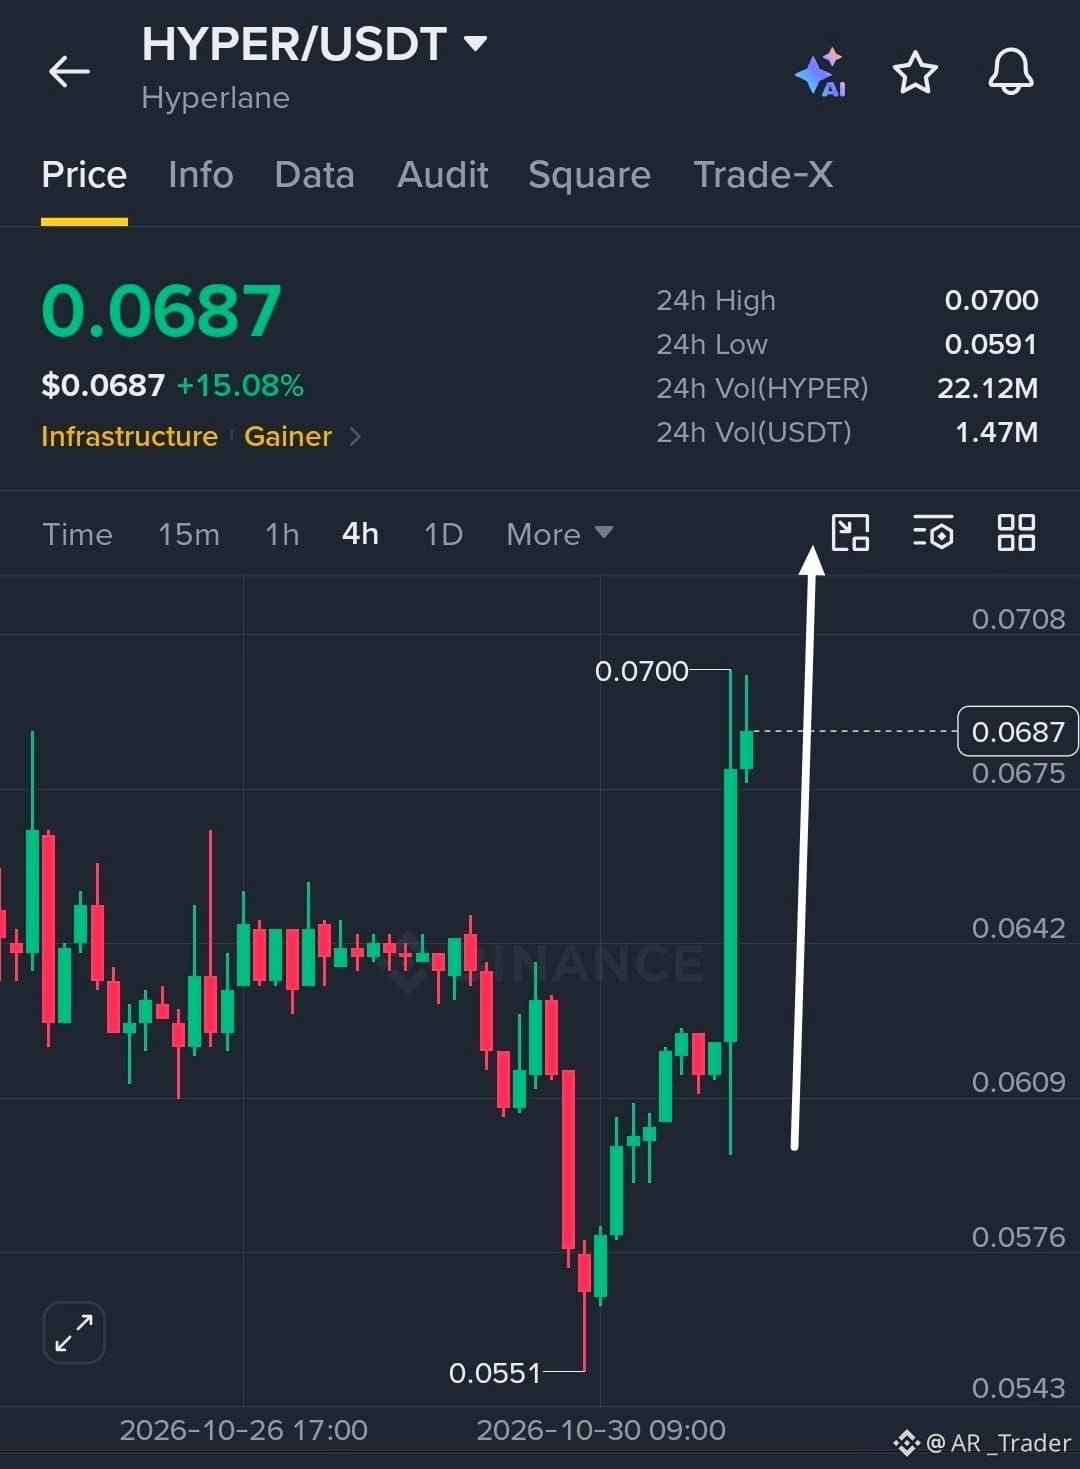
$HYPER /USDT Breaks Above Consolidation as Bulls Target Further Upside
Trade Setup: LONG
Entry Zone: 0.0670–0.0685
TP1: 0.0715
TP2: 0.0740
TP3: 0.0780
SL: 0.0645
Market Setup: The 4-hour chart shows a strong bullish breakout from the 0.0610–0.0640 consolidation zone, with price testing resistance near 0.0700. A confirmed break above this level could extend the rally toward higher targets. Watch for a pullback and retest before entering, as momentum is already stretched.
Buy and trade $HYPER
{future}(HYPERUSDT)
.
$HYPER /USDT Breaks Above Consolidation as Bulls Target Further Upside
Trade Setup: LONG
Entry Zone: 0.0670–0.0685
TP1: 0.0715
TP2: 0.0740
TP3: 0.0780
SL: 0.0645
Market Setup: The 4-hour chart shows a strong bullish breakout from the 0.0610–0.0640 consolidation zone, with price testing resistance near 0.0700. A confirmed break above this level could extend the rally toward higher targets. Watch for a pullback and retest before entering, as momentum is already stretched.
Buy and trade $HYPER
.
Trade Setup: LONG
Entry Zone: 0.0670–0.0685
TP1: 0.0715
TP2: 0.0740
TP3: 0.0780
SL: 0.0645
Market Setup: The 4-hour chart shows a strong bullish breakout from the 0.0610–0.0640 consolidation zone, with price testing resistance near 0.0700. A confirmed break above this level could extend the rally toward higher targets. Watch for a pullback and retest before entering, as momentum is already stretched.
Buy and trade $HYPER
.
1
37
·
--
Bullisch
Übersetzung ansehen
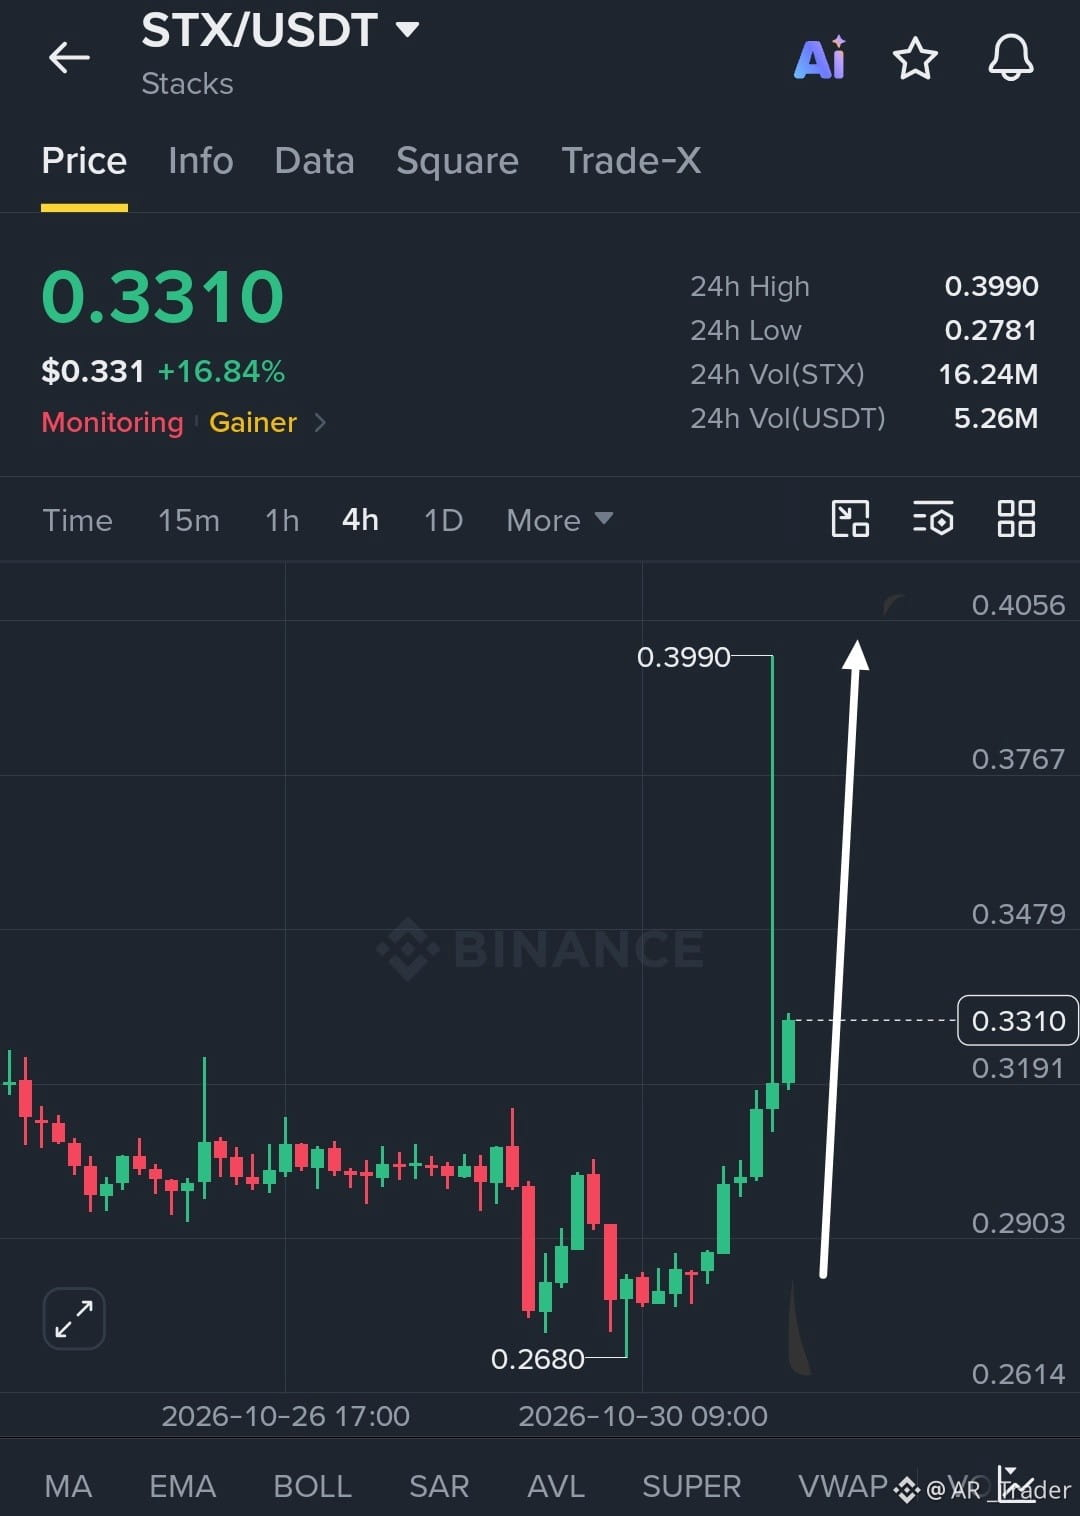
$STX /USDT Breaks Out as Bulls Target Another Rally
Trade Setup: LONG
Entry Zone: 0.3250–0.3340
TP1: 0.3480
TP2: 0.3770
TP3: 0.3990
SL: 0.3080
Market Setup: The 4-hour chart shows a strong breakout from the 0.2680 support area, with price climbing toward 0.3990 before pulling back. Holding above 0.3190 could support another bullish move toward resistance, while a drop below 0.3080 would weaken the setup. Avoid chasing the sharp move; watch for confirmation.
Buy and trade
{future}(STXUSDT)
$STXB
{spot}(STXBUSDT)
$STRK
{future}(STRKUSDT)
$STX /USDT Breaks Out as Bulls Target Another Rally
Trade Setup: LONG
Entry Zone: 0.3250–0.3340
TP1: 0.3480
TP2: 0.3770
TP3: 0.3990
SL: 0.3080
Market Setup: The 4-hour chart shows a strong breakout from the 0.2680 support area, with price climbing toward 0.3990 before pulling back. Holding above 0.3190 could support another bullish move toward resistance, while a drop below 0.3080 would weaken the setup. Avoid chasing the sharp move; watch for confirmation.
Buy and trade
$STXB
$STRK
Trade Setup: LONG
Entry Zone: 0.3250–0.3340
TP1: 0.3480
TP2: 0.3770
TP3: 0.3990
SL: 0.3080
Market Setup: The 4-hour chart shows a strong breakout from the 0.2680 support area, with price climbing toward 0.3990 before pulling back. Holding above 0.3190 could support another bullish move toward resistance, while a drop below 0.3080 would weaken the setup. Avoid chasing the sharp move; watch for confirmation.
Buy and trade
$STXB
$STRK
1
26
·
--
Bullisch
Übersetzung ansehen
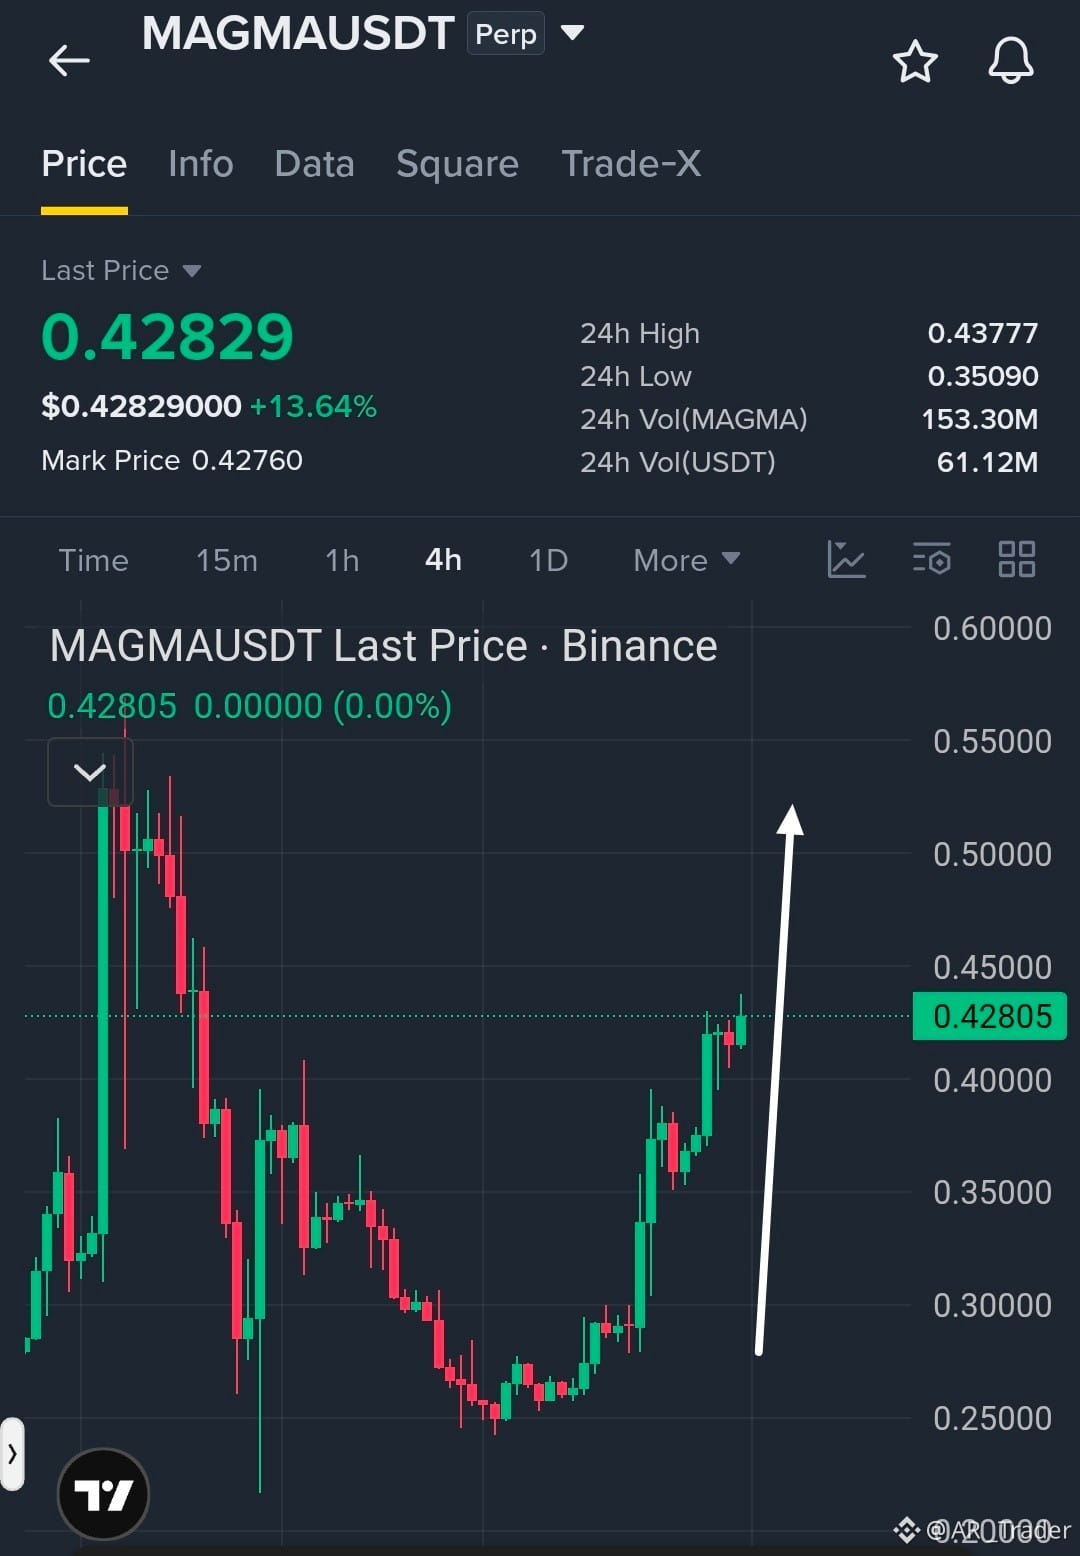
$MAGMA USDT Builds Strong Bullish Momentum as Buyers Target Higher Levels
Trade Setup: LONG
Entry Zone: 0.4150–0.4300
TP1: 0.4500
TP2: 0.4800
TP3: 0.5200
SL: 0.3950
Market Setup: The 4-hour chart shows a strong recovery from the 0.2500 support area, with buyers pushing price toward 0.4380 resistance. A confirmed breakout above this level could extend the rally toward higher targets. Watch for a retest before entering, as momentum is already strong.
Buy and trade $MAGMA
{future}(MAGMAUSDT)
.
$MAGMA USDT Builds Strong Bullish Momentum as Buyers Target Higher Levels
Trade Setup: LONG
Entry Zone: 0.4150–0.4300
TP1: 0.4500
TP2: 0.4800
TP3: 0.5200
SL: 0.3950
Market Setup: The 4-hour chart shows a strong recovery from the 0.2500 support area, with buyers pushing price toward 0.4380 resistance. A confirmed breakout above this level could extend the rally toward higher targets. Watch for a retest before entering, as momentum is already strong.
Buy and trade $MAGMA
.
Trade Setup: LONG
Entry Zone: 0.4150–0.4300
TP1: 0.4500
TP2: 0.4800
TP3: 0.5200
SL: 0.3950
Market Setup: The 4-hour chart shows a strong recovery from the 0.2500 support area, with buyers pushing price toward 0.4380 resistance. A confirmed breakout above this level could extend the rally toward higher targets. Watch for a retest before entering, as momentum is already strong.
Buy and trade $MAGMA
.
1
125
·
--
Bullisch
Übersetzung ansehen
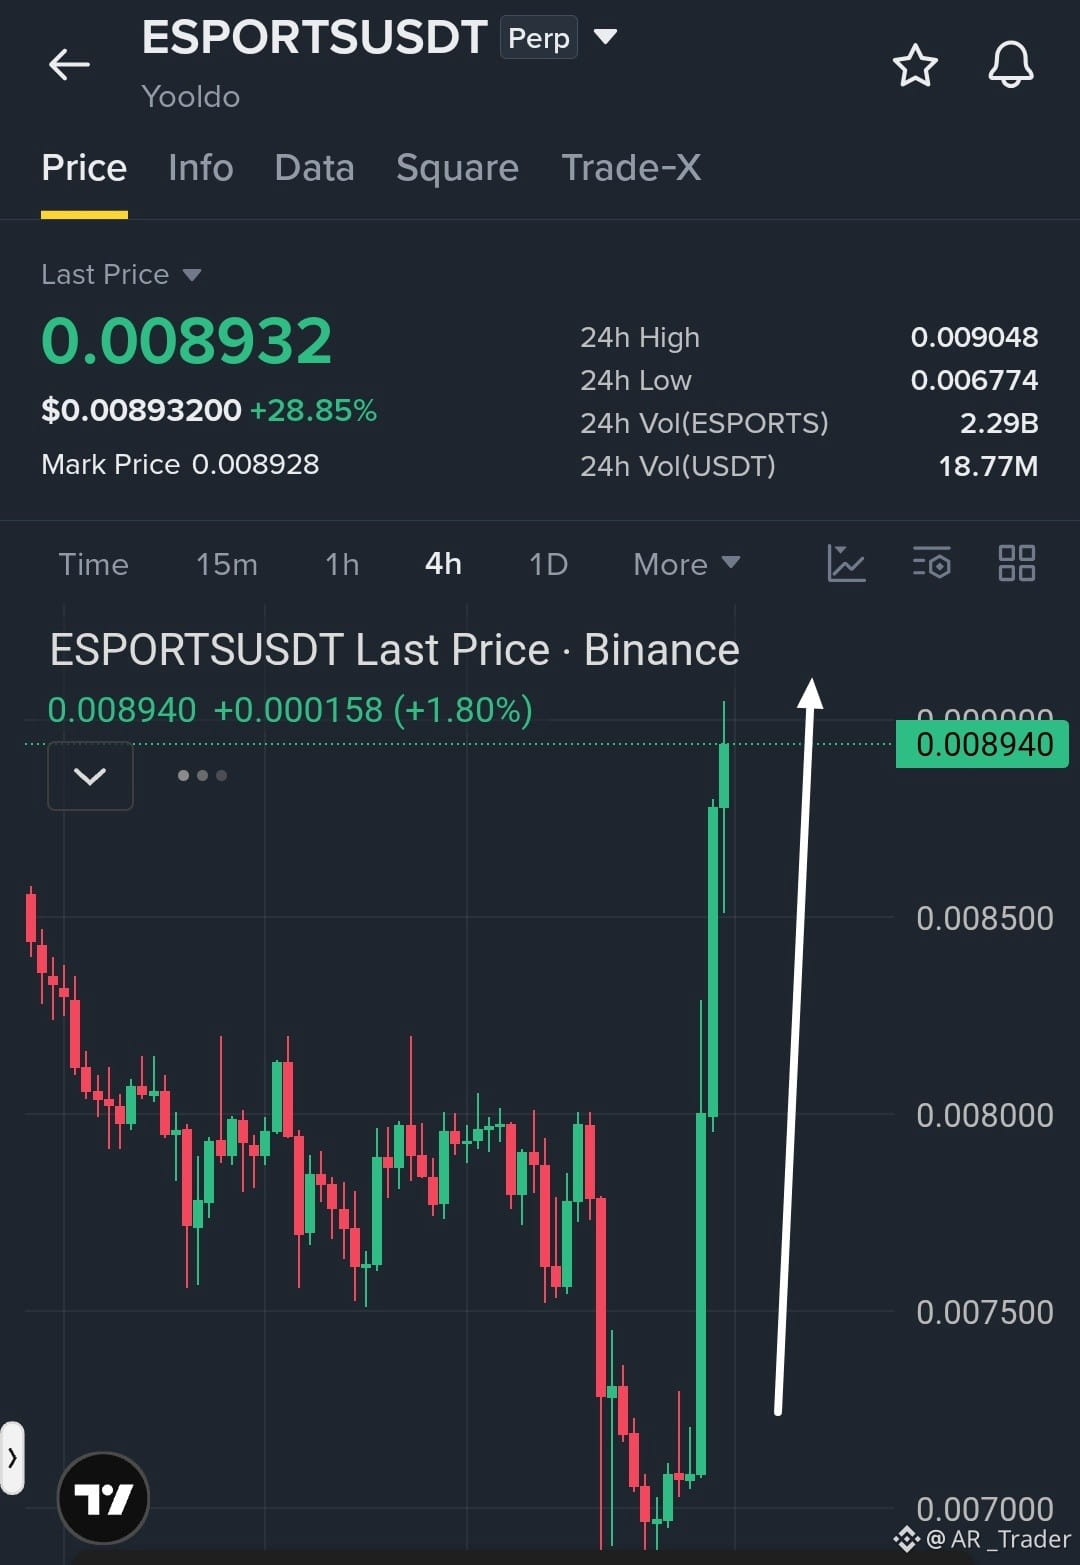
$ESPORTS USDT Breaks Out Strongly as Bulls Push Toward New Highs
Trade Setup: LONG
Entry Zone: 0.00865–0.00890
TP1: 0.00940
TP2: 0.00985
TP3: 0.01030
SL: 0.00825
Market Setup: The 4-hour chart shows a powerful bullish breakout from the 0.00700–0.00800 consolidation zone, supported by strong upward momentum. Price is testing resistance near 0.00905; a confirmed breakout could extend the rally, while a pullback toward the entry zone may offer a better opportunity.
Buy and trade $ESPORTS
{future}(ESPORTSUSDT)
.
$ESPORTS USDT Breaks Out Strongly as Bulls Push Toward New Highs
Trade Setup: LONG
Entry Zone: 0.00865–0.00890
TP1: 0.00940
TP2: 0.00985
TP3: 0.01030
SL: 0.00825
Market Setup: The 4-hour chart shows a powerful bullish breakout from the 0.00700–0.00800 consolidation zone, supported by strong upward momentum. Price is testing resistance near 0.00905; a confirmed breakout could extend the rally, while a pullback toward the entry zone may offer a better opportunity.
Buy and trade $ESPORTS
.
Trade Setup: LONG
Entry Zone: 0.00865–0.00890
TP1: 0.00940
TP2: 0.00985
TP3: 0.01030
SL: 0.00825
Market Setup: The 4-hour chart shows a powerful bullish breakout from the 0.00700–0.00800 consolidation zone, supported by strong upward momentum. Price is testing resistance near 0.00905; a confirmed breakout could extend the rally, while a pullback toward the entry zone may offer a better opportunity.
Buy and trade $ESPORTS
.
1
43
·
--
Bullisch
Übersetzung ansehen
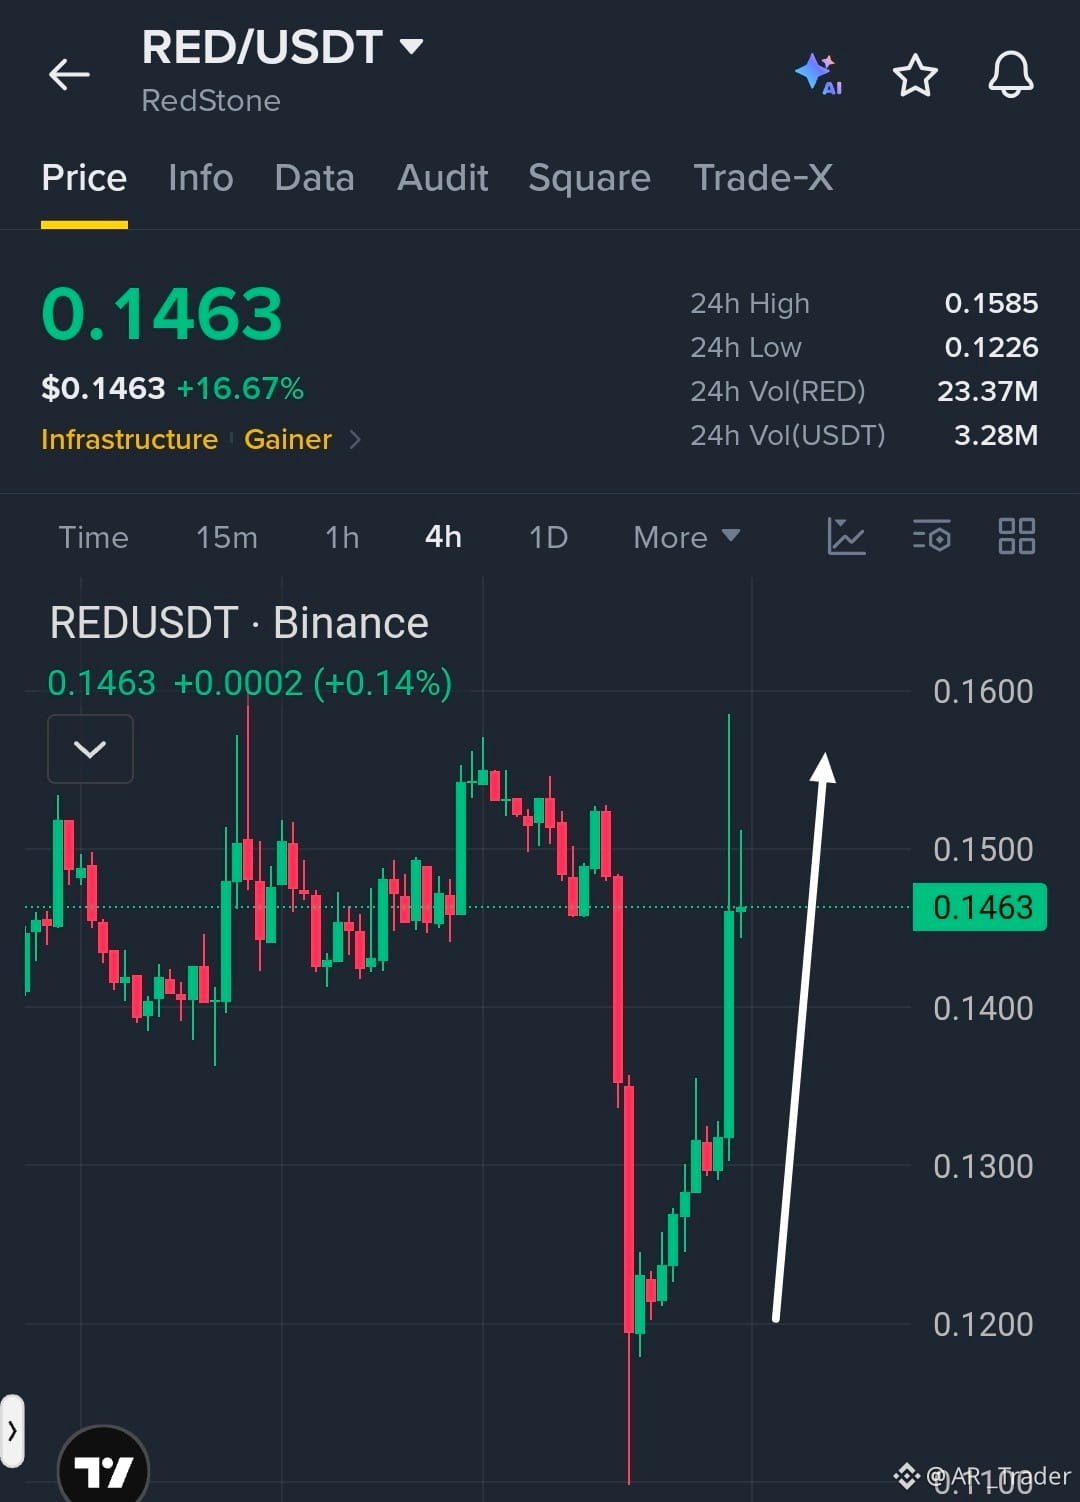
$RED /USDT Rebounds Strongly as Bulls Aim for a Higher Breakout
Trade Setup: LONG
Entry Zone: 0.1440–0.1470
TP1: 0.1520
TP2: 0.1580
TP3: 0.1650
SL: 0.1370
Market Setup: The 4-hour chart shows a strong recovery from the 0.1200 support area, with buyers pushing price back toward 0.1500 resistance. A sustained move above this level could open the way toward higher targets, while losing 0.1370 would weaken the bullish setup.
Buy and trade $RED
{future}(REDUSDT)
.
$RED /USDT Rebounds Strongly as Bulls Aim for a Higher Breakout
Trade Setup: LONG
Entry Zone: 0.1440–0.1470
TP1: 0.1520
TP2: 0.1580
TP3: 0.1650
SL: 0.1370
Market Setup: The 4-hour chart shows a strong recovery from the 0.1200 support area, with buyers pushing price back toward 0.1500 resistance. A sustained move above this level could open the way toward higher targets, while losing 0.1370 would weaken the bullish setup.
Buy and trade $RED
.
Trade Setup: LONG
Entry Zone: 0.1440–0.1470
TP1: 0.1520
TP2: 0.1580
TP3: 0.1650
SL: 0.1370
Market Setup: The 4-hour chart shows a strong recovery from the 0.1200 support area, with buyers pushing price back toward 0.1500 resistance. A sustained move above this level could open the way toward higher targets, while losing 0.1370 would weaken the bullish setup.
Buy and trade $RED
.
1
35
·
--
Bullisch
Übersetzung ansehen
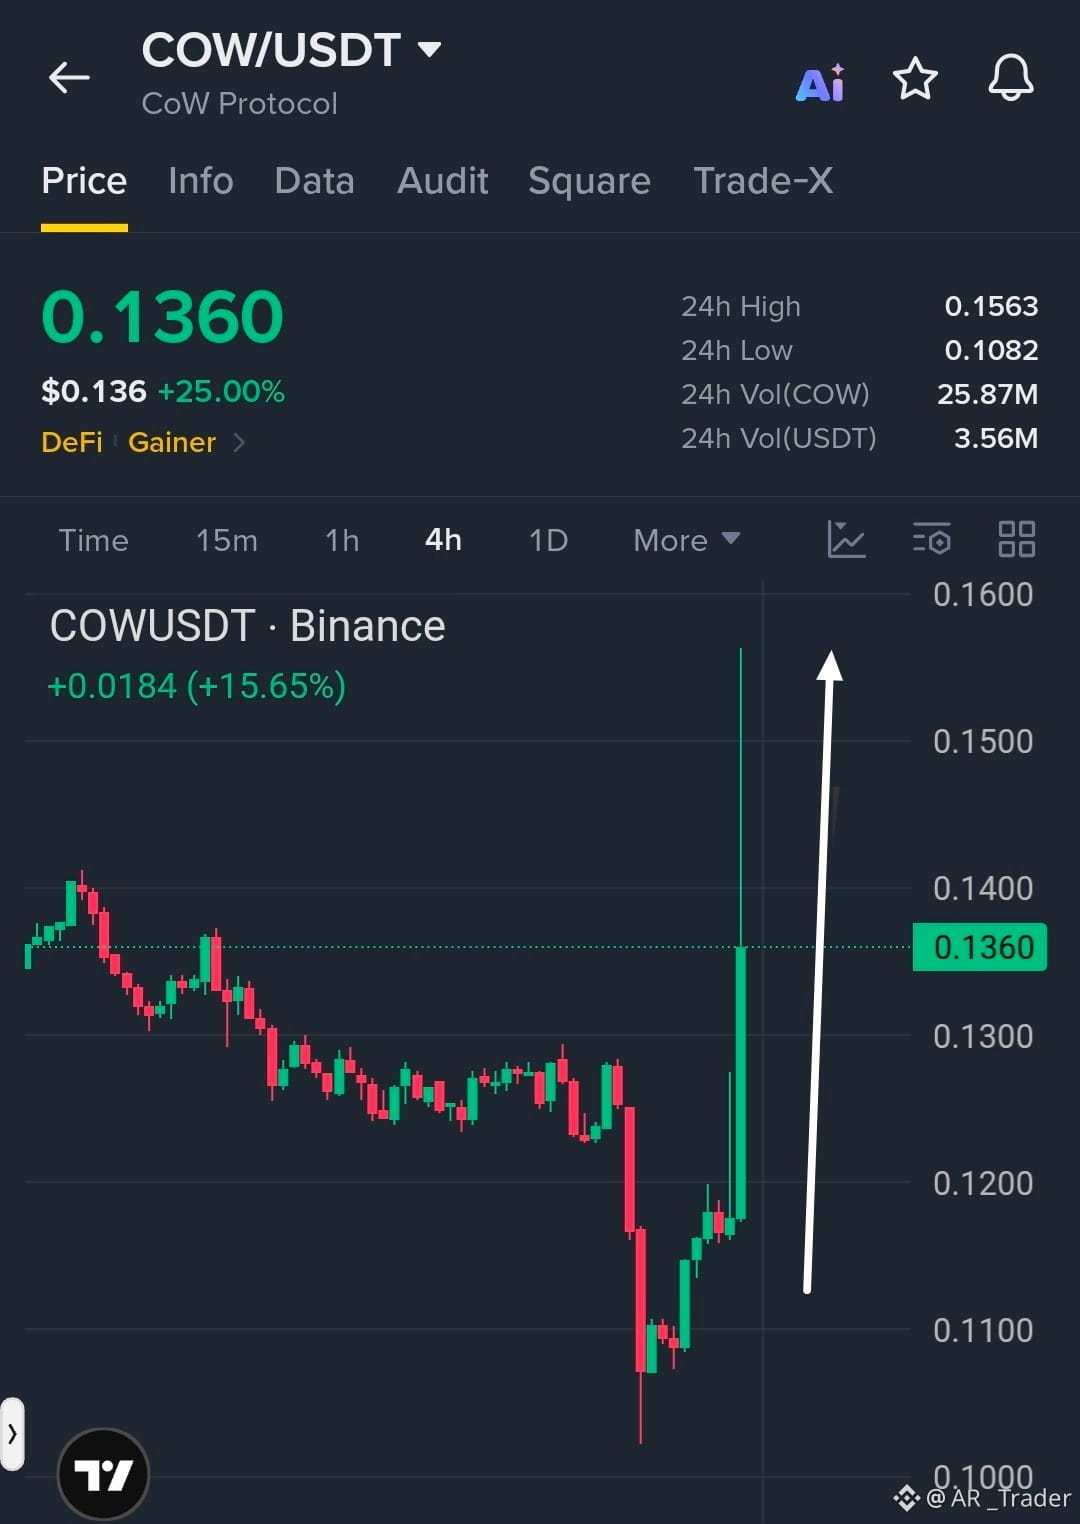
$COW /USDT Signals a Strong Bullish Breakout as Buying Pressure Surges
Trade Setup: LONG
Entry Zone: 0.1320–0.1360
TP1: 0.1450
TP2: 0.1520
TP3: 0.1600
SL: 0.1260
Market Setup: A powerful bullish candle has pushed price above previous resistance, signaling a potential trend reversal. Strong buying momentum could drive further upside toward higher resistance levels. Watch for a successful hold above 0.1320 to confirm continuation. High volatility is expected after this sharp move$COW .
$COW /USDT Signals a Strong Bullish Breakout as Buying Pressure Surges
Trade Setup: LONG
Entry Zone: 0.1320–0.1360
TP1: 0.1450
TP2: 0.1520
TP3: 0.1600
SL: 0.1260
Market Setup: A powerful bullish candle has pushed price above previous resistance, signaling a potential trend reversal. Strong buying momentum could drive further upside toward higher resistance levels. Watch for a successful hold above 0.1320 to confirm continuation. High volatility is expected after this sharp move$COW .
Trade Setup: LONG
Entry Zone: 0.1320–0.1360
TP1: 0.1450
TP2: 0.1520
TP3: 0.1600
SL: 0.1260
Market Setup: A powerful bullish candle has pushed price above previous resistance, signaling a potential trend reversal. Strong buying momentum could drive further upside toward higher resistance levels. Watch for a successful hold above 0.1320 to confirm continuation. High volatility is expected after this sharp move$COW .
41
·
--
Bullisch
Übersetzung ansehen
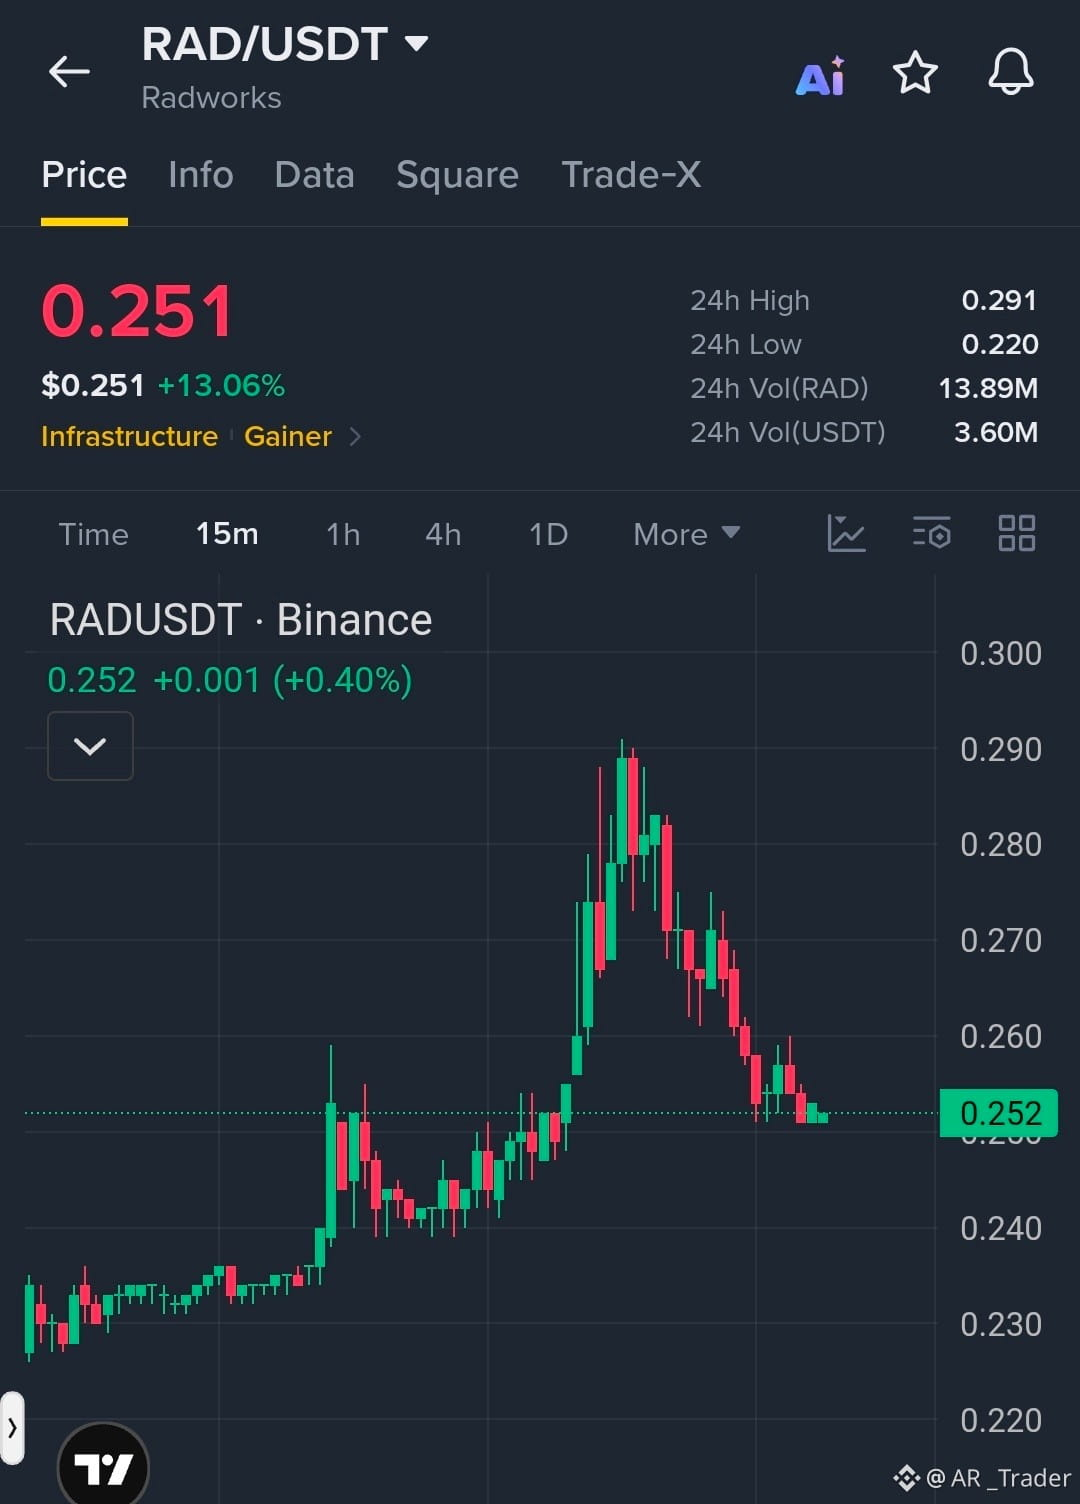
$RAD /USDT Holds Key Support as Bulls Prepare for a Potential Recovery
Trade Setup: LONG
Entry Zone: 0.250–0.253
TP1: 0.260
TP2: 0.270
TP3: 0.280
SL: 0.244
Market Setup: After reaching 0.291, price pulled back toward the 0.250 support zone and is showing signs of stabilization. Holding this level could support a recovery toward 0.270–0.280, while a breakdown below 0.244 would invalidate the bullish setup.
Buy and trade $RAD .
{spot}(RADUSDT)
$RAD /USDT Holds Key Support as Bulls Prepare for a Potential Recovery
Trade Setup: LONG
Entry Zone: 0.250–0.253
TP1: 0.260
TP2: 0.270
TP3: 0.280
SL: 0.244
Market Setup: After reaching 0.291, price pulled back toward the 0.250 support zone and is showing signs of stabilization. Holding this level could support a recovery toward 0.270–0.280, while a breakdown below 0.244 would invalidate the bullish setup.
Buy and trade $RAD .
Trade Setup: LONG
Entry Zone: 0.250–0.253
TP1: 0.260
TP2: 0.270
TP3: 0.280
SL: 0.244
Market Setup: After reaching 0.291, price pulled back toward the 0.250 support zone and is showing signs of stabilization. Holding this level could support a recovery toward 0.270–0.280, while a breakdown below 0.244 would invalidate the bullish setup.
Buy and trade $RAD .
1
29
·
--
Bullisch
Übersetzung ansehen
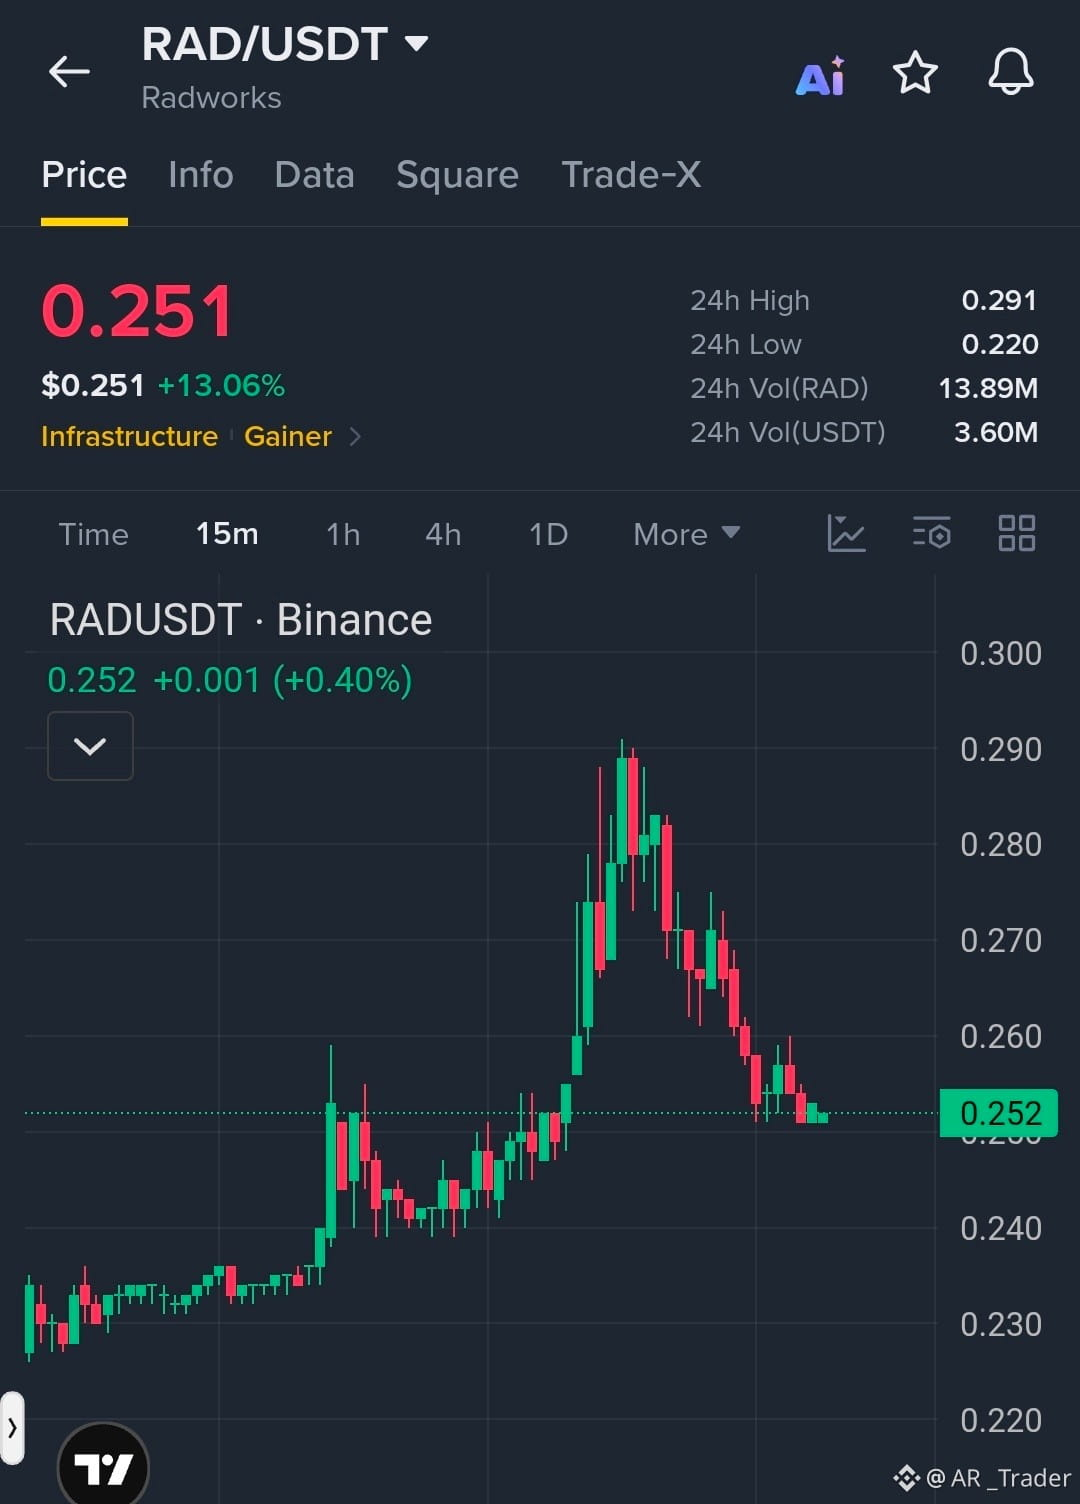
$RAD /USDT Holds Key Support as Bulls Prepare for a Potential Recovery
Trade Setup: LONG
Entry Zone: 0.250–0.253
TP1: 0.260
TP2: 0.270
TP3: 0.280
SL: 0.244
Market Setup: After reaching 0.291, price pulled back toward the 0.250 support zone and is showing signs of stabilization. Holding this level could support a recovery toward 0.270–0.280, while a breakdown below 0.244 would invalidate the bullish setup.
Buy and trade $RAD .
{spot}(RADUSDT)
$RAD /USDT Holds Key Support as Bulls Prepare for a Potential Recovery
Trade Setup: LONG
Entry Zone: 0.250–0.253
TP1: 0.260
TP2: 0.270
TP3: 0.280
SL: 0.244
Market Setup: After reaching 0.291, price pulled back toward the 0.250 support zone and is showing signs of stabilization. Holding this level could support a recovery toward 0.270–0.280, while a breakdown below 0.244 would invalidate the bullish setup.
Buy and trade $RAD .
Trade Setup: LONG
Entry Zone: 0.250–0.253
TP1: 0.260
TP2: 0.270
TP3: 0.280
SL: 0.244
Market Setup: After reaching 0.291, price pulled back toward the 0.250 support zone and is showing signs of stabilization. Holding this level could support a recovery toward 0.270–0.280, while a breakdown below 0.244 would invalidate the bullish setup.
Buy and trade $RAD .
25
·
--
Bullisch
Übersetzung ansehen
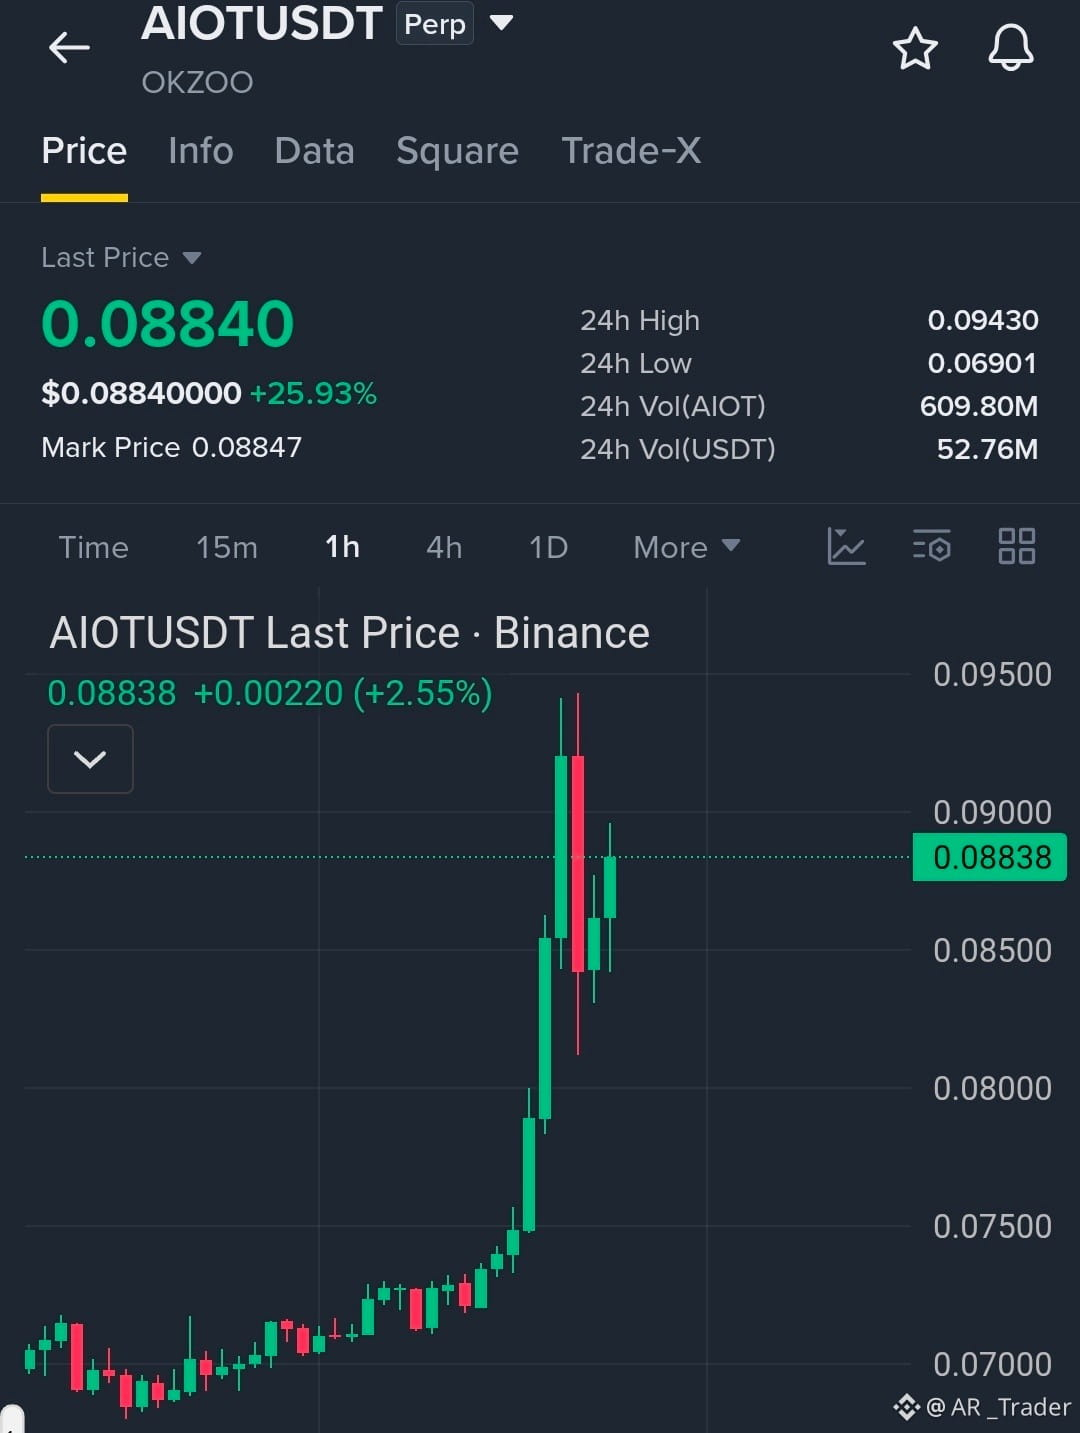
$AIOT USDT Rebounds Strongly as Bulls Target Another Upside Move
Trade Setup: LONG
Entry Zone: 0.0875–0.0885
TP1: 0.0910
TP2: 0.0940
TP3: 0.0980
SL: 0.0840
Market Setup: The 1-hour chart shows a strong breakout followed by a sharp pullback and bullish recovery. Holding above 0.0850 could support another move toward 0.0940, while a break below 0.0840 would weaken the setup. High volatility calls for careful risk management.
Buy and trade $AIOT .
$AIOT USDT Rebounds Strongly as Bulls Target Another Upside Move
Trade Setup: LONG
Entry Zone: 0.0875–0.0885
TP1: 0.0910
TP2: 0.0940
TP3: 0.0980
SL: 0.0840
Market Setup: The 1-hour chart shows a strong breakout followed by a sharp pullback and bullish recovery. Holding above 0.0850 could support another move toward 0.0940, while a break below 0.0840 would weaken the setup. High volatility calls for careful risk management.
Buy and trade $AIOT .
Trade Setup: LONG
Entry Zone: 0.0875–0.0885
TP1: 0.0910
TP2: 0.0940
TP3: 0.0980
SL: 0.0840
Market Setup: The 1-hour chart shows a strong breakout followed by a sharp pullback and bullish recovery. Holding above 0.0850 could support another move toward 0.0940, while a break below 0.0840 would weaken the setup. High volatility calls for careful risk management.
Buy and trade $AIOT .
2
44
·
--
Bullisch
Übersetzung ansehen
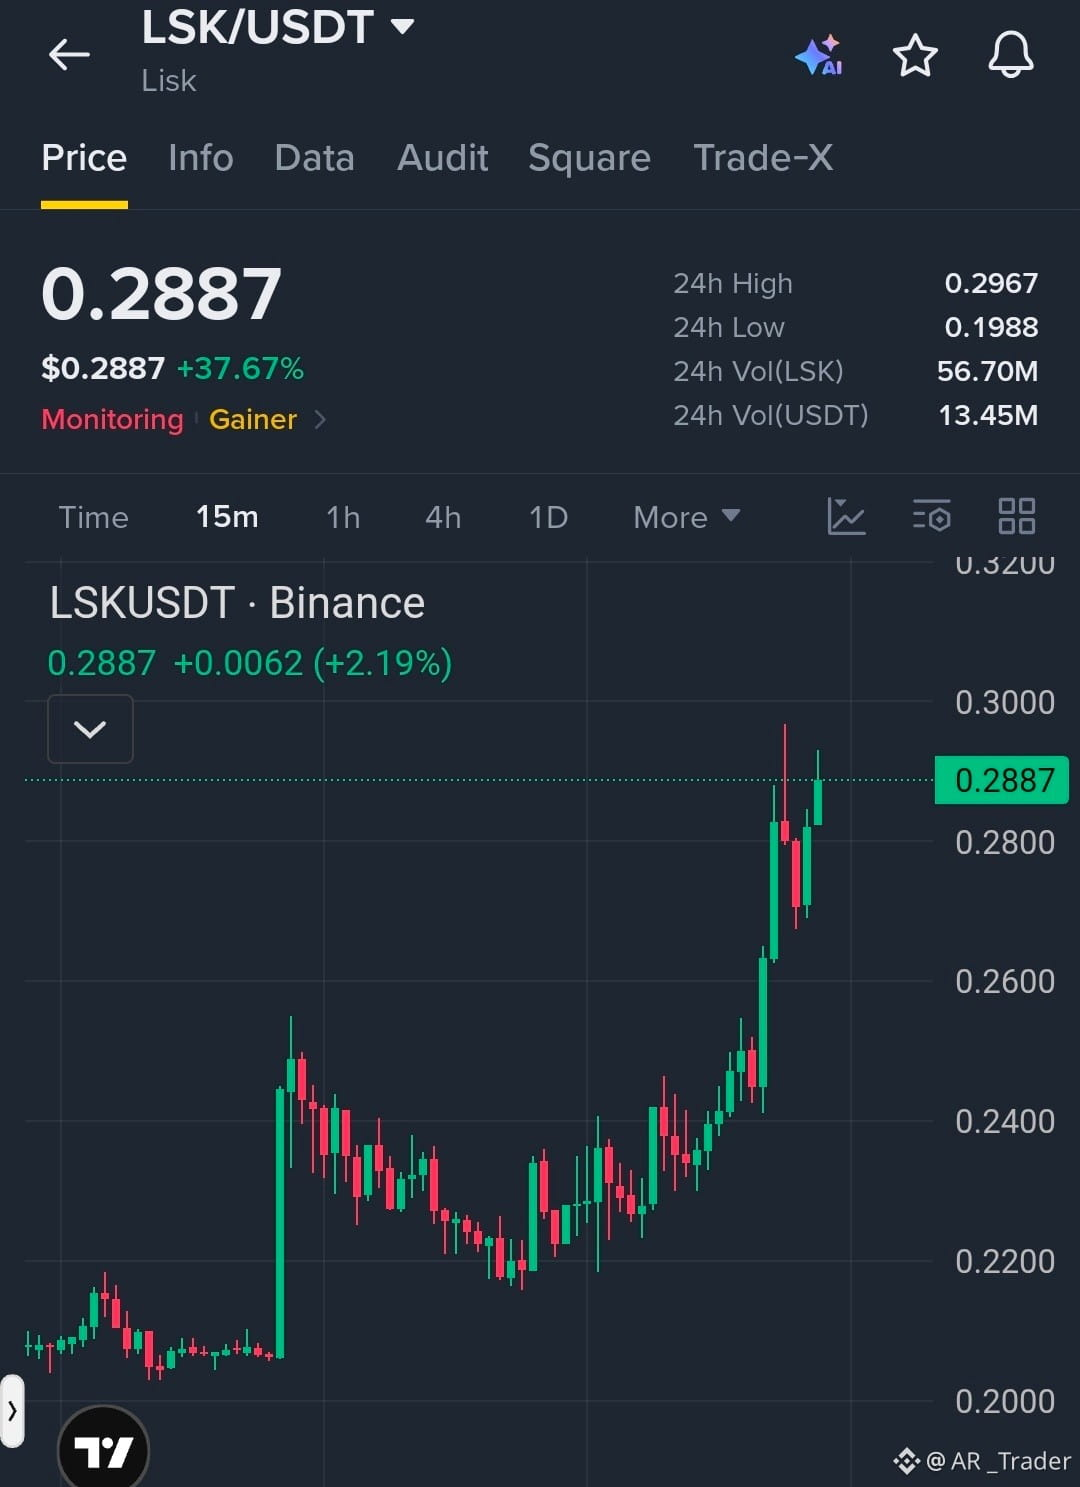
$LSK /USDT Extends Its Rally as Bulls Target Higher Levels
Trade Setup: LONG
Entry Zone: 0.2850–0.2890
TP1: 0.2960
TP2: 0.3050
TP3: 0.3150
SL: 0.2760
Market Setup: The 15-minute chart shows strong bullish momentum after a sharp breakout from the 0.24 region. Price is holding near 0.2880, and a sustained move above 0.2970 could trigger another upward leg. Watch for volatility after the strong rally.
Buy and trade $LSK .
$LSK /USDT Extends Its Rally as Bulls Target Higher Levels
Trade Setup: LONG
Entry Zone: 0.2850–0.2890
TP1: 0.2960
TP2: 0.3050
TP3: 0.3150
SL: 0.2760
Market Setup: The 15-minute chart shows strong bullish momentum after a sharp breakout from the 0.24 region. Price is holding near 0.2880, and a sustained move above 0.2970 could trigger another upward leg. Watch for volatility after the strong rally.
Buy and trade $LSK .
Trade Setup: LONG
Entry Zone: 0.2850–0.2890
TP1: 0.2960
TP2: 0.3050
TP3: 0.3150
SL: 0.2760
Market Setup: The 15-minute chart shows strong bullish momentum after a sharp breakout from the 0.24 region. Price is holding near 0.2880, and a sustained move above 0.2970 could trigger another upward leg. Watch for volatility after the strong rally.
Buy and trade $LSK .
2
36
·
--
Bullisch
Übersetzung ansehen
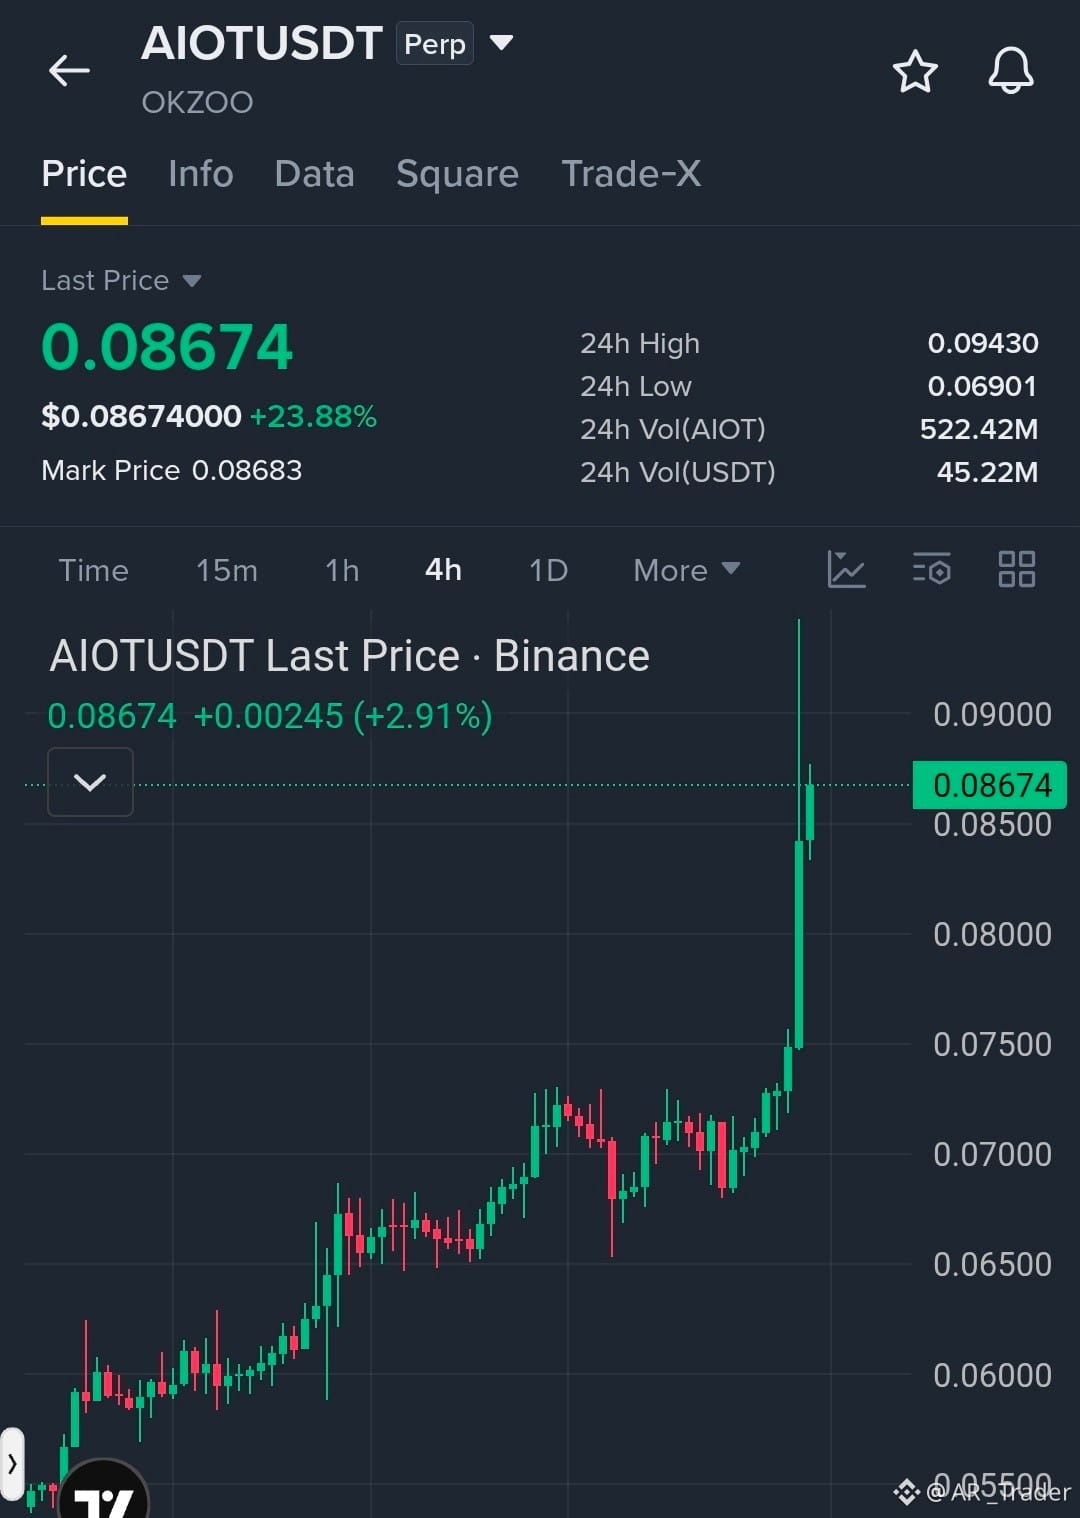
$AIOT Is Exploding Beyond Expectations!
A massive 4H breakout has pushed price above its previous consolidation range, with buyers showing serious strength. The 36% surge could be just the beginning if this momentum holds. A move toward 0.1000 is now on the radar.
Entry: 0.0920–0.0940 TP: 0.1000 SL: 0.0880
Buy and trade $AIOT
{future}(AIOTUSDT)
$AIOT Is Exploding Beyond Expectations!
A massive 4H breakout has pushed price above its previous consolidation range, with buyers showing serious strength. The 36% surge could be just the beginning if this momentum holds. A move toward 0.1000 is now on the radar.
Entry: 0.0920–0.0940 TP: 0.1000 SL: 0.0880
Buy and trade $AIOT
A massive 4H breakout has pushed price above its previous consolidation range, with buyers showing serious strength. The 36% surge could be just the beginning if this momentum holds. A move toward 0.1000 is now on the radar.
Entry: 0.0920–0.0940 TP: 0.1000 SL: 0.0880
Buy and trade $AIOT
1
25
·
--
Bullisch
Übersetzung ansehen
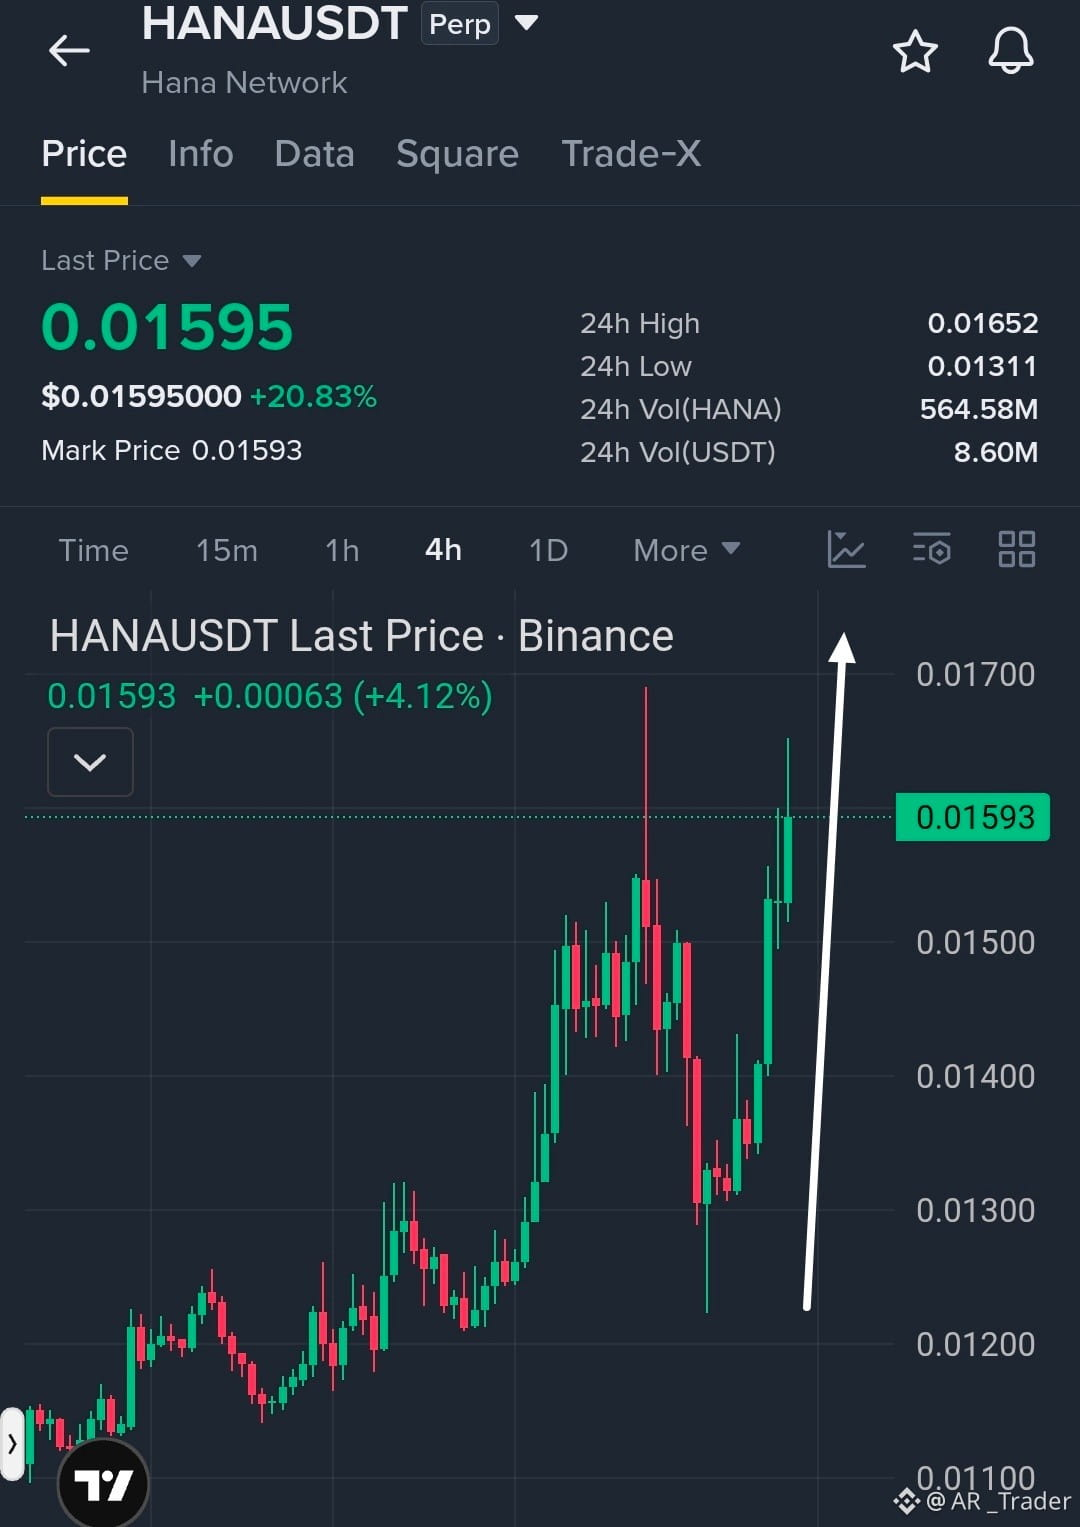
$HANA /USDT Breaks Higher as Bullish Momentum Accelerates
Trade Setup: LONG
Entry Zone: 0.01570–0.01595
TP1: 0.01650
TP2: 0.01700
TP3: 0.01760
SL: 0.01510
Market Setup: The 4-hour chart shows a strong recovery with price pushing above the 0.01500 resistance zone. Sustaining this breakout could drive further upside toward 0.01700, while a drop below 0.01510 would weaken the bullish structure.
Buy and trade $HANA
{future}(HANAUSDT)
.
$HANA /USDT Breaks Higher as Bullish Momentum Accelerates
Trade Setup: LONG
Entry Zone: 0.01570–0.01595
TP1: 0.01650
TP2: 0.01700
TP3: 0.01760
SL: 0.01510
Market Setup: The 4-hour chart shows a strong recovery with price pushing above the 0.01500 resistance zone. Sustaining this breakout could drive further upside toward 0.01700, while a drop below 0.01510 would weaken the bullish structure.
Buy and trade $HANA
.
Trade Setup: LONG
Entry Zone: 0.01570–0.01595
TP1: 0.01650
TP2: 0.01700
TP3: 0.01760
SL: 0.01510
Market Setup: The 4-hour chart shows a strong recovery with price pushing above the 0.01500 resistance zone. Sustaining this breakout could drive further upside toward 0.01700, while a drop below 0.01510 would weaken the bullish structure.
Buy and trade $HANA
.
1
19
·
--
Bullisch
Übersetzung ansehen
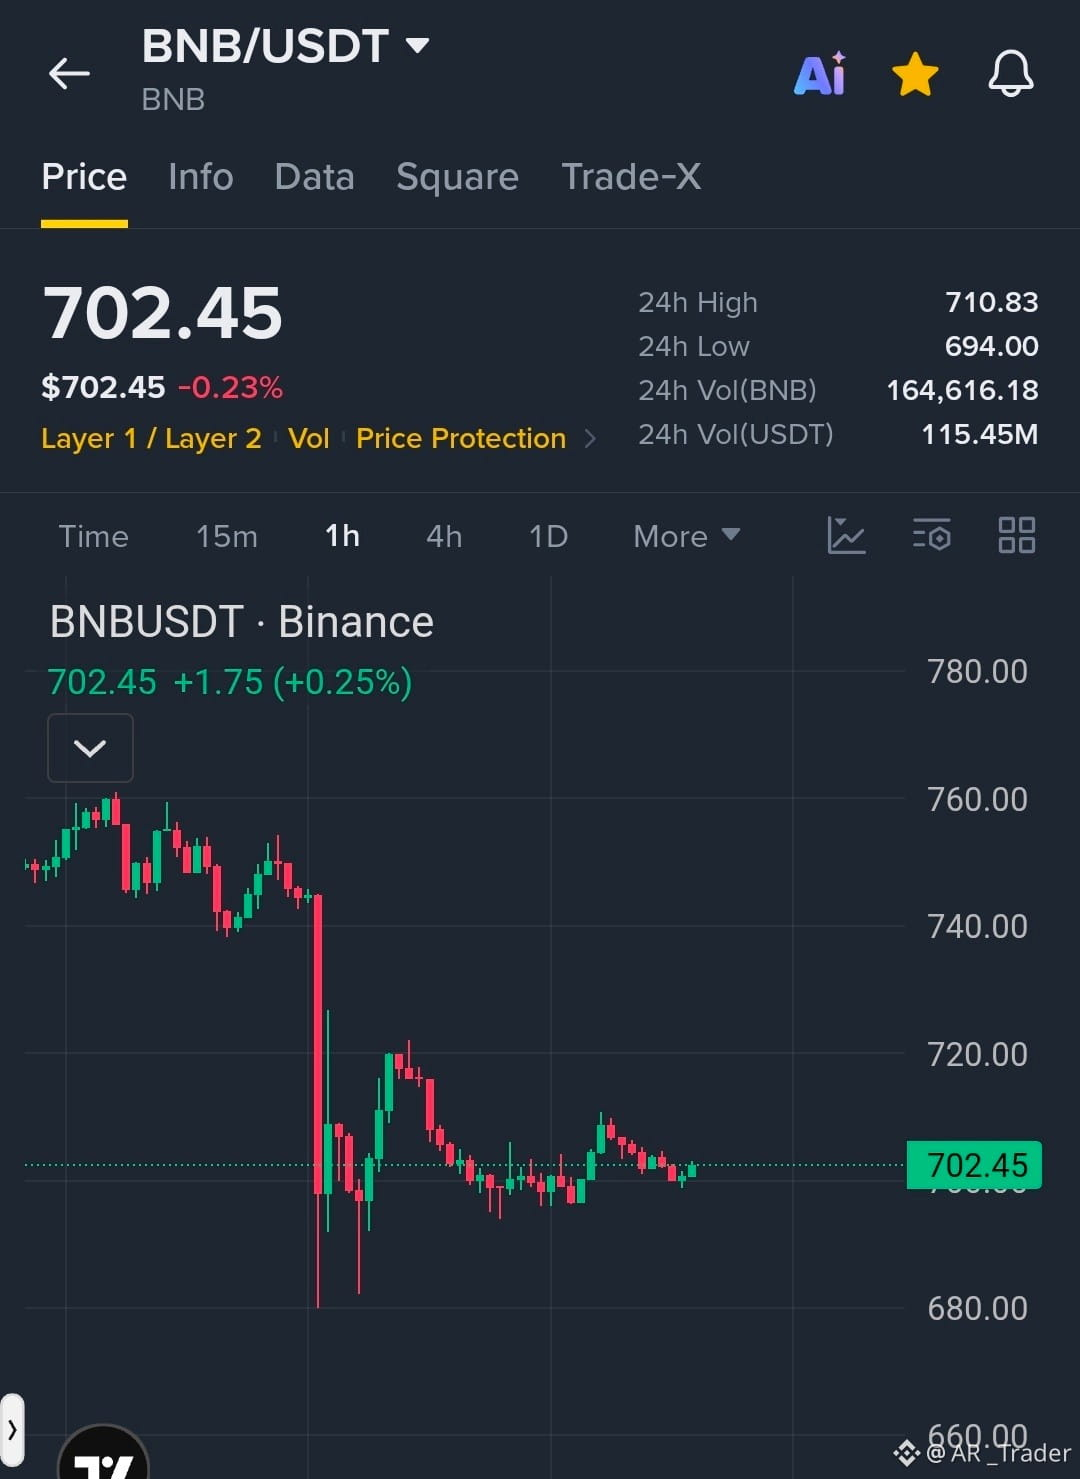
$BNB /USDT Builds a Base for a Potential Bullish Recovery
Trade Setup: LONG
Entry Zone: 700–704
TP1: 710
TP2: 718
TP3: 725
SL: 692
Market Setup: The 1-hour chart shows price consolidating near 702 after a sharp decline, with support forming around 695–698. A breakout above 705 could trigger a recovery toward higher resistance levels, while a move below 692 would invalidate the bullish setup.
Buy and trade $BNB
{future}(BNBUSDT)
.
$BNB /USDT Builds a Base for a Potential Bullish Recovery
Trade Setup: LONG
Entry Zone: 700–704
TP1: 710
TP2: 718
TP3: 725
SL: 692
Market Setup: The 1-hour chart shows price consolidating near 702 after a sharp decline, with support forming around 695–698. A breakout above 705 could trigger a recovery toward higher resistance levels, while a move below 692 would invalidate the bullish setup.
Buy and trade $BNB
.
Trade Setup: LONG
Entry Zone: 700–704
TP1: 710
TP2: 718
TP3: 725
SL: 692
Market Setup: The 1-hour chart shows price consolidating near 702 after a sharp decline, with support forming around 695–698. A breakout above 705 could trigger a recovery toward higher resistance levels, while a move below 692 would invalidate the bullish setup.
Buy and trade $BNB
.
2
54
·
--
Bullisch
Übersetzung ansehen
$BNB /USDT Builds a Base for a Potential Bullish Recovery
Trade Setup: LONG
Entry Zone: 700–704
TP1: 710
TP2: 718
TP3: 725
SL: 692
Market Setup: The 1-hour chart shows price consolidating near 702 after a sharp decline, with support forming around 695–698. A breakout above 705 could trigger a recovery toward higher resistance levels, while a move below 692 would invalidate the bullish setup.
Buy and trade $BNB .
$BNB /USDT Builds a Base for a Potential Bullish Recovery
Trade Setup: LONG
Entry Zone: 700–704
TP1: 710
TP2: 718
TP3: 725
SL: 692
Market Setup: The 1-hour chart shows price consolidating near 702 after a sharp decline, with support forming around 695–698. A breakout above 705 could trigger a recovery toward higher resistance levels, while a move below 692 would invalidate the bullish setup.
Buy and trade $BNB .
Trade Setup: LONG
Entry Zone: 700–704
TP1: 710
TP2: 718
TP3: 725
SL: 692
Market Setup: The 1-hour chart shows price consolidating near 702 after a sharp decline, with support forming around 695–698. A breakout above 705 could trigger a recovery toward higher resistance levels, while a move below 692 would invalidate the bullish setup.
Buy and trade $BNB .
2
20
·
--
Bullisch
Übersetzung ansehen
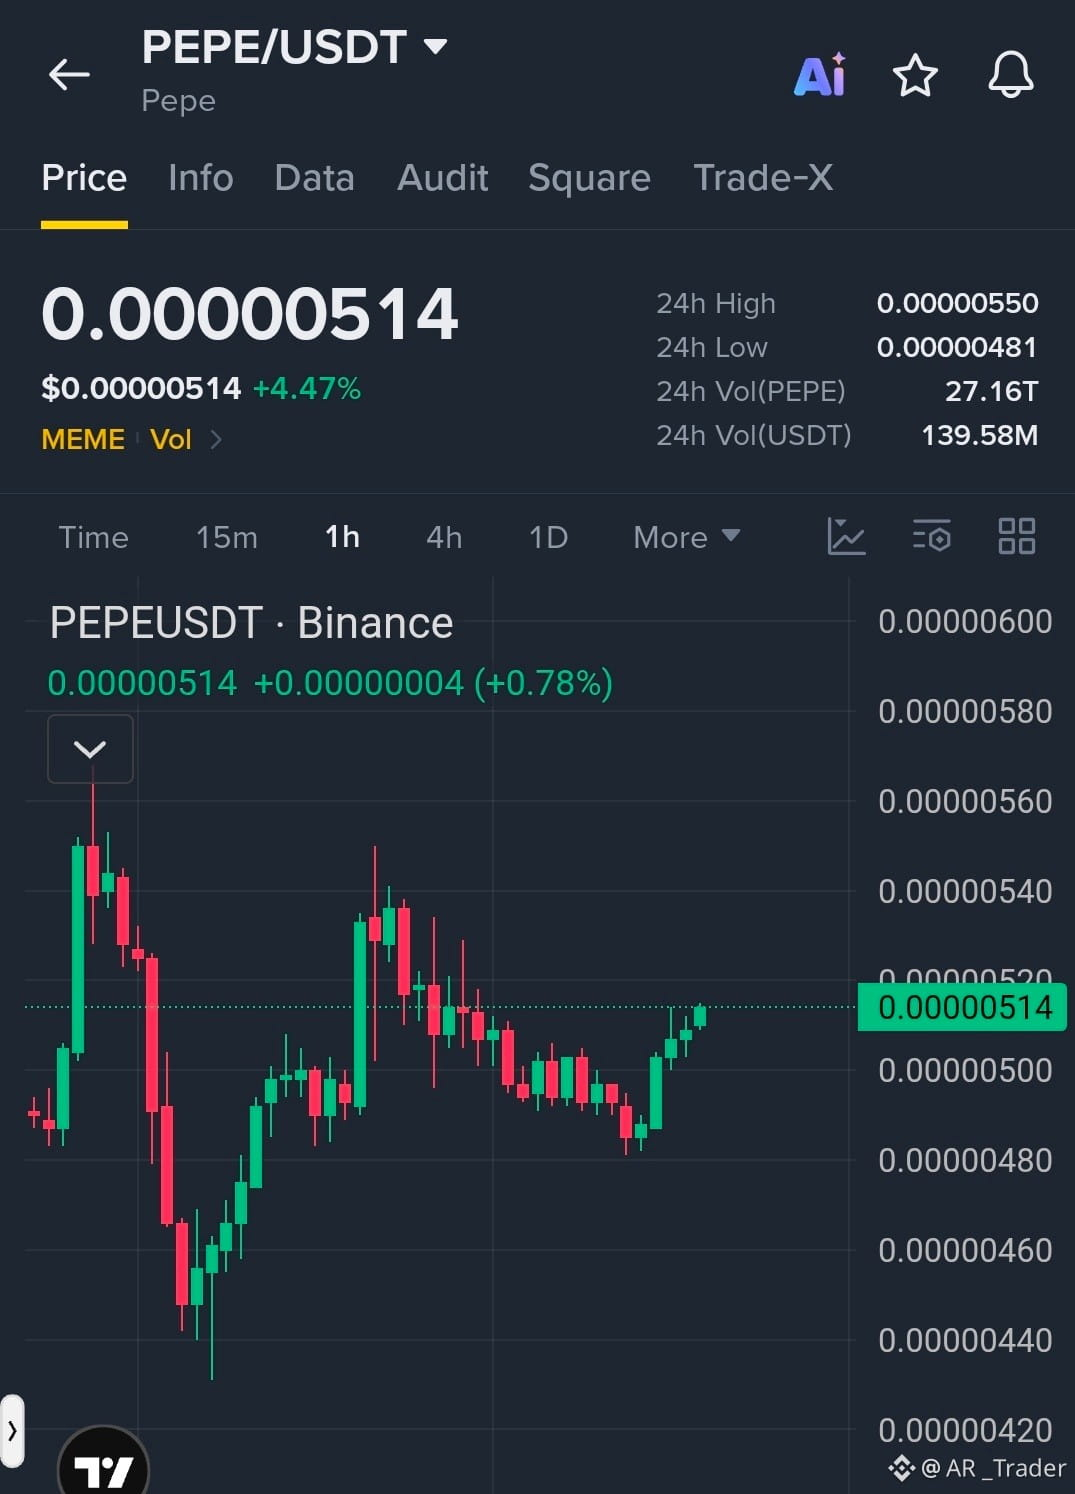
$PEPE /USDT Pushes Higher as Buyers Target the Next Resistance
Trade Setup: LONG
Entry Zone: 0.00000510–0.00000515
TP1: 0.00000525
TP2: 0.00000540
TP3: 0.00000555
SL: 0.00000490
Market Setup: The 1-hour chart shows a recovery from the 0.00000480 support area, with buyers building upward momentum. A breakout above 0.00000520 could open the way toward higher resistance, while a drop below 0.00000490 would weaken the bullish structure.
Buy and trade $PEPE .
{spot}(PEPEUSDT)
$PEPE /USDT Pushes Higher as Buyers Target the Next Resistance
Trade Setup: LONG
Entry Zone: 0.00000510–0.00000515
TP1: 0.00000525
TP2: 0.00000540
TP3: 0.00000555
SL: 0.00000490
Market Setup: The 1-hour chart shows a recovery from the 0.00000480 support area, with buyers building upward momentum. A breakout above 0.00000520 could open the way toward higher resistance, while a drop below 0.00000490 would weaken the bullish structure.
Buy and trade $PEPE .
Trade Setup: LONG
Entry Zone: 0.00000510–0.00000515
TP1: 0.00000525
TP2: 0.00000540
TP3: 0.00000555
SL: 0.00000490
Market Setup: The 1-hour chart shows a recovery from the 0.00000480 support area, with buyers building upward momentum. A breakout above 0.00000520 could open the way toward higher resistance, while a drop below 0.00000490 would weaken the bullish structure.
Buy and trade $PEPE .
2
54
·
--
Bullisch
Übersetzung ansehen
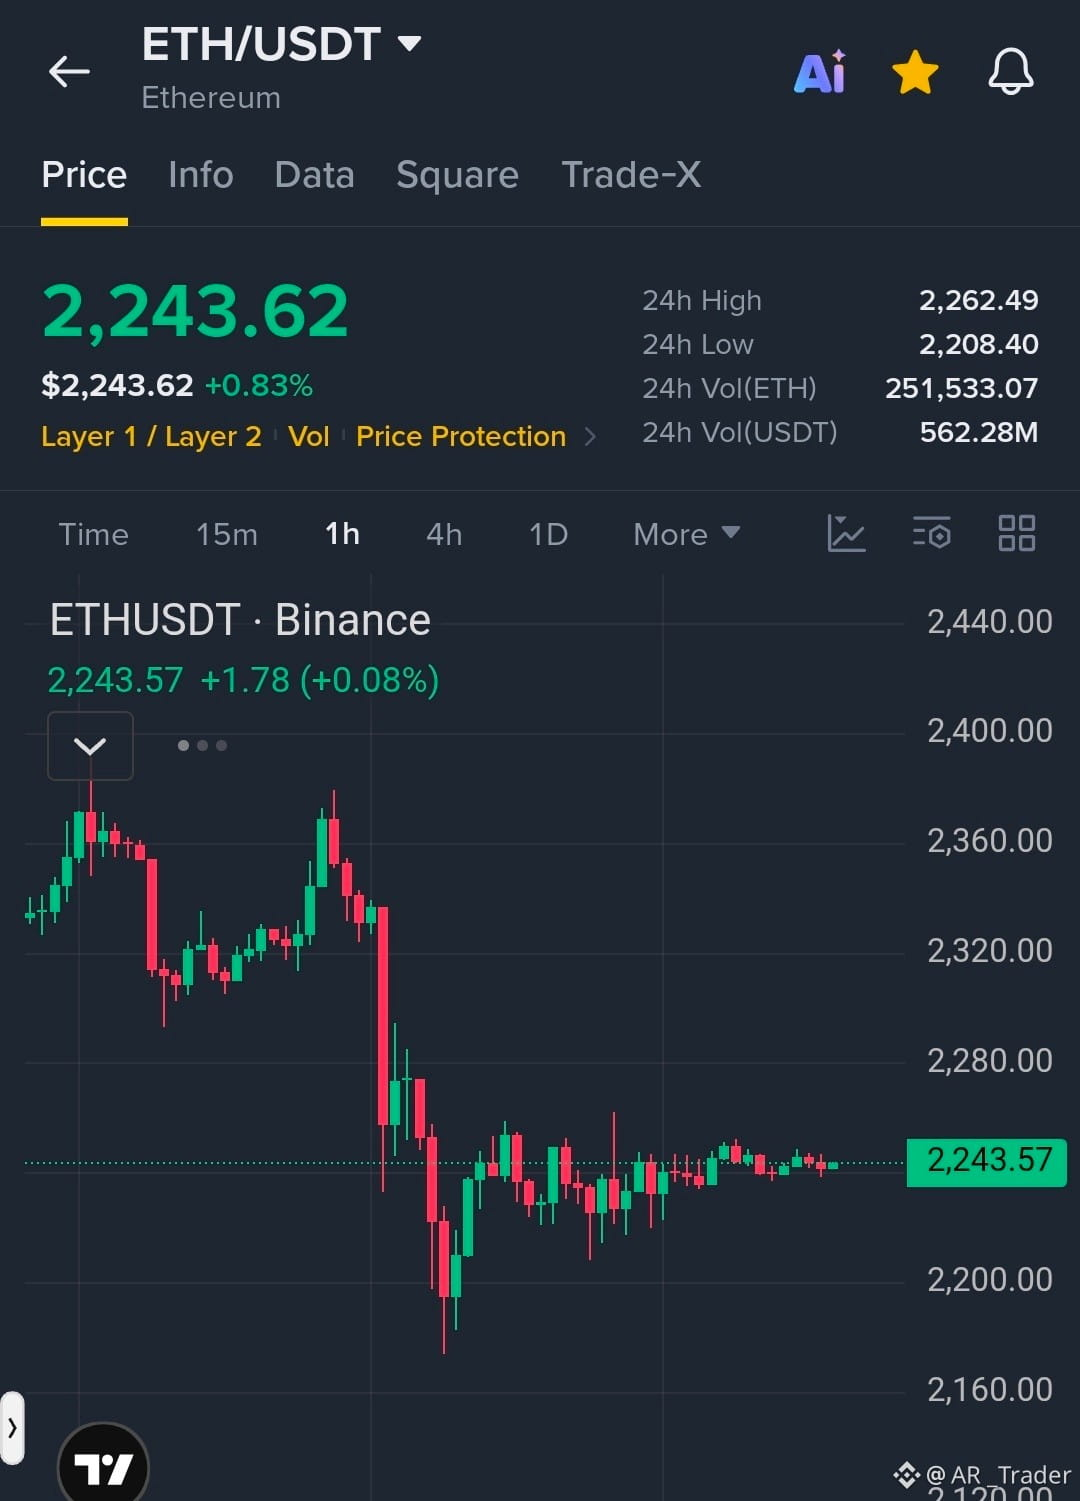
$ETH /USDT Holds Support as Buyers Prepare for a Recovery
Trade Setup: LONG
Entry Zone: 2,235–2,250
TP1: 2,265
TP2: 2,285
TP3: 2,310
SL: 2,215
Market Setup: Price is consolidating around 2,240 after a sharp decline, showing signs of stabilization. A breakout above 2,250 could strengthen bullish momentum toward the next resistance levels, while losing 2,215 would invalidate this setup.
Buy and trade $ETH .
{spot}(ETHUSDT)
$ETH /USDT Holds Support as Buyers Prepare for a Recovery
Trade Setup: LONG
Entry Zone: 2,235–2,250
TP1: 2,265
TP2: 2,285
TP3: 2,310
SL: 2,215
Market Setup: Price is consolidating around 2,240 after a sharp decline, showing signs of stabilization. A breakout above 2,250 could strengthen bullish momentum toward the next resistance levels, while losing 2,215 would invalidate this setup.
Buy and trade $ETH .
Trade Setup: LONG
Entry Zone: 2,235–2,250
TP1: 2,265
TP2: 2,285
TP3: 2,310
SL: 2,215
Market Setup: Price is consolidating around 2,240 after a sharp decline, showing signs of stabilization. A breakout above 2,250 could strengthen bullish momentum toward the next resistance levels, while losing 2,215 would invalidate this setup.
Buy and trade $ETH .
2
28
Anmelden und weiter Inhalte entdecken
Krypto-Nutzer weltweit auf Binance Square kennenlernen
⚡️ Bleib in Sachen Krypto stets am Puls.
💬 Die weltgrößte Kryptobörse vertraut darauf.
👍 Erhalte verlässliche Einblicke von verifizierten Creators.
E-Mail-Adresse/Telefonnummer
Trendthemen
BinanceSAFUFundTransferCompleted7499BTC
1,064 Aufrufe
111 Kommentare
#BinanceSAFUFundTransferCompleted7499BTC
🚨 Binance-SAFU-Update!
Binance hat im Rahmen der Umstrukturierung seines SAFU-Fonds eine bedeutende Überweisung von 7.499 BTC abgeschlossen.
Dieser Schritt könnte das Vertrauen des Marktes stärken und das Vertrauen in die finanzielle Sicherheit von Binance verbessern.
📈 Meine Prognose: BTC und BNB könnten in den nächsten 7–10 Tagen positive Impulse verzeichnen, sofern die Unterstützung am Markt anhält.
Der langfristige Ausblick bleibt optimistisch, doch die Marktbedingungen werden entscheidend sein.
Bleib informiert. Bleib SAFU. 🔥
#Binance #BTC #BNB #SAFU
Sagor Ahmed06
·0 Likes
·41 Aufrufe
BinanceRecovery90% of stolen assets
30,331 Aufrufe
88 Kommentare
YiHe:ProofOfReserves:10TokensAt100%Backing
68,319 Aufrufe
328 Kommentare