

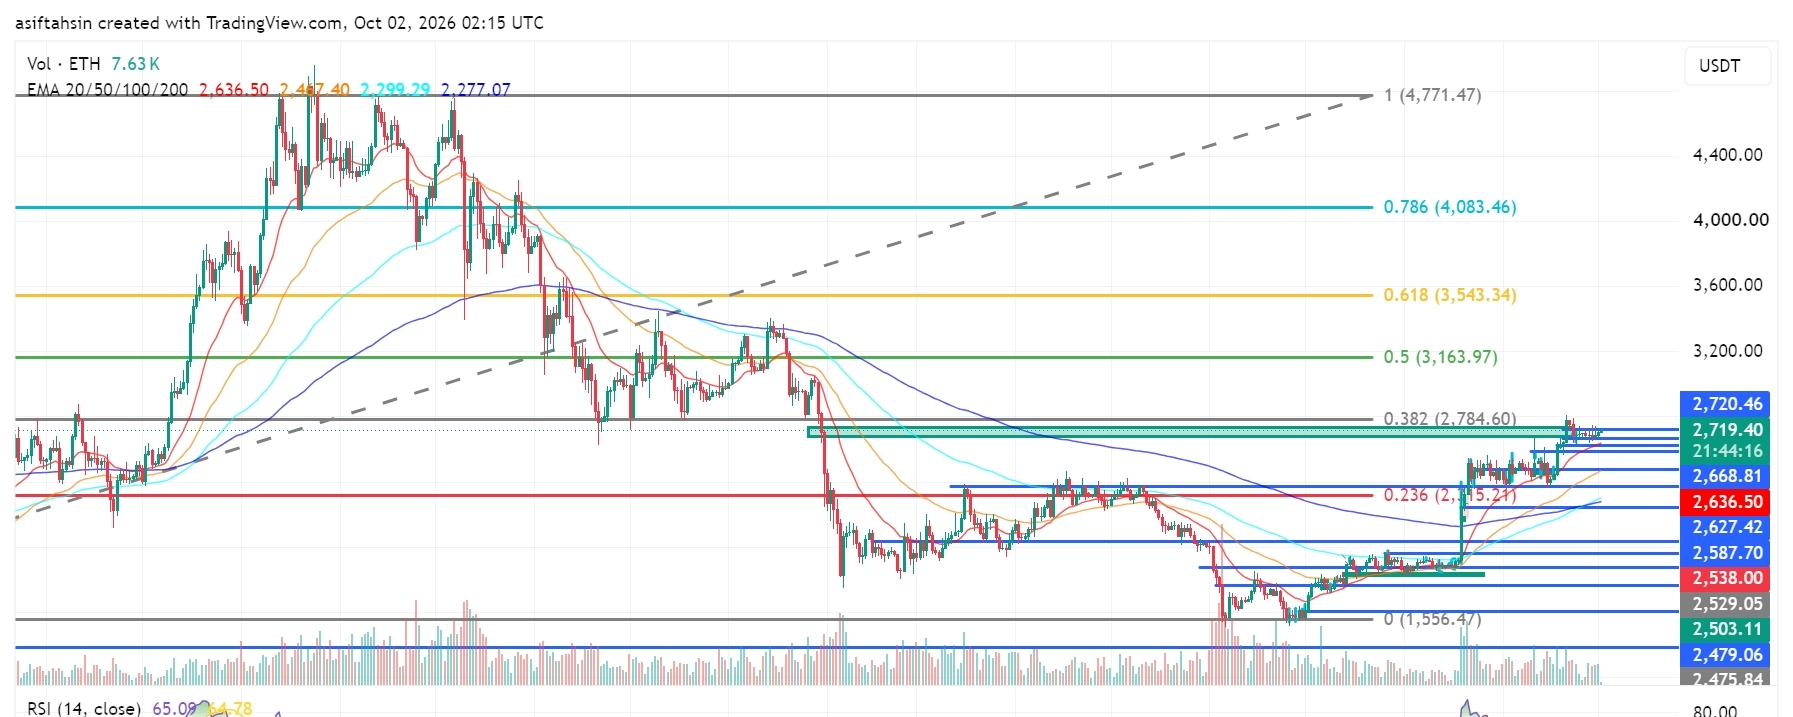

ETH is currently trading around $2,719.40, holding above the $2,668–$2,700 region after a strong recovery from the June low near $1,556.47.
The broader structure remains constructive, with ETH trading above all major EMAs and consolidating just below the $2,720–$2,784 resistance zone. A sustained breakout above this area would bring the higher Fibonacci levels into focus.
📈 EMA Structure
20 EMA: $2,636.50
50 EMA: $2,467.40
100 EMA: $2,299.29
200 EMA: $2,277.07
ETH is trading well above all four major EMAs.
The 20 EMA remains above the 50, 100 and 200 EMA, showing a strong short-to-medium-term recovery structure.
The $2,636–$2,668 region is now an important support area for maintaining the current momentum.
📐 Fibonacci Levels
0.236: $2,315.21
0.382: $2,784.60
0.5: $3,163.97
0.618: $3,543.34
0.786: $4,083.46
1.0: $4,771.47
ETH has moved significantly above the 0.236 Fibonacci level at $2,315.21 and is now approaching the 0.382 level at $2,784.60.
This is the key Fibonacci resistance for the current recovery.
🟢 Bullish Scenario
Immediate resistance is around $2,720.46, followed by the major $2,784.60 Fibonacci level.
A clean breakout and sustained close above $2,784.60 could open the path toward:
🎯 $3,163.97
🎯 $3,543.34
🎯 $4,083.46
🎯 $4,771.47
A successful breakout-retest of the $2,720–$2,785 region would strengthen the continuation structure.
🔴 Pullback Scenario
Key support levels:
$2,668.81
$2,636.50 — 20 EMA
$2,627.42
$2,587.70
$2,538.00
$2,529.05
$2,503.11
$2,479.06
$2,475.84
$2,467.40 — 50 EMA
$2,454.11
The $2,636–$2,668 zone is particularly important.
Holding above this region keeps the short-term recovery structure intact. A sustained break below $2,587–$2,538 would weaken the current structure and bring the lower EMA levels back into focus.
🧠 Market Structure & Liquidity
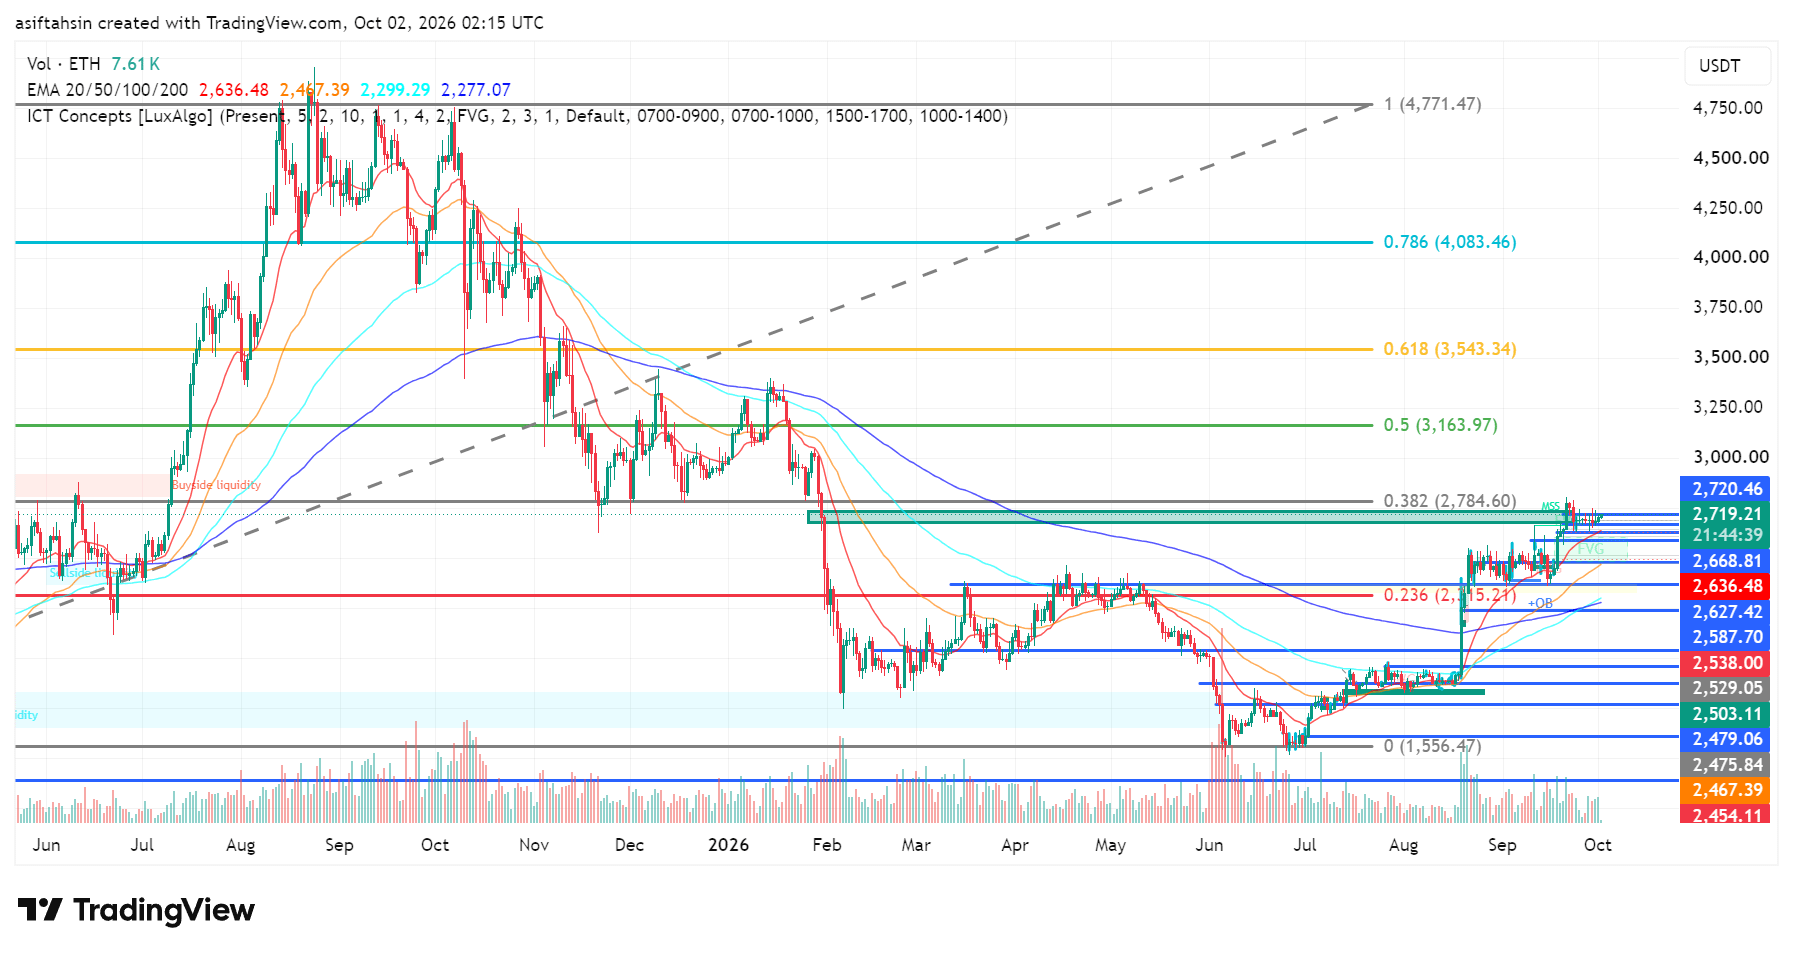
Liquidity Sweep → Accumulation → Higher Lows → Breakout → EMA Reclaim → Expansion → Retest → Consolidation → Continuation
ETH formed a major liquidity sweep around $1,556.47, followed by accumulation and a sequence of higher lows.
The breakout from the previous consolidation reclaimed the major EMA levels, and price has since expanded toward $2.7K.
The current consolidation just below $2,784.60 is the key decision area. A breakout could transition the current recovery into another expansion phase.
📊 RSI Momentum
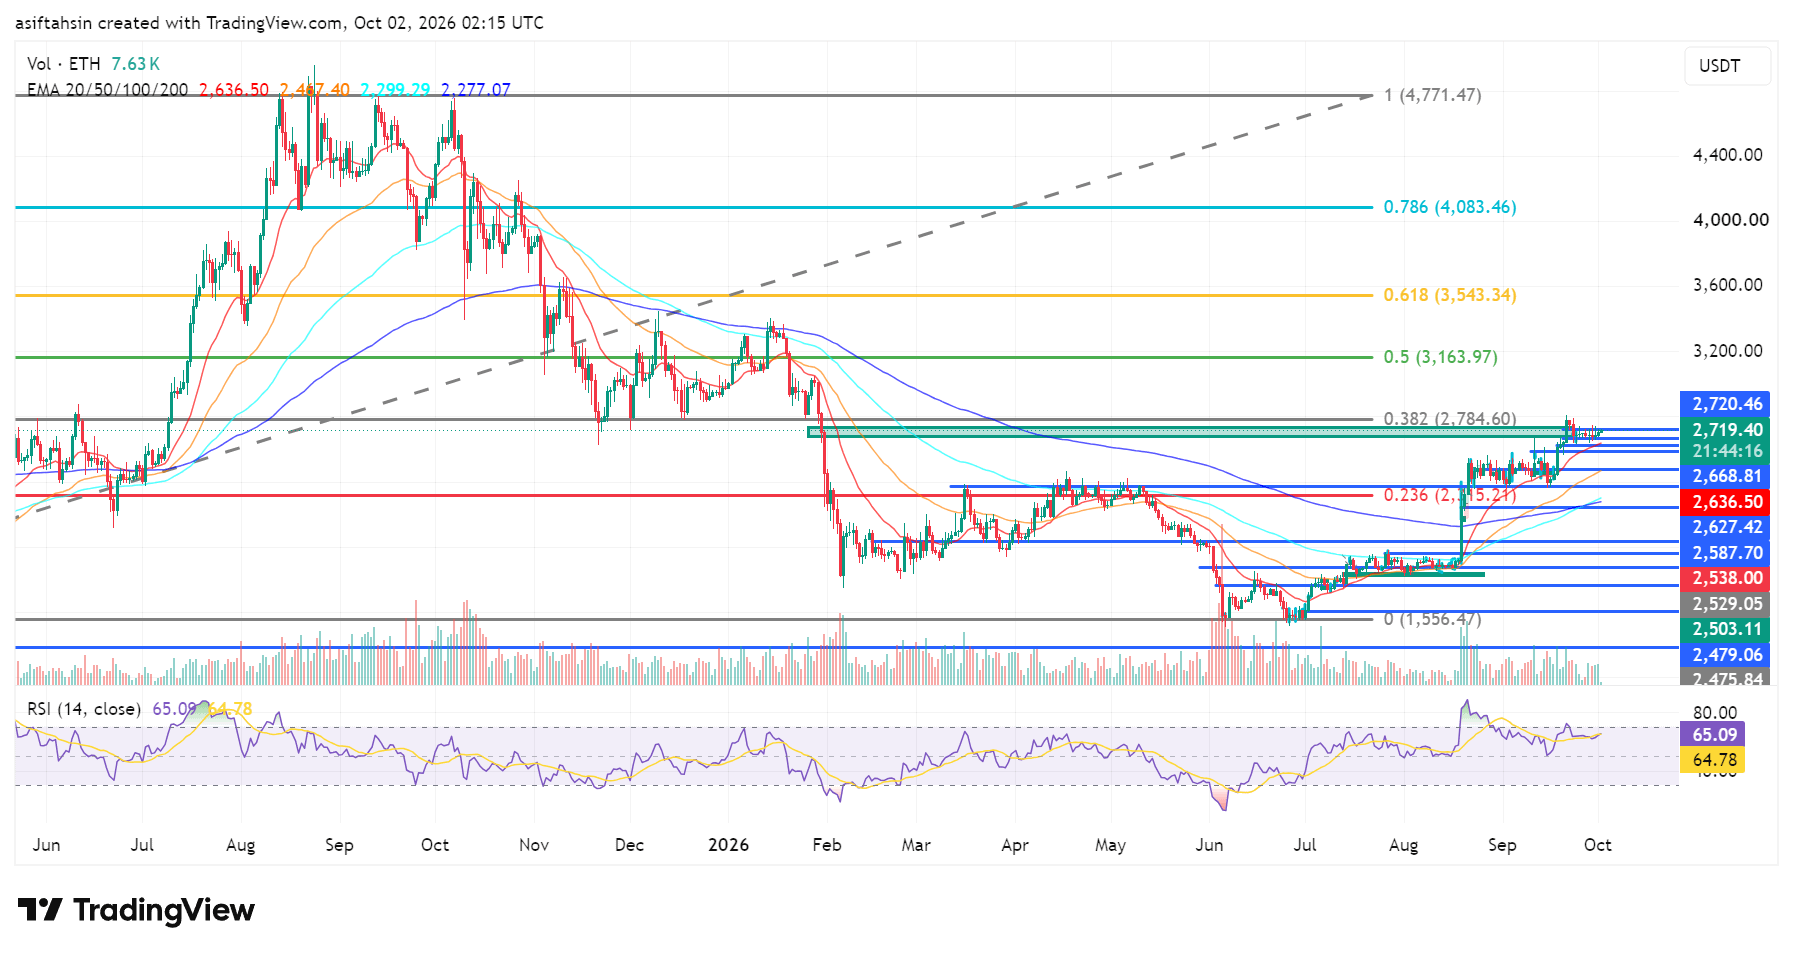
RSI: 65.09
RSI MA: 64.78
RSI remains above the 50 midpoint and is slightly above its moving average, showing that momentum remains positive.
The current reading is elevated but not yet at the extreme 70+ zone. A continued RSI hold above 60 while price challenges $2,784.60 would support the ongoing recovery structure.
🎯 Key Levels
Resistance:
$2,720.46 → $2,784.60 → $3,163.97 → $3,543.34 → $4,083.46
Support:
$2,668.81 → $2,636.50 → $2,627.42 → $2,587.70 → $2,538.00 → $2,529.05 → $2,503.11 → $2,479.06
Major EMA Support:
20 EMA: $2,636.50
50 EMA: $2,467.40
100 EMA: $2,299.29
200 EMA: $2,277.07
📌 Final Outlook
ETH's recovery structure remains constructive while price holds above the $2,636–$2,668 support region.
The immediate battle is between $2,720.46 resistance and the major $2,784.60 Fibonacci level.
A sustained breakout above $2,784.60 could open the path toward $3,163.97, $3,543.34 and $4,083.46.
On the downside, losing $2,636.50 would weaken short-term momentum, while a break below $2,587–$2,538 would signal a deeper pullback.
Bias: Recovery structure remains constructive above $2,636.50. Sustained strength above $2,784.60 could open the path toward $3,163.97, $3,543.34 and $4,083.46 next.
