$TAKE Institutional SMC/ICT Market Structure, Liquidity & Elliott Wave Outlook
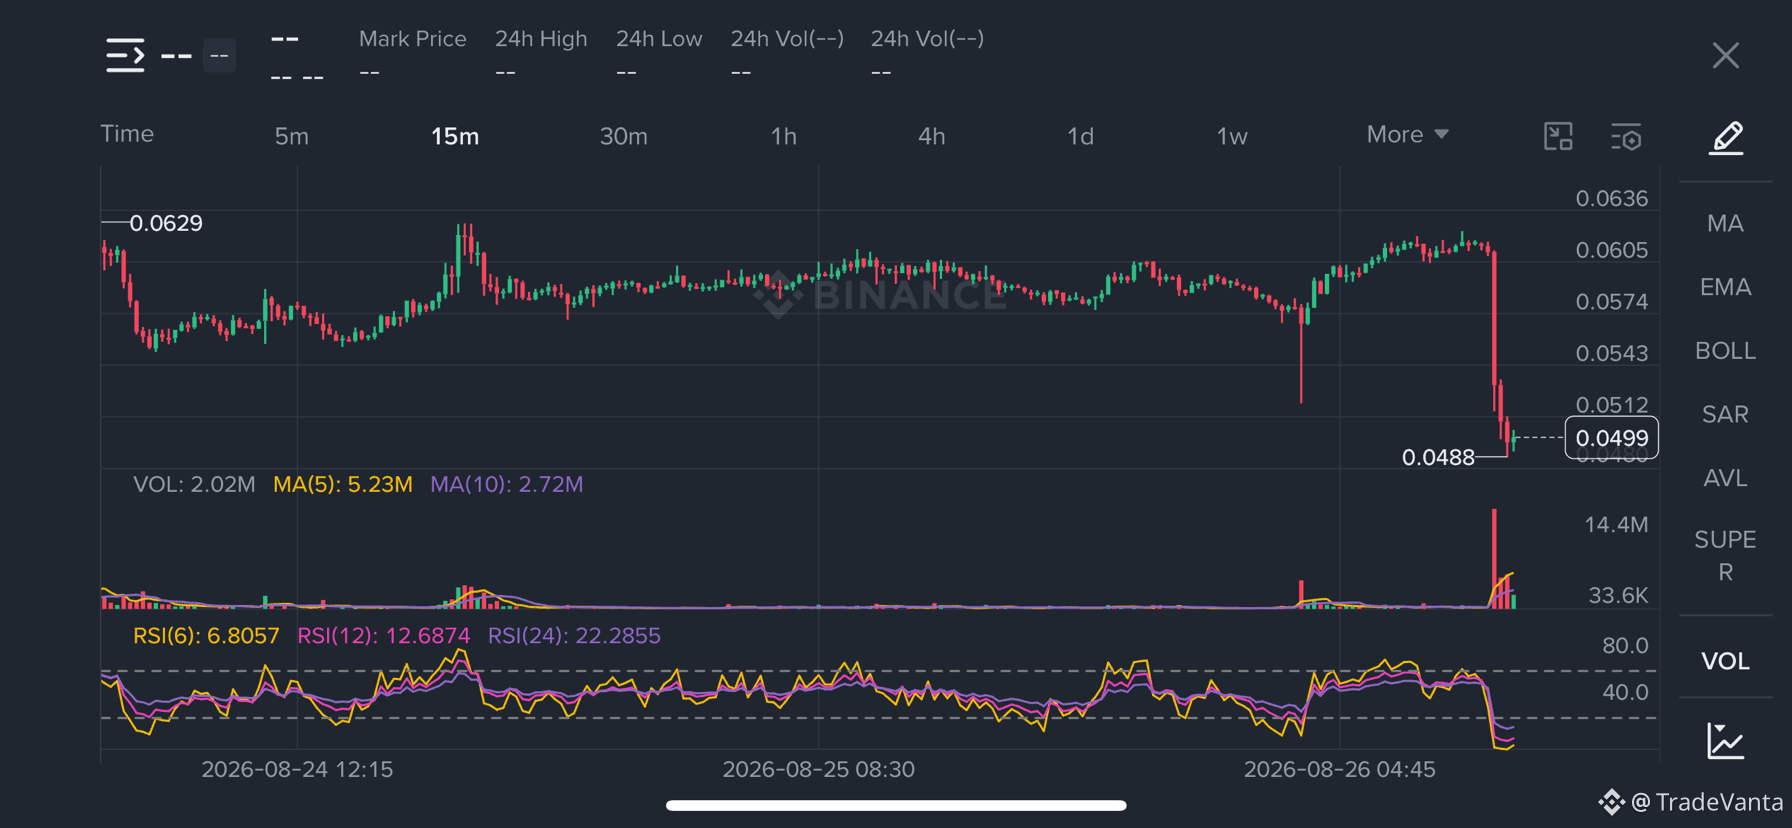
The current market structure remains cautious, with short-term bearish momentum developing after rejection from the 0.056–0.0605 region. On the 1H and 15m charts, price experienced strong bearish displacement toward approximately 0.0488–0.0500, breaking the preceding consolidation. This suggests bearish delivery toward sell-side liquidity, although a bullish MSS or CHoCH has not yet been confirmed.
From an ICT perspective, the 0.0488–0.0500 area represents important recent sell-side liquidity. Price has reacted from this zone, but the bounce lacks sufficient bullish displacement to confirm a liquidity-sweep reversal. Meanwhile, the broader 4H dealing range places current price in discount, making aggressive short entries less attractive.
Elliott Wave analysis favors a potential ABC corrective structure following the major advance toward 0.0794–0.0800. The decline toward 0.029–0.030 may represent Wave A, the recovery toward 0.056–0.057 Wave B, and the current decline potentially Wave C. However, this count remains probabilistic rather than confirmed.
The current market structure remains cautious, with short-term bearish momentum developing after rejection from the 0.056–0.0605 region. On the 1H and 15m charts, price experienced strong bearish displacement toward approximately 0.0488–0.0500, breaking the preceding consolidation. This suggests bearish delivery toward sell-side liquidity, although a bullish MSS or CHoCH has not yet been confirmed.
From an ICT perspective, the 0.0488–0.0500 area represents important recent sell-side liquidity. Price has reacted from this zone, but the bounce lacks sufficient bullish displacement to confirm a liquidity-sweep reversal. Meanwhile, the broader 4H dealing range places current price in discount, making aggressive short entries less attractive.
Elliott Wave analysis favors a potential ABC corrective structure following the major advance toward 0.0794–0.0800. The decline toward 0.029–0.030 may represent Wave A, the recovery toward 0.056–0.057 Wave B, and the current decline potentially Wave C. However, this count remains probabilistic rather than confirmed.