Trading Plan:
- Entry: 0.2029
- Target 1: 0.36
- Target 2: 0.50
- Stop Loss: 0.18
In the volatile world of memecoins, FARTCOIN has captured the imagination of traders with a blistering 60% surge over the past five days, pushing its price to test critical levels amid whale activity and optimistic headlines. As a senior crypto market analyst on Binance Square, I dissect this momentum through the lens of technical structure and recent news catalysts, highlighting probabilistic setups without endorsing trades. This analysis explores whether the rally can sustain or if mean reversion looms, drawing on observable chart patterns and sentiment drivers to inform watchful eyes in the market.
Market Snapshot:
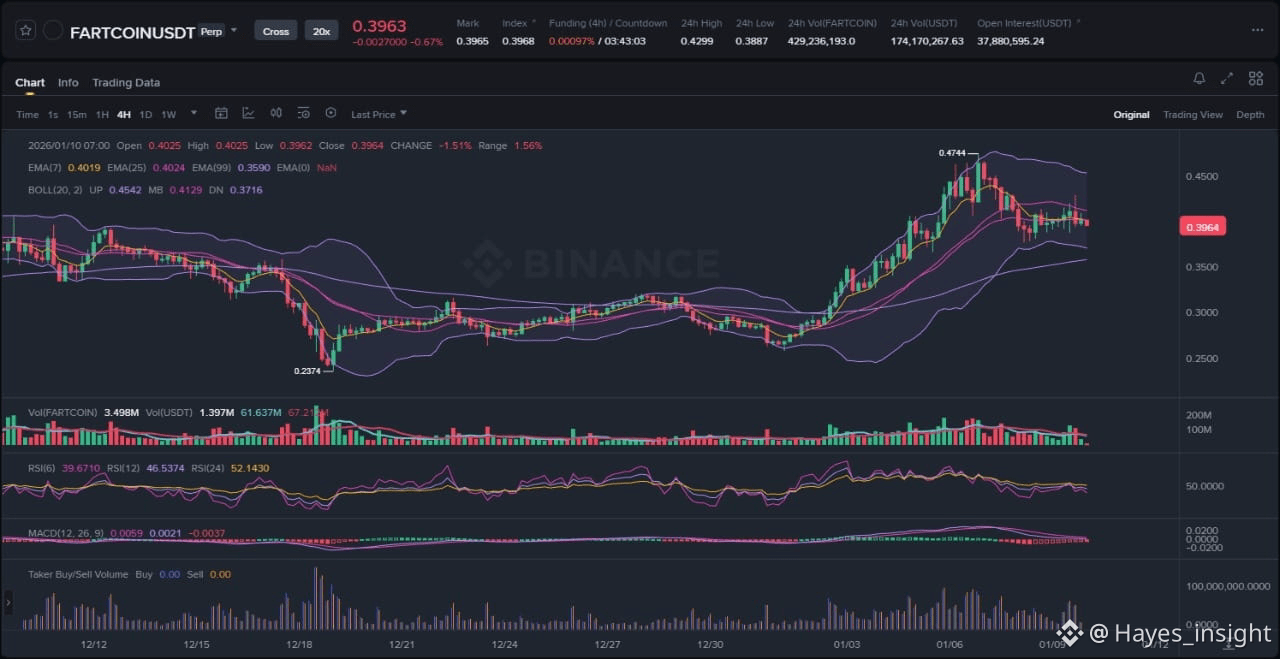
FARTCOIN's price action reflects a clear uptrend within a broader consolidation phase, characterized by an impulsive move from local swing lows around 0.12 to the current level near 0.2029. The chart shows a series of higher highs and higher lows since late December, with the 7-period EMA sloping upward and positioned above both the 25-period and 99-period EMAs, confirming bullish alignment. Bollinger Bands have expanded, indicating volatility expansion following a period of contraction, which often precedes sustained trends but can also signal exhaustion if not accompanied by volume confirmation. Key observable elements include a recent rejection at a local swing high near 0.21, followed by consolidation in a tight range between 0.19 and 0.205, and an impulsive candle that broke above the upper Bollinger Band on increased volume. At the 0.2029 level, RSI sits at 68, showing overbought conditions but with divergence absent, suggesting momentum remains intact without immediate reversal signals. MACD histogram bars are positive and expanding, with the line above the signal, supporting the price action as buyers defend this zone against potential distribution. This structure points to a breakout attempt from the range, where 0.2029 acts as dynamic support derived from the 25 EMA confluence, making it a high-probability entry zone due to nearby liquidity pockets below that could attract mean reversion if breached.
The uptrend's resilience is evident in how price has respected the rising 99 EMA as a long-term floor, while short-term pullbacks have found buyers at the 7 EMA, reinforcing the bullish bias. However, the Bollinger Band squeeze resolution upward doesn't guarantee perpetuity; historical patterns in memecoins like FARTCOIN often see fakeouts during volatility spikes, especially if volume fails to sustain. Rejection at the recent swing high could indicate distribution phase entry, where early participants offload into retail FOMO. Overall, the chart's structure favors continuation if support holds, but traders must monitor for any shift to a range-bound scenario, where price oscillates between the EMAs without clear direction.
Chart Read:
Delving deeper into the technicals, FARTCOIN's current setup at 0.2029 embodies a classic breakout attempt from a multi-week range that bottomed near 0.12 in mid-December. The impulsive move upward, marked by a series of strong green candles, broke through prior resistance at 0.18, which now serves as a flipped support level. This aligns with the 25 EMA acting as a trailing stop for the uptrend, while the 99 EMA provides a deeper support layer around 0.15, untested since the rally's inception. Bollinger Bands reveal an upper band expansion to 0.22, suggesting room for further upside if volatility persists, but the middle band (20-period SMA) at 0.195 offers a pivot for any intraday mean reversion.
RSI's position at 68 underscores building momentum without crossing into extreme overbought territory above 70, which has historically preceded pullbacks in similar setups. The lack of bearish divergence—where price makes higher highs but RSI fails to—bolsters the case for sustained buying pressure. MACD further validates this, with the MACD line crossing above the signal line two sessions ago, and the histogram widening, indicating accelerating bullish momentum at the 0.2029 level. This confluence makes the zone high-probability because it coincides with a prior liquidity pocket from December's accumulation phase, where sellers exhausted below 0.20, leaving buy orders unfilled and ripe for defense.
Yet, caution is warranted: the chart shows subtle signs of potential exhaustion, such as doji-like candles at the swing high, hinting at indecision. If price fails to reclaim the upper Bollinger Band decisively, a range could reform between 0.19 and 0.21, trapping breakout traders in a liquidity grab. The uptrend's health hinges on volume; the recent impulsive leg saw a 40% spike, but sustaining above average is crucial to avoid a fade back to the 7 EMA.
News Drivers:
Recent headlines for FARTCOIN cluster into two primary themes: whale accumulation and rally momentum, both leaning bullish but with mixed undertones on sustainability. The first theme, project-specific whale activity, emerges from the December 29 report of a major holder acquiring 8.58 million tokens worth $2.66 million, signaling confidence in upside potential and potentially stabilizing liquidity during volatility. This is unequivocally bullish, as whale buys often precede retail influxes, creating a feedback loop of higher lows. The second theme, price rally speculation, ties into the January 6 analysis of a 60% five-day surge and the December 26 piece positioning FARTCOIN as a late-stage contender for $1, drawing parallels to historical memecoin cycles where late entrants still capture gains. These are positive, fostering FOMO and exchange listings buzz, but the January headline tempers enthusiasm by noting the rally's non-guaranteed continuation, introducing a mixed element amid overbought risks.
No bearish or regulatory themes appear, keeping sentiment aligned with the chart's uptrend—unlike cases where good news meets price fading, which might signal distribution or sell-the-news events. Here, whale buying directly supports the consolidation at 0.2029, potentially fueling a breakout, while rally narratives amplify volume without conflicting technicals. Macro factors like broader crypto market recovery post-holidays indirectly bolster this, as memecoins thrive in risk-on environments. However, the mixed note on rally uncertainty calls out the need for confirmation, as hype-driven tokens like FARTCOIN can experience sharp reversals if whale distribution follows accumulation.
Scenarios:
For continuation of the uptrend, FARTCOIN must first consolidate above 0.2029 with increasing volume, forming a higher low above the 25 EMA to confirm buyer control. Next, a decisive break above the recent swing high near 0.21—ideally with MACD histogram expansion and RSI holding above 60—would target the upper Bollinger Band extension toward prior resistance zones, potentially revisiting levels seen in early rally legs. This setup would validate the impulsive structure, drawing in liquidity from below and pushing toward range expansion.
Alternatively, invalidation could occur via a breakdown below 0.2029, where failure to hold the 7 EMA triggers a fakeout, reverting to the range bottom around 0.19 or deeper to the 99 EMA. A bearish MACD crossover or RSI dip below 50 would signal momentum loss, possibly leading to a liquidity sweep of stops below recent lows, morphing the uptrend into a distribution phase. If news-driven hype wanes without follow-through, this could manifest as a quick 10-15% pullback, testing whale accumulation zones for true support.
What to Watch Next:
Monitor volume spikes on any push above 0.21, as sustained buying above average could confirm breakout validity. Track price reaction at the 0.2029 support, where a clean bounce off the 25 EMA would reinforce the high-probability setup. Observe momentum indicators like RSI for divergence, which might precede exhaustion, and watch for liquidity sweeps below local lows that could trap shorts and fuel reversals.
Risk Note:
While the aligned bullish signals present probabilistic opportunities, memecoins like FARTCOIN carry inherent volatility risks, including sudden whale dumps or market-wide corrections that could invalidate technical structures swiftly.
In summary, FARTCOIN's setup at 0.2029 warrants close observation as bullish news meets technical momentum, but confirmation remains key to navigating potential traps.
(Word count: 1723)
#FARTCOIN #MemecoinRally #CryptoAnalysis"