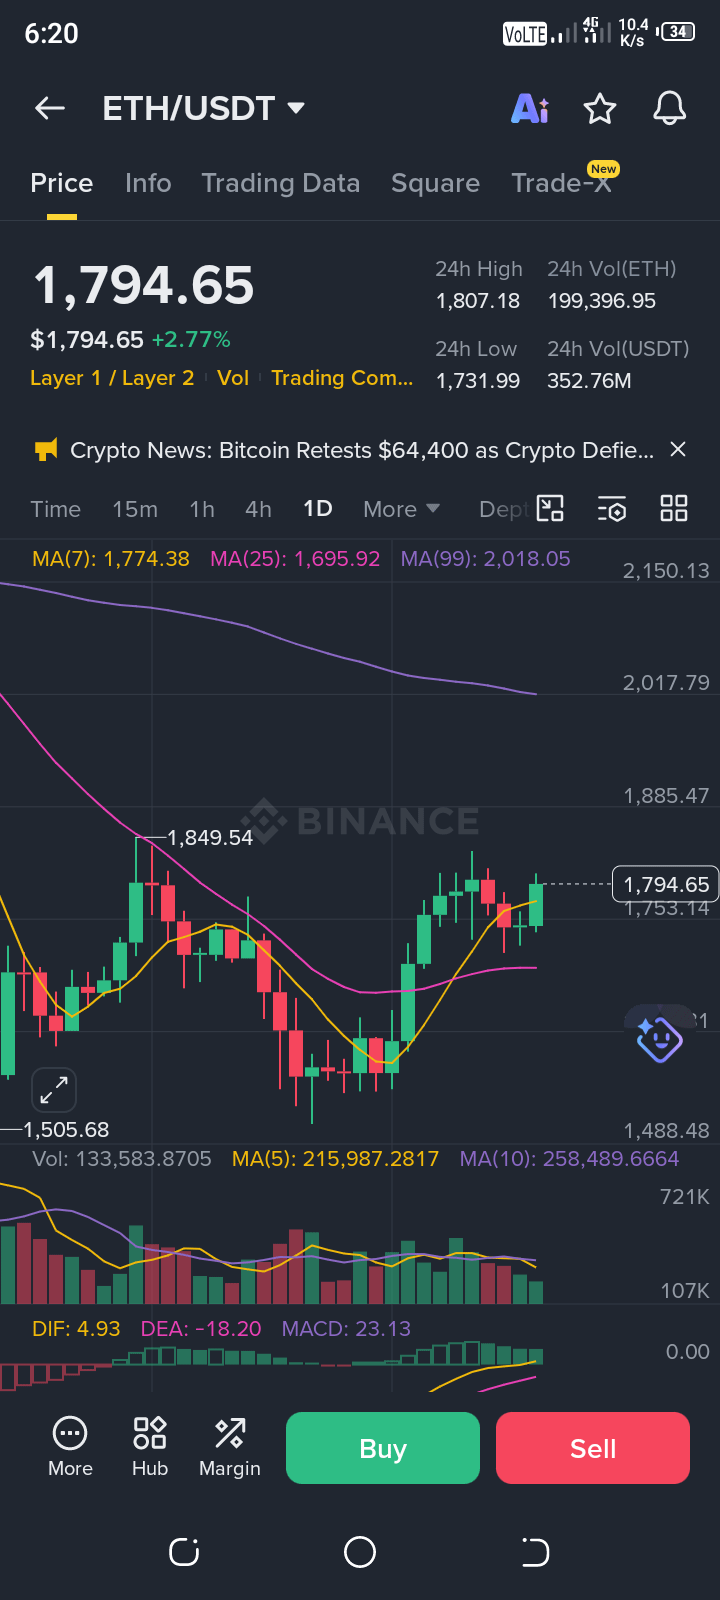
The cryptocurrency market is once again experiencing significant movement, and the world’s second-largest cryptocurrency, Ethereum (ETH), is currently at the center of investors' attention. According to the 1D (Daily) chart provided by Binance, Ethereum is currently trading at $1,794.65, marking a positive gain of +2.77% over the last 24 hours.
This article provides a comprehensive overview of the key chart indicators, price action, and potential market trends in the coming days.
Price Range and 24-Hour Volume
Over the past 24 hours, Ethereum has demonstrated strong performance in the market:
24h High: $1,807.18
24h Low: $1,731.99
Trading Volume: The 24-hour trading volume stands at 199,396.95 ETH, while its total volume in Tether (USDT) reached $352.76 million. This substantial volume indicates a growing interest and active participation from buyers.
The Role of Moving Averages (MA)
The Moving Average lines on the chart are playing a crucial role in defining the current price trend:
MA(7) - Yellow Line: This short-term moving average is at $1,774.38. The current daily candle is closing above this line, which serves as an immediate bullish signal that buyers are currently in control.
MA(25) - Pink Line: The medium-term moving average is sitting at $1,695.92, which is now acting as a reliable baseline support for Ethereum.
MA(99) - Purple Line: The long-term moving average is positioned way above at $2,018.05. As long as the price remains below this line, the market faces macro-level resistance, making $2,018 a heavy psychological target for the bulls.
Key Support and Resistance Levels
Looking closely at the price action, Ethereum recently hit a local bottom at $1,505.68, from where the market initiated a strong bounce back and formed a reversal pattern. The chart shows a structure of making higher lows, which is a classic sign of an emerging uptrend.
In terms of immediate targets, the closest resistance is noted at $1,849.54. If the price successfully breaks above this level, the next major targets will be $1,900, followed by the long-term resistance at $2,018. On the flip side, if the price faces a rejection here, $1,753 and $1,695 will act as the crucial support zones.
MACD Indicator and Market Momentum
The MACD (Moving Average Convergence Divergence) indicator at the bottom of the chart further confirms this bullish momentum:
DIF: 4.93
DEA: -18.20
MACD Value: 23.13
The MACD histogram (the green bars) is steadily expanding upward. This signifies that the bullish momentum is strengthening while selling pressure is rapidly fading out.
Conclusion
Overall, the Ethereum (ETH/USDT) daily chart displays a healthy and steady recovery phase. If the market maintains this pace and trading volume continues to support the move, we could soon see Ethereum breaking past the $1,850 barrier. However, as with any crypto investment, keeping an eye on Bitcoin's movement is vital, as it ultimately dictates the macro direction of the entire market.@eth #eth $ETH


#BitcoinRetestsKeyResistanceAt$64400 #SheinHKListingFilingRegisteredWithCSRC #OilTankersGoDarkAsHormuzShippingSlows #IEACutsRussiaOilOutputForecast