As of June 7, 2026, the cryptocurrency market is facing one of its most severe downturns in recent memory, with liquidations surpassing $1.5 billion and total market cap falling below the $2.2 trillion threshold. The extreme contraction has drawn comparisons to the 2022 bear market, characterized by risk-off sentiment, institutional outflows, and geopolitical uncertainty.
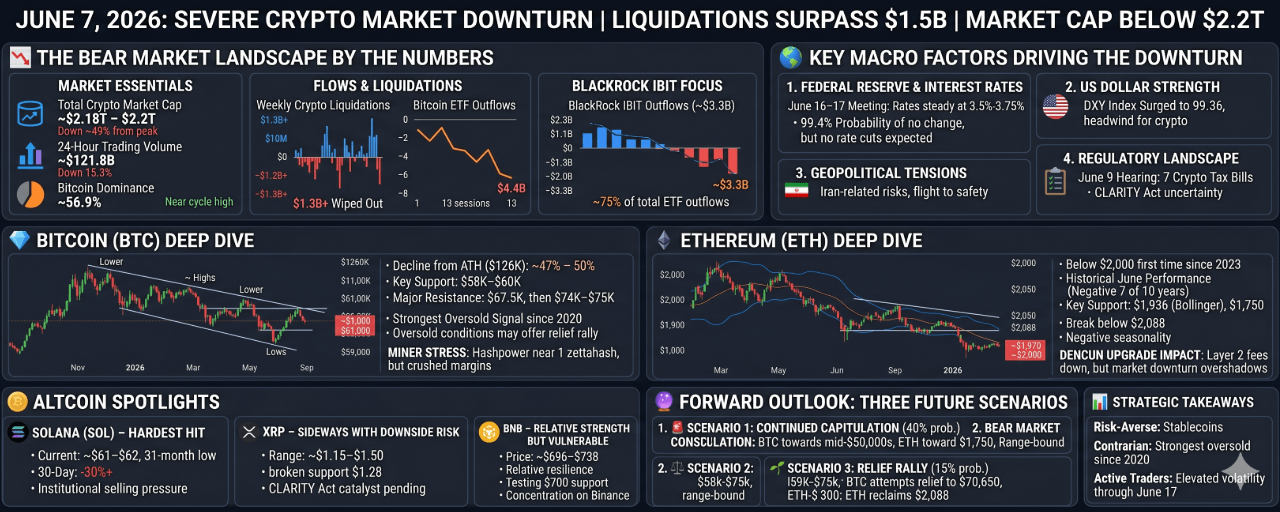
📉 The Bear Market Landscape by the Numbers
Metric Value Change / Context Total Crypto Market Cap ~$2.18T – $2.2T Down ~49% from $4.28T peak 24-Hour Trading Volume ~$121.8B Down 15.3% from previous day Bitcoin Dominance ~56.9% Near all-time highs for this cycle Weekly Crypto Liquidations $1.3B+ Wiped out in margin calls Bitcoin ETF Outflows (13 days) ~$4.4B total Largest sustained outflow streak on record BlackRock IBIT Outflow ~$3.3B Represented ~75% of total ETF outflows
🌍 Key Macro Factors Driving the Downturn
1. Federal Reserve and Interest Rates
The June FOMC meeting (June 16–17, 2026) is almost certain to hold rates steady at 3.5%-3.75%, with CME's FedWatch tool showing 99.4% probability of no change. However, stronger-than-expected jobs data has pushed back any expectation of rate cuts, with some analysts now warning that a hike before year-end cannot be ruled out. This hawkish tilt makes holding non-yielding risk assets like crypto significantly less attractive.
2. US Dollar Strength
The US Dollar Index (DXY) surged 15 points to 99.36 after the jobs report, a classic headwind for crypto assets. A stronger dollar pressures risk assets globally, making cross-border capital flows into crypto more expensive and challenging for DeFi activity and exchange volumes.
3. Geopolitical Tensions
Ongoing Iran-related geopolitical risks have fueled a flight to safety. Combined with broader concerns about global economic stability, investors have rotated out of speculative digital assets and into traditional havens like gold and the dollar.
4. Regulatory Landscape
A major regulatory hearing scheduled for June 9, 2026, where the House Ways and Means Committee will review seven crypto tax bills, has introduced significant policy uncertainty. While the CLARITY Act has cleared committee and enjoys bipartisan support, the threat of tighter tax reporting and capital gains treatment has unnerved many participants.
5. Institutional Sentiment Collapse
The 13 consecutive days of ETF outflows—totaling $4.4 billion—represents the most sustained withdrawal of institutional capital since spot ETFs launched. BlackRock's own ETF posted a single $33M inflow day followed by a $213M outflow, reflecting extreme indecision and a lack of conviction among even the largest players.
💎 Bitcoin (BTC) Deep Dive
Metric Current Status Current Price ~$59,000 – $61,000 range Decline from ATH ($126K) ~47% – 50% Key Support Level $58,000 – $60,000 zone Major Resistance $67,500, then $74,000–$75,000 ETF Outflow Streak 13 consecutive sessions, $4.4B total
Technical Picture
Bitcoin has formed consecutive lower highs (from $77,300 on May 26 to $61,780 on June 7) and lower lows (from $75,000 to $61,561), establishing a clear downtrend. The asset is now testing a critical multi-year support zone around $58,000–$60,000.
Oversold Conditions
Despite the brutal price action, Bitcoin has posted its strongest oversold signal since 2020. Technical oscillators at historically depressed levels suggest that while the trend remains bearish, a relief rally toward $70,650 (20-day EMA) is possible if $58,000–$60,000 support holds. However, if $60,000 breaks decisively, the next major support sits in the mid-$50,000s.
Miner Stress
Bitcoin mining difficulty has reached new all-time highs near 138.96 trillion, with hashpower near one zettahash per second. However, margins are being crushed as the price halved from highs, forcing some operators to sell holdings to cover operational costs—adding further sell pressure to the market.
⚡ Ethereum (ETH) Deep Dive
Metric Current Status Current Price ~$1,970 – $2,000 range June 1 Opening Below $2,000 for first time since 2023 Historical June Performance Negative in 7 of last 10 years Key Support $1,936 (Bollinger lower), $1,750 (major) Key Resistance $2,050, then $2,088
Technical Picture
Ethereum has broken below the critical $2,088 mark and is now printing lower highs and lower lows, with RSI approaching oversold territory (~39). The daily Bollinger Band lower boundary sits at $1,936, and a weekly close below that opens the monthly CRT range low at $1,750 as the primary June target.
Seasonal Headwinds
Ethereum faces significant seasonal pressure in June, which has concluded negatively in seven of the past ten years, with losses varying between 1.5% and 45%. This historical pattern compounds the current technical weakness.
Dencun Upgrade Impact
The 2024 Dencun upgrade (EIP-4844) has successfully reduced Layer 2 fees, but the broader market downturn has overshadowed any fundamental improvements, as blob transactions remain a small fraction of overall activity.
🪙 Altcoin Spotlights
Solana (SOL) – HARDEST HIT
Metric Status Current Price ~$61 – $62 (31-month low) 30-Day Decline -30%+ Year-to-Date Decline ~50% All-Time High (2021) ~$260
SOL hit a 31-month low of $61 on June 7, 2026, as institutional selling pressure mounted. The token has lost roughly 24% over the past week alone and faces the prospect of a slide toward $50 if selling accelerates. SOL ETFs have posted negative net inflows for two consecutive days, reflecting waning institutional conviction. Despite record-breaking eight straight monthly losses, the token continues to trade at levels that would have looked bullish a year ago—underscoring just how dramatically sentiment has shifted.
XRP – SIDEWAYS WITH DOWNSIDE RISK
Metric Status Current Range ~$1.15 – $1.50 Broken Support $1.28 (lost decisively) Bollinger Lower Band $1.1810
XRP has broken through the $1.28 support level, falling to as low as $1.15 on June 4. The price is now pressing against the lower Bollinger Band at $1.1810, with historical seasonality showing an average June decline of 4.87% and a median drop of 8.20%. XRP ETFs posted their first net outflow of June on June 3 ($5.34 million), adding to the pressure. The CLARITY Act vote offers a potential catalyst, but until regulatory clarity emerges, the most likely scenario remains sideways consolidation between $1.26 and $1.50.
BNB – RELATIVE STRENGTH BUT VULNERABLE
Metric Status Current Price ~$696 – $738 Key Support ~$700 200 EMA Resistance ~$738 Binance OI Concentration $628M (dominant venue)
BNB has shown relative resilience, briefly surging above $700 following Binance's bStocks launch on BNB Chain and expectations of traditional stock trading integration. However, the token has pulled back from its weekend short squeeze above $740, now testing the critical $700 support. With over $628 million in open interest concentrated on Binance—far exceeding competitors—liquidations on the exchange could trigger cascading sell-offs. Technicals remain bearish, with the 5-day and 50-day moving averages both suggesting "Sell".
🔮 Forward Outlook: Three Future Scenarios
🚨 Scenario 1: Continued Capitulation (40% probability)
If $58,000–$60,000 fails as support for Bitcoin, the next major level sits in the mid-$50,000s. Ethereum could drop toward $1,750, and Solana may test $50. This outcome would likely be triggered by one or more of:
A hawkish surprise from the June 16–17 FOMC meeting
Further escalation in Iran-related geopolitical tensions
Another $1B+ weekly ETF outflow
Negative resolution of key regulatory hearings (June 9)
⚖️ Scenario 2: Bear Market Consolidation (45% probability)
The most likely outcome based on current data. Bitcoin oscillates between $58,000 and $75,000 for weeks or months. Ethereum remains range-bound between $1,750 and $2,200, while XRP continues its sideways drift between $1.15 and $1.50. This scenario would require:
No major negative surprises from the June 16–17 FOMC (rates unchanged as expected)
Successful navigation of the June 9 tax hearing without radical changes
Stabilization of ETF outflows (less than $500M weekly)
Steady but unspectacular stablecoin supply growth near $320B total market cap
🌱 Scenario 3: Relief Rally (15% probability)
Bitcoin could attempt a relief rally toward $70,650 (20-day EMA) or even reclaim $74,000–$75,000 if short-term support holds. Ethereum would need to reclaim $2,088 to improve its setup. This optimistic scenario would require:
Positive crypto tax outcomes from the June 9 hearing
CLARITY Act passage signaling clear US regulatory framework
Unexpected dovish pivot from the Fed
Sustained ETF inflows reversing the 13-day negative streak
📊 Strategic Takeaways
For Risk-Averse Investors:
Consider stablecoins (USDT $186.8B market cap, USDC $76.3B) as a safe haven
Wait for confirmed support breaks or clear macro signals before deploying capital
Monitor June 9 tax hearing and June 16–17 FOMC as key binary events
For Contrarian / Long-Term Oriented:
This is Bitcoin's strongest oversold signal since 2020
The total stablecoin market cap exceeding $320 billion represents significant dry powder waiting on the sidelines
Regulatory clarity via CLARITY Act or GENIUS Act could spark a sharp recovery
For Active Traders:
Expect elevated volatility through at least June 17 (post-FOMC)
Key levels to watch: BTC $58,000 support / $60,000 psychological; ETH $1,936 Bollinger band / $1,750 major; XRP $1.15 support
Position sizes should reflect unusually high uncertainty
The crypto market is at a pivotal juncture, caught between historically oversold technical conditions and some of the most challenging macro headwinds since 2022. The next two weeks—spanning the June 9 tax hearing and June 16–17 FOMC meeting—will likely determine whether the market finds a bottom or continues its descent into deeper bear territory.