
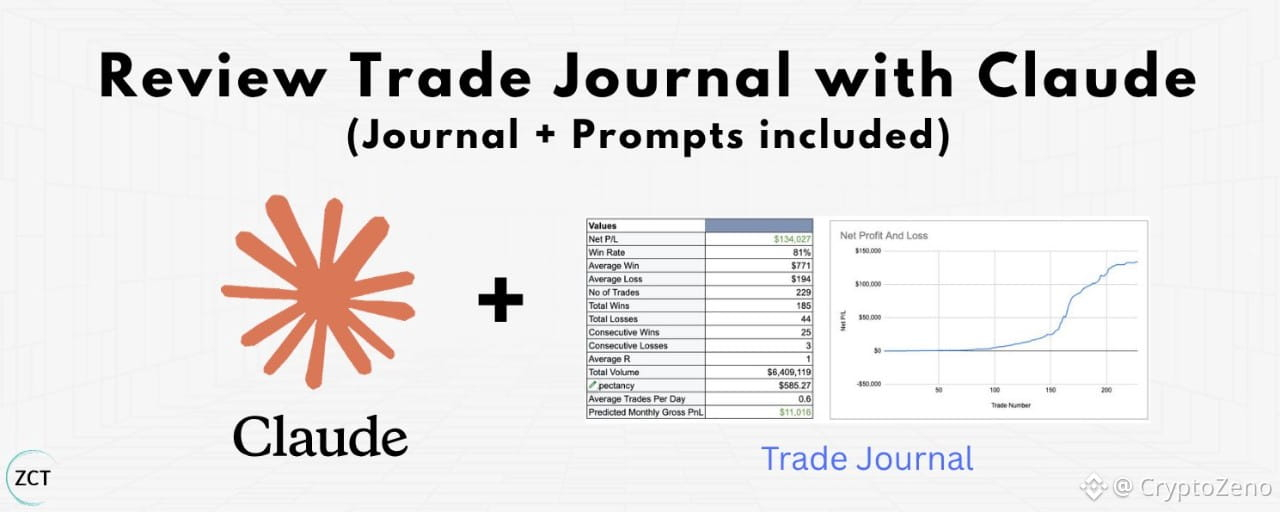
If you’re a trader, you can’t afford to miss this.
I will show you how to use Claude to review your Trade Journal (journal + prompts included).
What you'll have when you're done:
A repeatable monthly review process that turns raw trade data into rules you can actually trade
A clear path from observation → hypothesis → tested rule
Optional: Claude reading your trading journal directly off your laptop to speed up the analysis (no context limit failures, no matter how big the journal gets)
Difficulty: Beginner. No coding required. You'll be writing prompts in plain English.
Let's begin.
Why journal insights even matter
You’re right to ask this question.
Time is valuable. So why should you, as an aspiring trader, spend it reviewing your journal for insights?
Why not, for example, spend it taking more trades?
The reason is that a good journal review process starts an improvement chain:
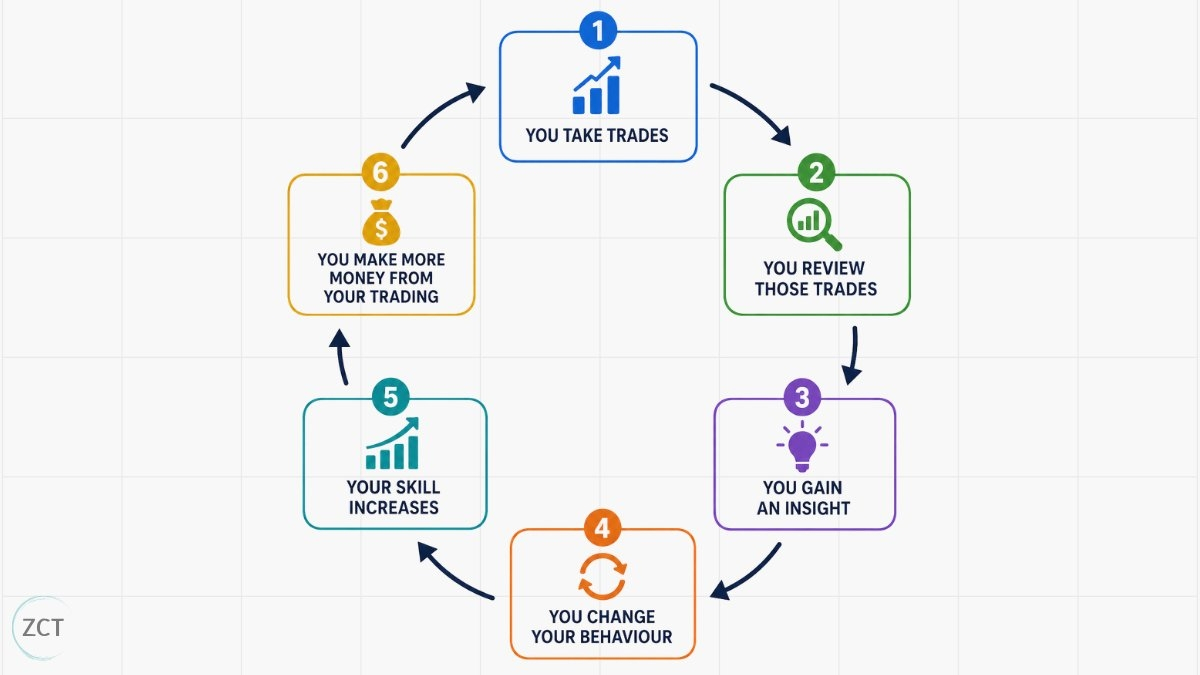
A good journal review process starts an improvement chain
You can also understand the importance of journal reviews through an inversion exercise. I got this idea from Charlie Munger.
So far, I've discussed why you should be reviewing your journal. Now, let's take a different approach:
How would I guarantee I fail for as long as possible as a trader?
To guarantee failure as a trader, I would:
Never keep a trade journal
Blame losses on luck
Attribute wins to skill
Never change my strategy based on data
If our goal is to avoid guaranteed failure, then we should do the opposite of the above.
Now you understand the why, let’s move on to the how.
Part 1: Get your free journal, 1:1 review session and custom Claude assistant
I’ve put together a few things to help you.
My 2026 free trading journal. You need a journal to complete a journal review. I’ve built one you can use with all the necessary features.
A free 1:1 journal review session with my team. Yes, a real call with a real human. In case you’d like some 1 on 1 help with your journal review.
A custom Claude assistant to edit your journal. Go beyond the default view access. Claude will be able to edit your journal and write formulas for you.
(If you have your own journal you want to use, that’s fine. Just make sure it covers the key inputs in Part 3)
Part 2: Connect Claude (Optional)
You can run this entire process manually if you want. The goal of using Claude is to speed up your review and go deeper into pattern recognition.
If you want to use it, here's the setup (5 minutes):
Step 1: Open Claude Chat
Step 2: Download your journal as an excel file (File → Download → Microsoft Excel) and save it into the folder.
Step 3: Paste your file into a chat
That’s it for now.
Part 3: Key inputs
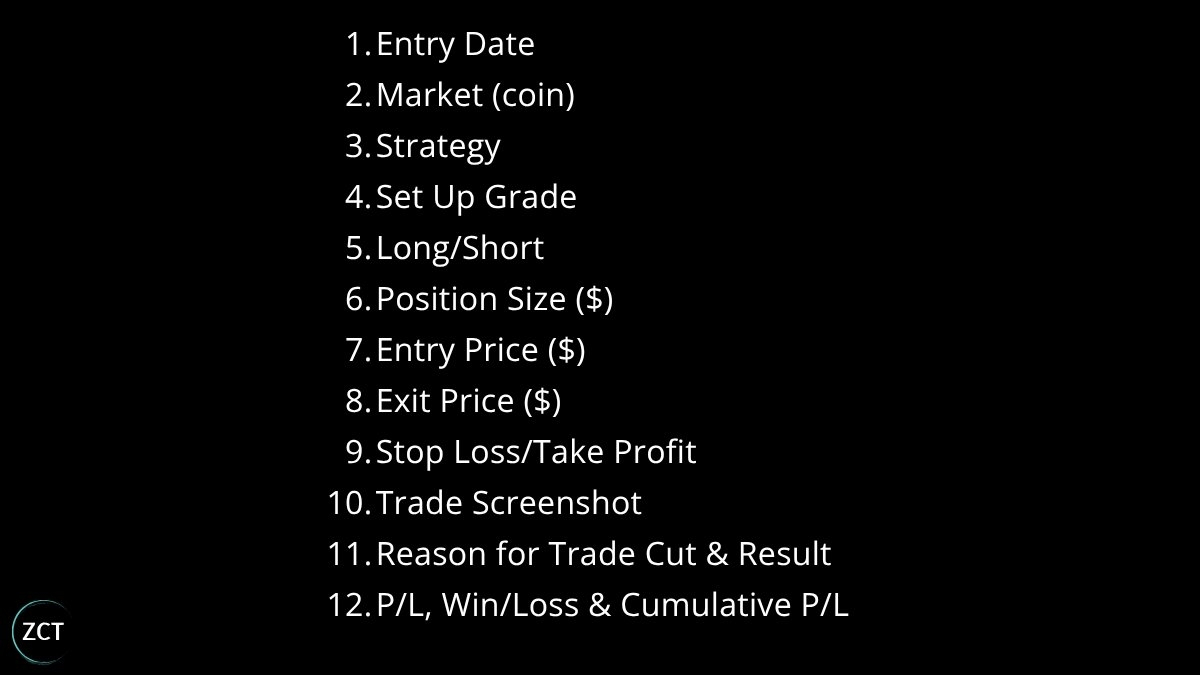
These are the key pieces of data we need to track for a good journal review:
The key pieces of data we need to track for a good journal review
I'll break down how you can use these to build profitable strategies in step 2.
Part 4: The monthly review
You should do a big research review once a month. This is different to your lighter, maintenance style weekly review.
Maintenance review = Weekly review. Easy quick review: opening screenshots, seeing what's working and what's not in the current week/market condition.
Research review = Monthly review that is more in-depth, diving into data, finding ways to improve your strategy, rules, and framework.
30 is the golden number of trades for a review.
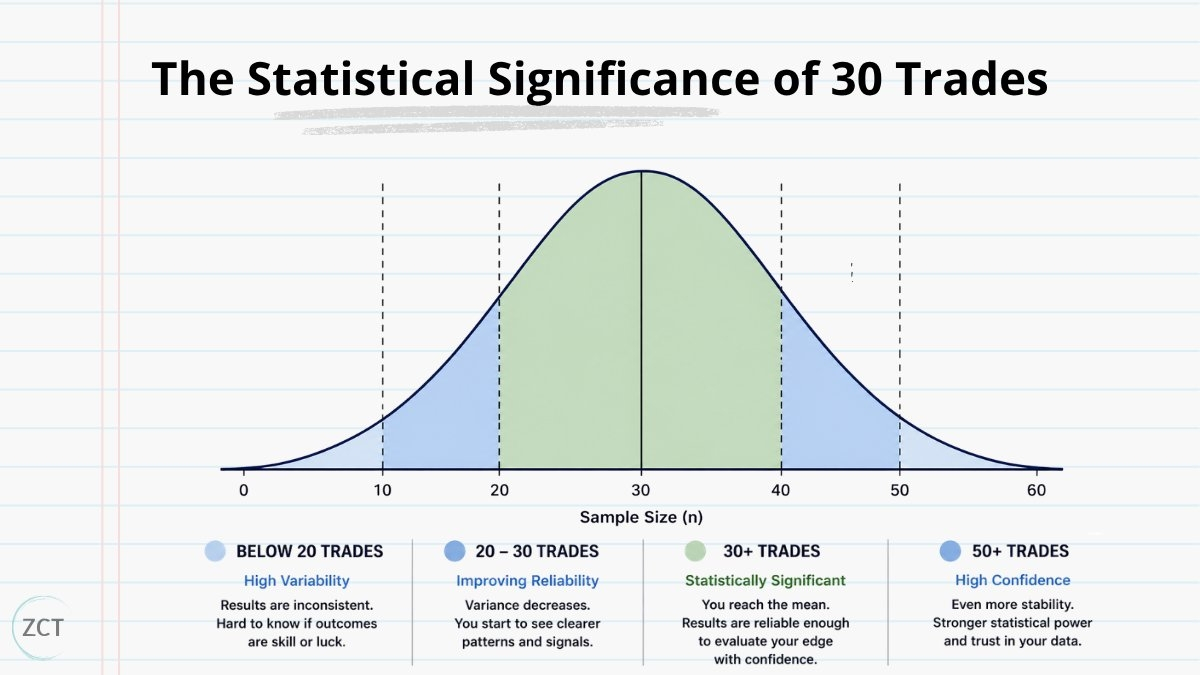
30 is the golden number of trades for a review.
This gives you enough data for patterns to emerge without waiting so long that you've accumulated months of unexamined mistakes.
(For the maths nerds: 30 is the minimum threshold for statistical significance.)
If you have fewer than 30, you can still do your review, but know that your data is less reliable.
Step 1: Begin with the most important statistics
Before you dive into specific patterns or individual trades, you need to answer a fundamental question: is your system making money, losing money, or breaking even?
If you’re on my free journal, head over to the analytics tab and use the ‘Last Month’ feature.
The most important statistics here are:
Expected Value or Expectancy: This tells you if your strategy is profitable.
Trade Frequency: This tells you if your strategy gives you enough opportunities.
The most important statistics are: Expectancy and Trade Frequency
Your expectancy is built from two things:
Win rate: What percentage of your trades are winners?
Risk-reward ratio (R:R): When you win, how much do you win relative to what you lose?
Once you've calculated your expectancy, you can identify whether your problem is:
Win rate too low: You're taking too many losing trades. The fix lives in trade selection and asset selection.
Average loss too large: Your losers are bigger than they should be. The fix lives in trade management.
Average win too small: You're cutting winners short or your targets are too tight. The fix lives in trade management and target optimisation.
To improve trade frequency, you can do:
Horizontal expansion: Test and iterate your same strategy in different markets. Trade new assets and markets.
Vertical expansion: Build new strategies to trade the same assets.
With Claude (helpful if your journal does not have an analytics tab similar to mine, or you want to sense check which of your statistics is currently dragging down your profitability)
Paste to chat:
Read my trading journal in this folder. Look at the last 30 trades.
Calculate:
1. Expected value per trade
2. Win rate
3. Average win, average loss, and risk-reward ratio
4. Trade frequency (trades per week)
Show me the numbers, then tell me in one paragraph: is my main
problem win rate, average loss, or average win?
Example:
Step 2: Filter by strategy and market
Your overall expectancy might look mediocre. But that single number hides critical information.
It's possible that one strategy is highly profitable while another is bleeding you.
Or that you're profitable in certain markets but consistently losing in others.
Market (Coin).
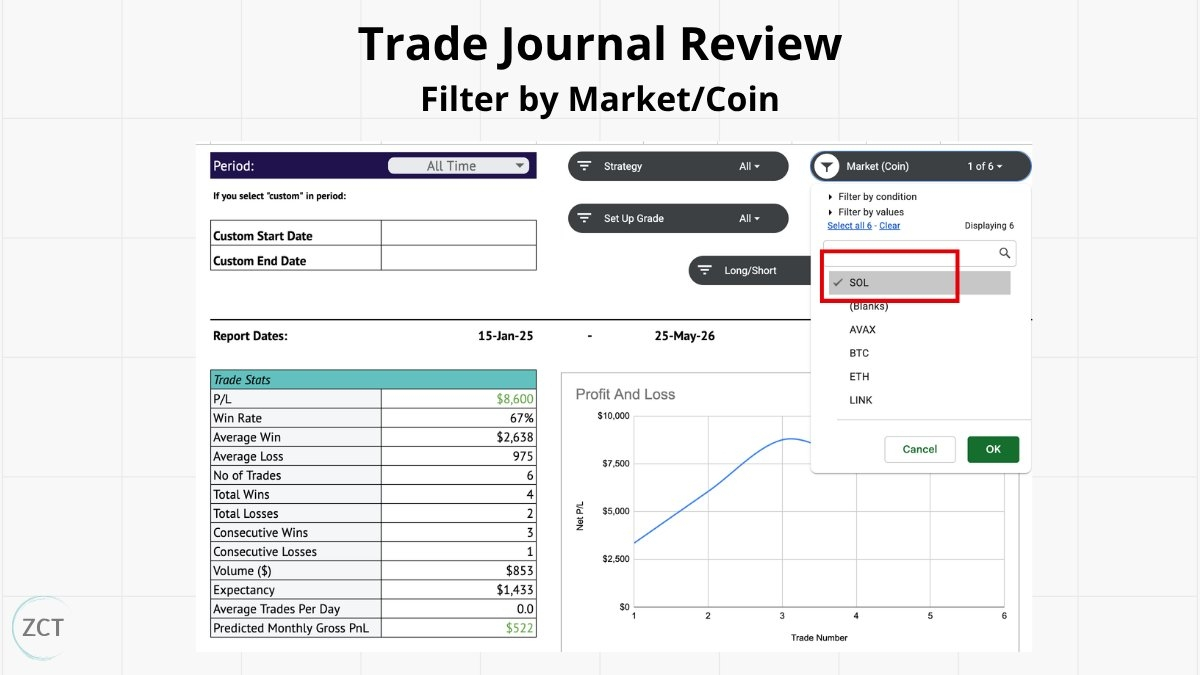
You will often find a select few assets responsible for most of your gains or losses.
Trade those more.
You will often find a select few assets responsible for most of your gains or losses.
Strategy.
Focus on the ONE strategy that makes you the most money and ignore everything else until you have mastered that.
Without a journal, you’ll never know what that one strategy is.
Focus on the ONE strategy that makes you the most money
With Claude (this is helpful if you don’t want to be tabbing between the filters to grab each metric and just want one clear snapshot. It’s also useful to grab the specific 30 number rather than a time duration view):
Paste to chat:
From the last 30 trades in my journal, pull only the rows where
Win/Loss is W or L. Show me trade count, win rate, and net P/L
broken down by:
1. Strategy
2. Market
3. Long/Short
4. Setup Grade
5. Strategy × Direction
6. Strategy × Market
Flag any group where N ≥ 5 and win rate is above 55% or below 40%.
For each flag, give me a one-line hypothesis for why that might
be happening.
The flag list at the bottom is the important part. Those are the cuts worth investigating in Step 4.
Example:
Step 3: Trade Management
Position Size and Emotional Journal.
Pay close attention to these two; they’re often correlated. If you're risking a consistent percentage on every trade, your results reflect your strategy's true performance.
But if your position sizes vary based on how you're feeling, your equity curve becomes unreliable.
Daily Report Card.
Find and eliminate your weak points. Look for repeat patterns and behaviours.
E.g. When I lose 3 trades in a row my execution goes down the drain, new trading rule: I stop trade after 3 losses
Find and eliminate your weak points. Look for repeat patterns and behaviours.
R:R.
I’ve actually seen a wide range of performance here.
Some traders kill it on 1:1 risk to reward ratios. Don’t think you need high ratios to win.
Reason for Cutting The Trade & Cut Result
Find ways to cut your losers quicker and keep them smaller than your winners. Track why you exited and whether it was the right call (over time, the patterns become obvious)
Trade Duration.
Every trade you take has a duration: the time between entry and exit. How long is your average winner? How long is your average loser?
Turn this info into alpha.
With Claude (This is Claude’s superpower. Reading through written insights, spotting correlations and patterns. If you tried this manually, it would take you all day, and you wouldn’t be able to retain the patterns at scale. I’ve written you example commands, but my goal is that after running this, you know how to write whatever commands you like. Whatever pattern you want to spot, you can run a similar analysis):
Patterns in language are exactly what Claude is good at finding. Paste to chat:
From the full journal history (not just the last 30 trades), look
at the Position Size and Daily Report Card / Emotional Journal
columns.
1. Surface any recurring language around emotional state — words
like "revenge," "hesitated," "overconfident," "FOMO," "tired,"
"rushed." For each pattern, give me the dates it appeared and
whether trades on those days were net winners or losers.
2. Check if position size correlates with emotional state.
3. Look at trade duration — what's the average duration of my
winners versus losers?
4. From the "Reason for Cutting" column, surface the most common
exit reasons and whether they led to good or bad outcomes.
5. Analyze my daily trade count to understand performance by trades of the day.
6. Analyze average daily performance of winning/losing days to introduce more optimal risk management guidelines.
Example:
I'm using the full history here, not just the last 30 trades. So you need to give Claude some time to cook.
Behavioural patterns need more data to surface, they cluster around specific events like losing streaks and big wins that might only appear a few times across a longer window.
If a word keeps showing up on losing days, that's your trigger. Once you can name it, you can build a rule around it, which is exactly where Step 4 starts.
Step 4: The insight formalisation process
Every insight follows the same path from observation to implemented rule:
Observation → Hypothesis → Specific Rule → Tracking Mechanism → Evaluation
Here's how each step works:
Observation: "I noticed my momentum trades seem to lose more often when price spikes into the level."
Hypothesis: "Momentum trades perform better when price grinds into the level versus when it spikes."
Specific Rule: "Do not take momentum trades when price approaches the level via a fast vertical spike (defined as: a single candle moving 2%+ into the level within 1-2 candles)."
Tracking Mechanism: Add a column to your journal that records whether each trade met or violated this rule. Track the outcome.
Evaluation: After 30 trades, compare the win rate of trades that followed the rule versus trades that would have been filtered out by it.
Notice how the rule is specific enough to be testable. "Don't trade spikes" is vague. "Don't take momentum trades when a single candle moves 2%+ into the level" is precise. You can look at any trade and definitively say whether it met the criteria or not.
With Claude (here you are using Claude as a second brain. This targets the trading psychology aspect. Sometimes we want to force patterns and rules. Or we are more inclined to find reasons why they work rather than to invalidate them. Claude keeps you in check).
Use Claude as a pressure-tester. Paste:
I have a fuzzy observation from my journal review:
"[your observation, e.g. Mean Reversion shorts seem to be my best setup]."
Walk it through this framework:
1. Pressure-test it. Is it likely real or sample noise? Is the
variable I think is driving it actually doing the work, or is
there a confound?
2. Translate it into a falsifiable rule. Every clause must answer:
what counts, what doesn't.
3. Suggest journal columns I should add to track it.
4. Propose a sample size and pass/fail thresholds.
5. Define what action I should pre-commit to if it passes, and
what I'll change if it fails.
Push back on any of my clauses if they're vague. Don't let me get
away with words like "often" or "usually."
One last thing: when Claude proposes the rule, ask it the question most traders never ask themselves: