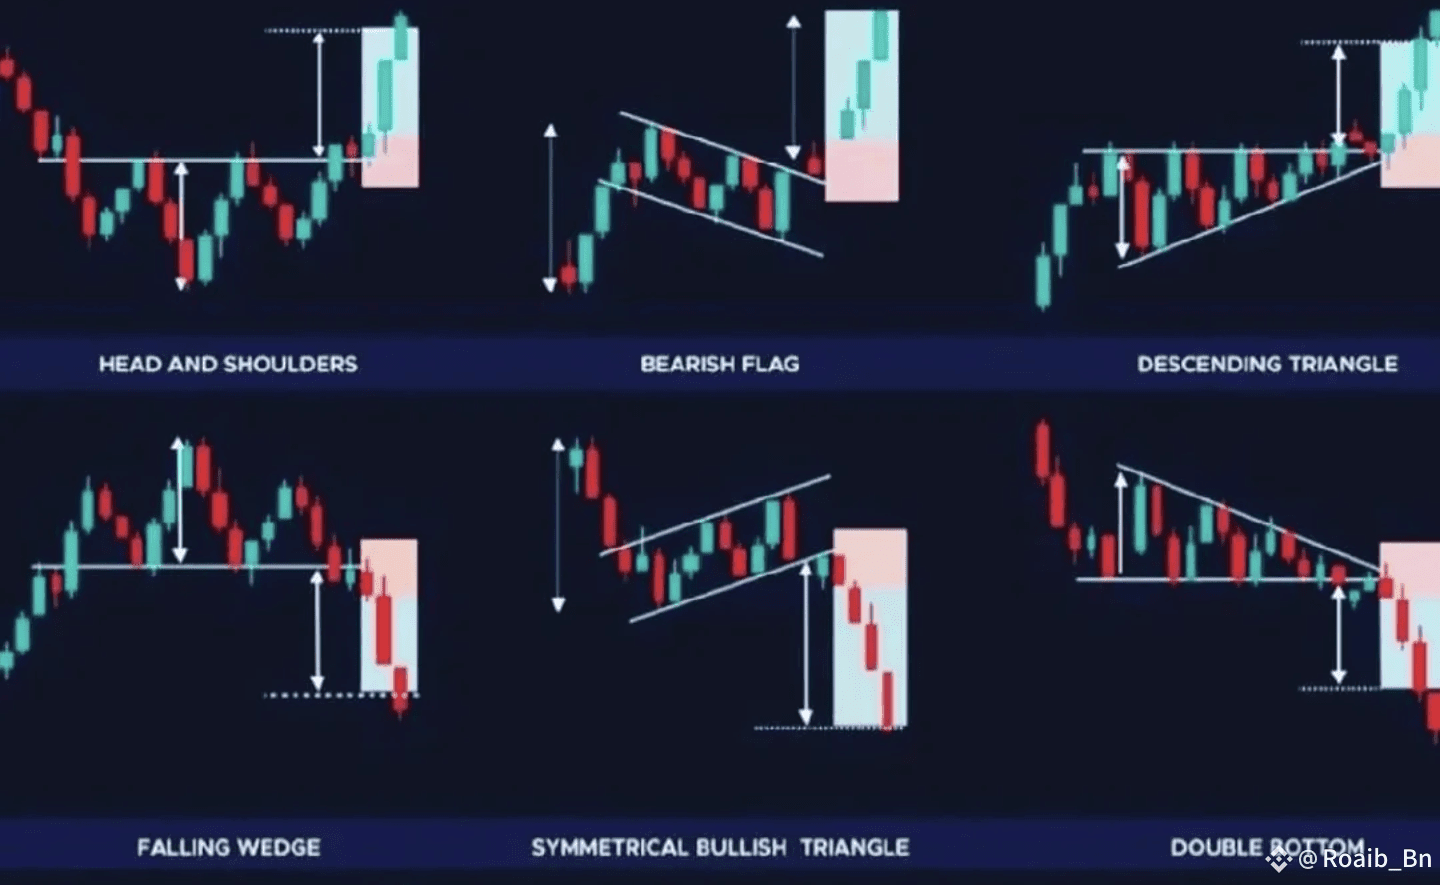
🔹 Head and Shoulders
🧠📉 A reversal signal — when the market forms a peak, higher peak, then a lower peak. Expect a drop after the neckline breaks.
🔹 Bearish Flag
🚩🔻 A strong downtrend, slight pullback in a channel, then continuation downward. Classic bearish continuation. ⚠️
🔹 Descending Triangle
🔽📉 Flat bottom with lower highs. Breakdown = bearish move likely! 🟥
🔹 Falling Wedge (Bullish)
🔻📈 Looks bearish but surprise! Often breaks upward with momentum 🚀
🔹 Symmetrical Triangle (Bearish)
🔺🔻 Price tightens... boom! Watch the breakout — usually in the direction of the trend. In this case: down! ⚠️
🔹 Double Bottom (Bearish Setup)
📉⛔️📉 Not always bullish! If support fails after the second bottom, a fake-out can trap bulls and lead to downside. 🚨
Here is the candles image 👇
💡 Pro Tip: Always combine pattern recognition with volume & confirmation candles 📊✅
Risk management is your best trading tool! 🛡️
👇 Screenshot this & stay prepared during your next crypto move!
If you liked this post, follow ❤️, like 👍, and comment your favorite pattern!
#ProjectCrypto #TrumpTariffs #MarketPullback #WhiteHouseDigitalAssetReport #FOMCMeeting
