

Bitcoin hovered near $113,000 on Tuesday as traders awaited the outcome of the Federal Open Market Committee (FOMC) meeting. The U.S. Federal Reserve’s rate decision will be followed by a press conference from Chair Jerome Powell at 2:30 p.m. ET.
According to analysts, the recent volatility looks like a normal correction within a bullish trend, not a sign of reversal. Key price levels remain concentrated between $111,000 and $120,000.
Analysts: A Break Above $120K Could Open the Door to $143K
Crypto analyst Ali Martinez believes Bitcoin must close decisively above $120,000 to unlock the next leg higher toward $143,000.
“Once Bitcoin reclaims $120,000, historical resistance levels thin out considerably. The chart shows open space all the way to $143,000,” Martinez explained.
His outlook is based on long-term price bands — smooth, on-chain averages that act as zones of support and resistance. At present, $120,000 forms a key ceiling, while $143,000 represents the next potential profit-taking region.
Van de Poppe: The Dip Looks Routine, Not a Trend Break
Popular trader Michaël van de Poppe described the recent pullback as a “healthy floor test” rather than the start of a downtrend.
He expects Bitcoin to hold above $112,000 before resuming its climb toward $116,000 and eventually $120,000.
“This isn’t panic — it’s just a normal cooldown before the next move,” van de Poppe wrote on X.
His medium-term chart outlines support near $112,000 and resistance between $115,600 and $116,200. As long as the lower boundary holds, he sees a strong chance for a rebound to higher levels.
Glassnode: Buyers at $111K, Sellers Near $117K
On-chain data from Glassnode show most recent buyers clustering around $111,000, while selling pressure builds near $117,000.
This tug-of-war defines the current range.
In simpler terms: $111,000 is where bargain hunters step in, while $117,000 is where profit-taking typically begins.
A decisive move beyond either level could set the next major direction for BTC.
Technical Highlights from CoinDesk Research
According to CoinDesk Research, October 28 saw a sharp spike in activity:
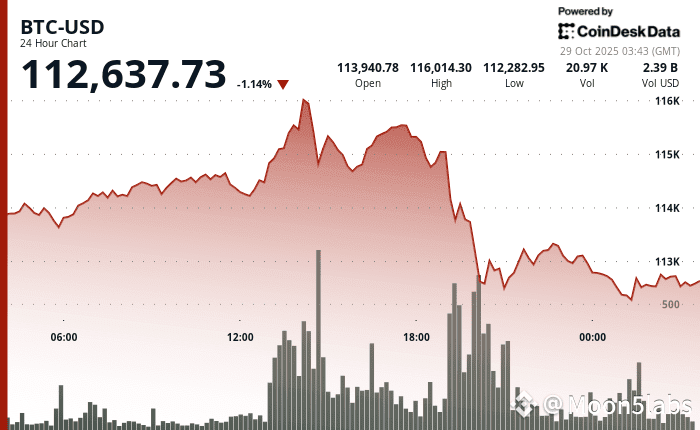
14:00 UTC: Trading volumes surged to 22,844 BTC — 174% above the 24-hour average (8,268 BTC) — pushing prices to a daily high of $116,094.
20:00 UTC: A second wave of selling drove BTC down to $112,500, where buying support kicked in.
Oct 29, 02:00 UTC: Bitcoin slipped 1.2% to $112,568, marking roughly a $3,930 intraday swing.
03:45 UTC: BTC traded near $112,637, with smaller candles indicating a pause in volatility.
Key Levels:
Support: $112,500 and $111,000
Resistance: $115,600–$116,200
Break above $116,000 could open $119,000–$120,000
Break below $112,500 would retest $111,000
Summary: Bitcoin Waits for Fed’s Next Move
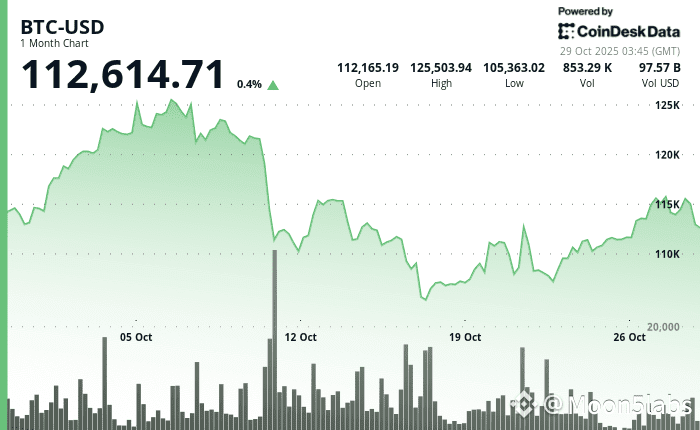
Both daily and monthly charts show Bitcoin consolidating between $111,000 and $117,000.
A clear breakout above $120,000 would signal a shift back to bullish momentum, potentially paving the way toward $143,000.
Until then, the market remains calm — waiting for Jerome Powell’s remarks and the Fed’s tone for the months ahead.
#BTC , #bitcoin , #CryptoNews , #FOMC , #CryptoAnalysis
Stay one step ahead – follow our profile and stay informed about everything important in the world of cryptocurrencies!
Notice:
,,The information and views presented in this article are intended solely for educational purposes and should not be taken as investment advice in any situation. The content of these pages should not be regarded as financial, investment, or any other form of advice. We caution that investing in cryptocurrencies can be risky and may lead to financial losses.“
