Bitcoin is finally showing signs of life! After days of heavy red candles and continuous lower highs, the market has printed a strong bounce from the $80,600 local bottom, signalling the first real attempt to break out of the downtrend.
📉 Recently, BTC touched $80,600 — the lowest level in weeks
📈 Today, Bitcoin is trading around $88,800, up +1.36% in the last 24 hours.
---
✅ What This Chart Is Telling Us
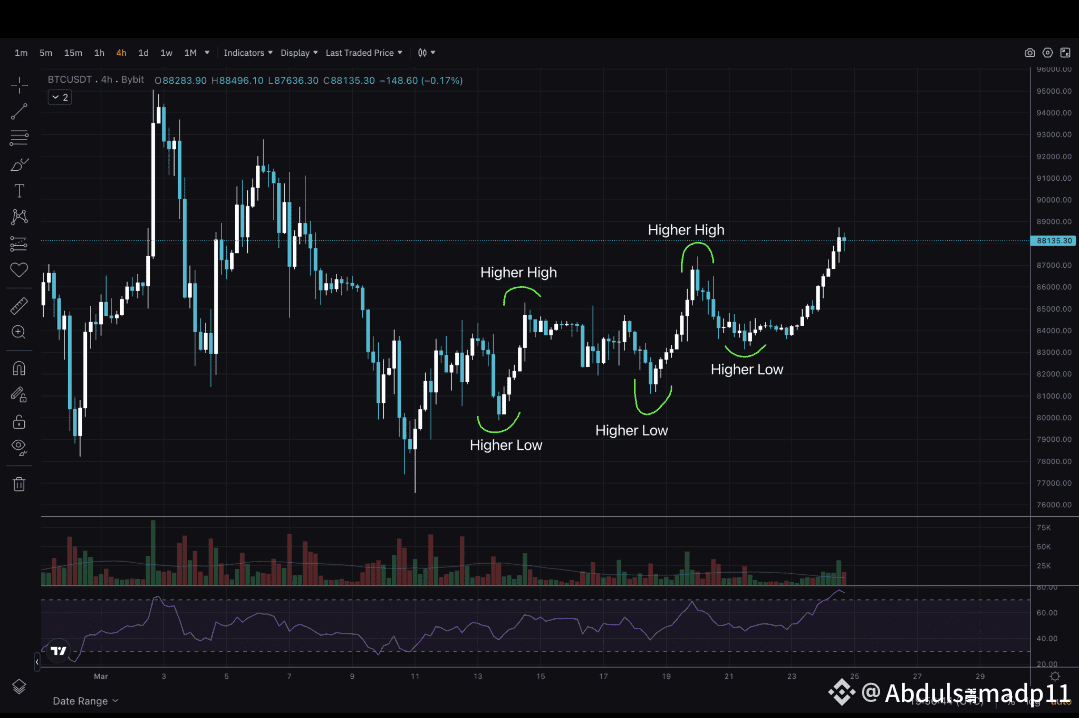
1. Downtrend Still Dominant
The chart clearly shows a series of lower highs and lower lows. This confirms that Bitcoin has been in a clean downtrend for more than 30 days.
2. Strong Support Hit at $80,600
BTC bounced perfectly from the $80.6K support zone, showing buyer strength for the first time after a long sell-off.
3. Today’s Candle Signals Buyer Interest
A green candle forming after such a deep drop suggests:
Short covering
Fresh accumulation
Potential short-term reversal
4. Order Book Still Bearish
Order book shows:
28% buyers
72% sellers
This means the majority still expect lower prices — but early accumulation has begun.
---
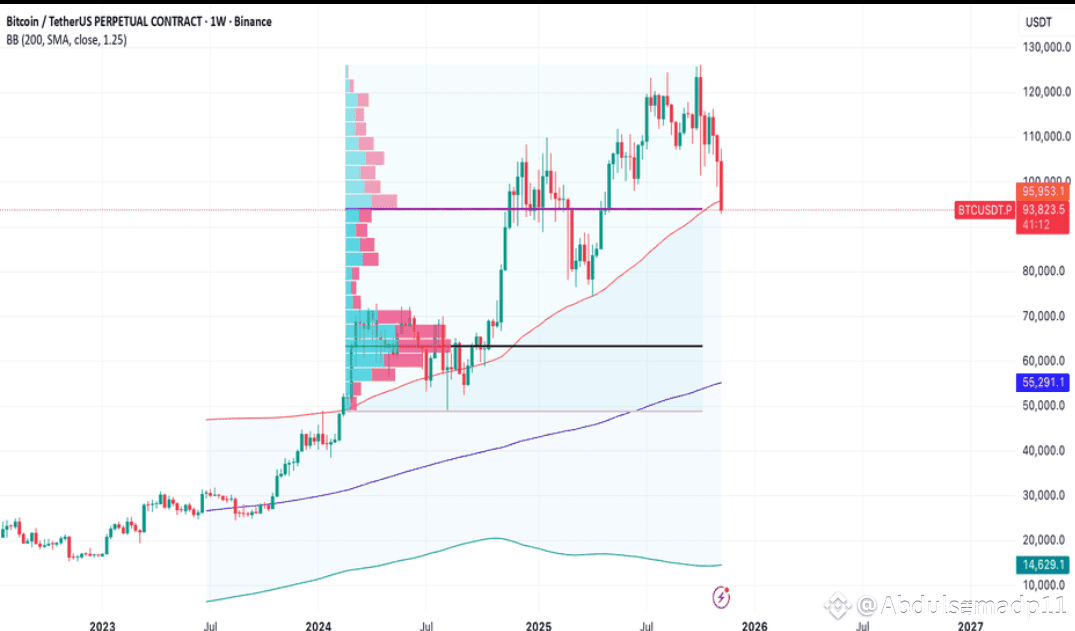
🔥 Is the Bottom In?
Too early to call a bottom — but this bounce is the strongest recovery candle we’ve seen since the downtrend started.
To confirm a reversal:
BTC must break above $96,900
Then flip $106,000 into support
Until then → short-term bounce, long-term caution.
---
📊 Today’s Market Sentiment
24h High: $88,850
24h Low: $85,226
Volume: Still strong, showing active trading
RSI showing an oversold recovery
---
🟢 Bullish Short-Term Outlook
If BTC stays above $88,000, next targets are:
$92,000
$96,900 (major resistance)
🔴 Bearish Breakdown Level
If BTC drops below $80,600, we may revisit:
$78,500
$75,000
---
🚀 Conclusion
Bitcoin is finally showing strength after touching a major support zone.
This bounce could be the start of a short-term recovery, but we still need strong confirmation before declaring the true bottom.
Stay sharp. The next few candles will decide the trend.
