$BTC continues to show resilience despite recent volatility, currently trading around $115,630 in Crypto Market. After a brief correction phase, the chart reveals a strikingly similar technical setup to early 2025, where a falling wedge pattern triggered a powerful breakout and an extended bullish rally.
This time, the structure hints at another potential trend reversal, suggesting Bitcoin could be gearing up for a sharp move higher into year-end 2025 and beyond.
🚨Technical Analysis
Pattern Type: Falling Wedge (Bullish Reversal)
Confirmation: Breakout above descending trendline resistance around $114,800–$115,200
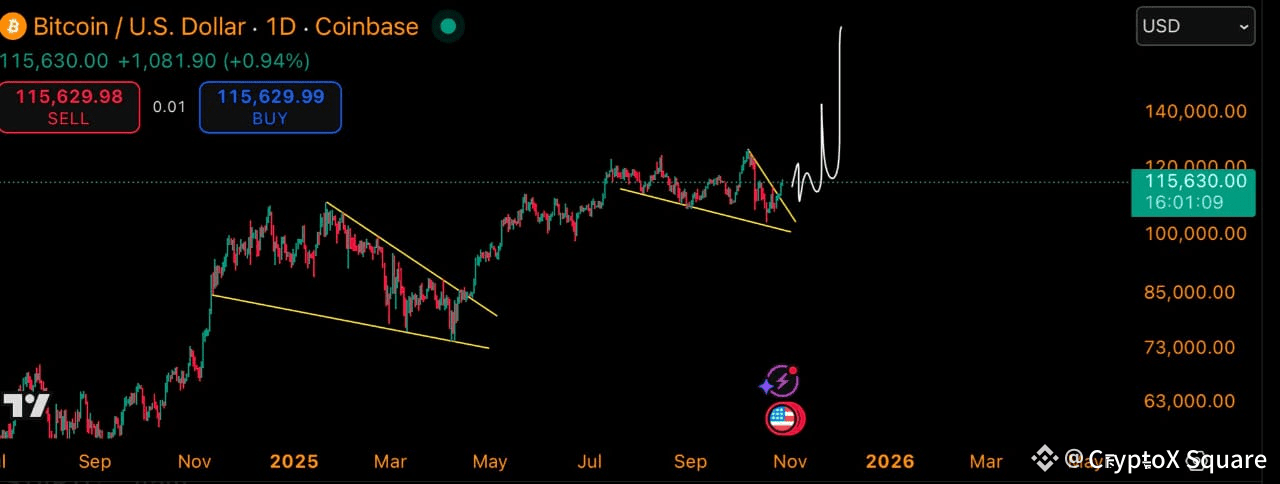
Market Structure: Higher lows remain intact, confirming continued demand at lower levels.
This pattern historically precedes strong upside momentum, as seen during Bitcoin’s February–April 2025 breakout that pushed prices above $100,000 within weeks.
🚨Entry, Targets & Stop-Loss
Pair:- $BTC / USDT
💎Position :- LONG (Spot or Leverage 3–5x) $114,500 – $116,000
💎Take Profit:- TP1🎯: $120,000
TP2🎯: $128,000
TP3🎯: $135,000 – $140,000
Stop Loss 🛑: $111,800
A confirmed daily close above $116,000 could validate the bullish breakout, potentially setting the stage for an accelerated run toward $140,000 by early 2026.
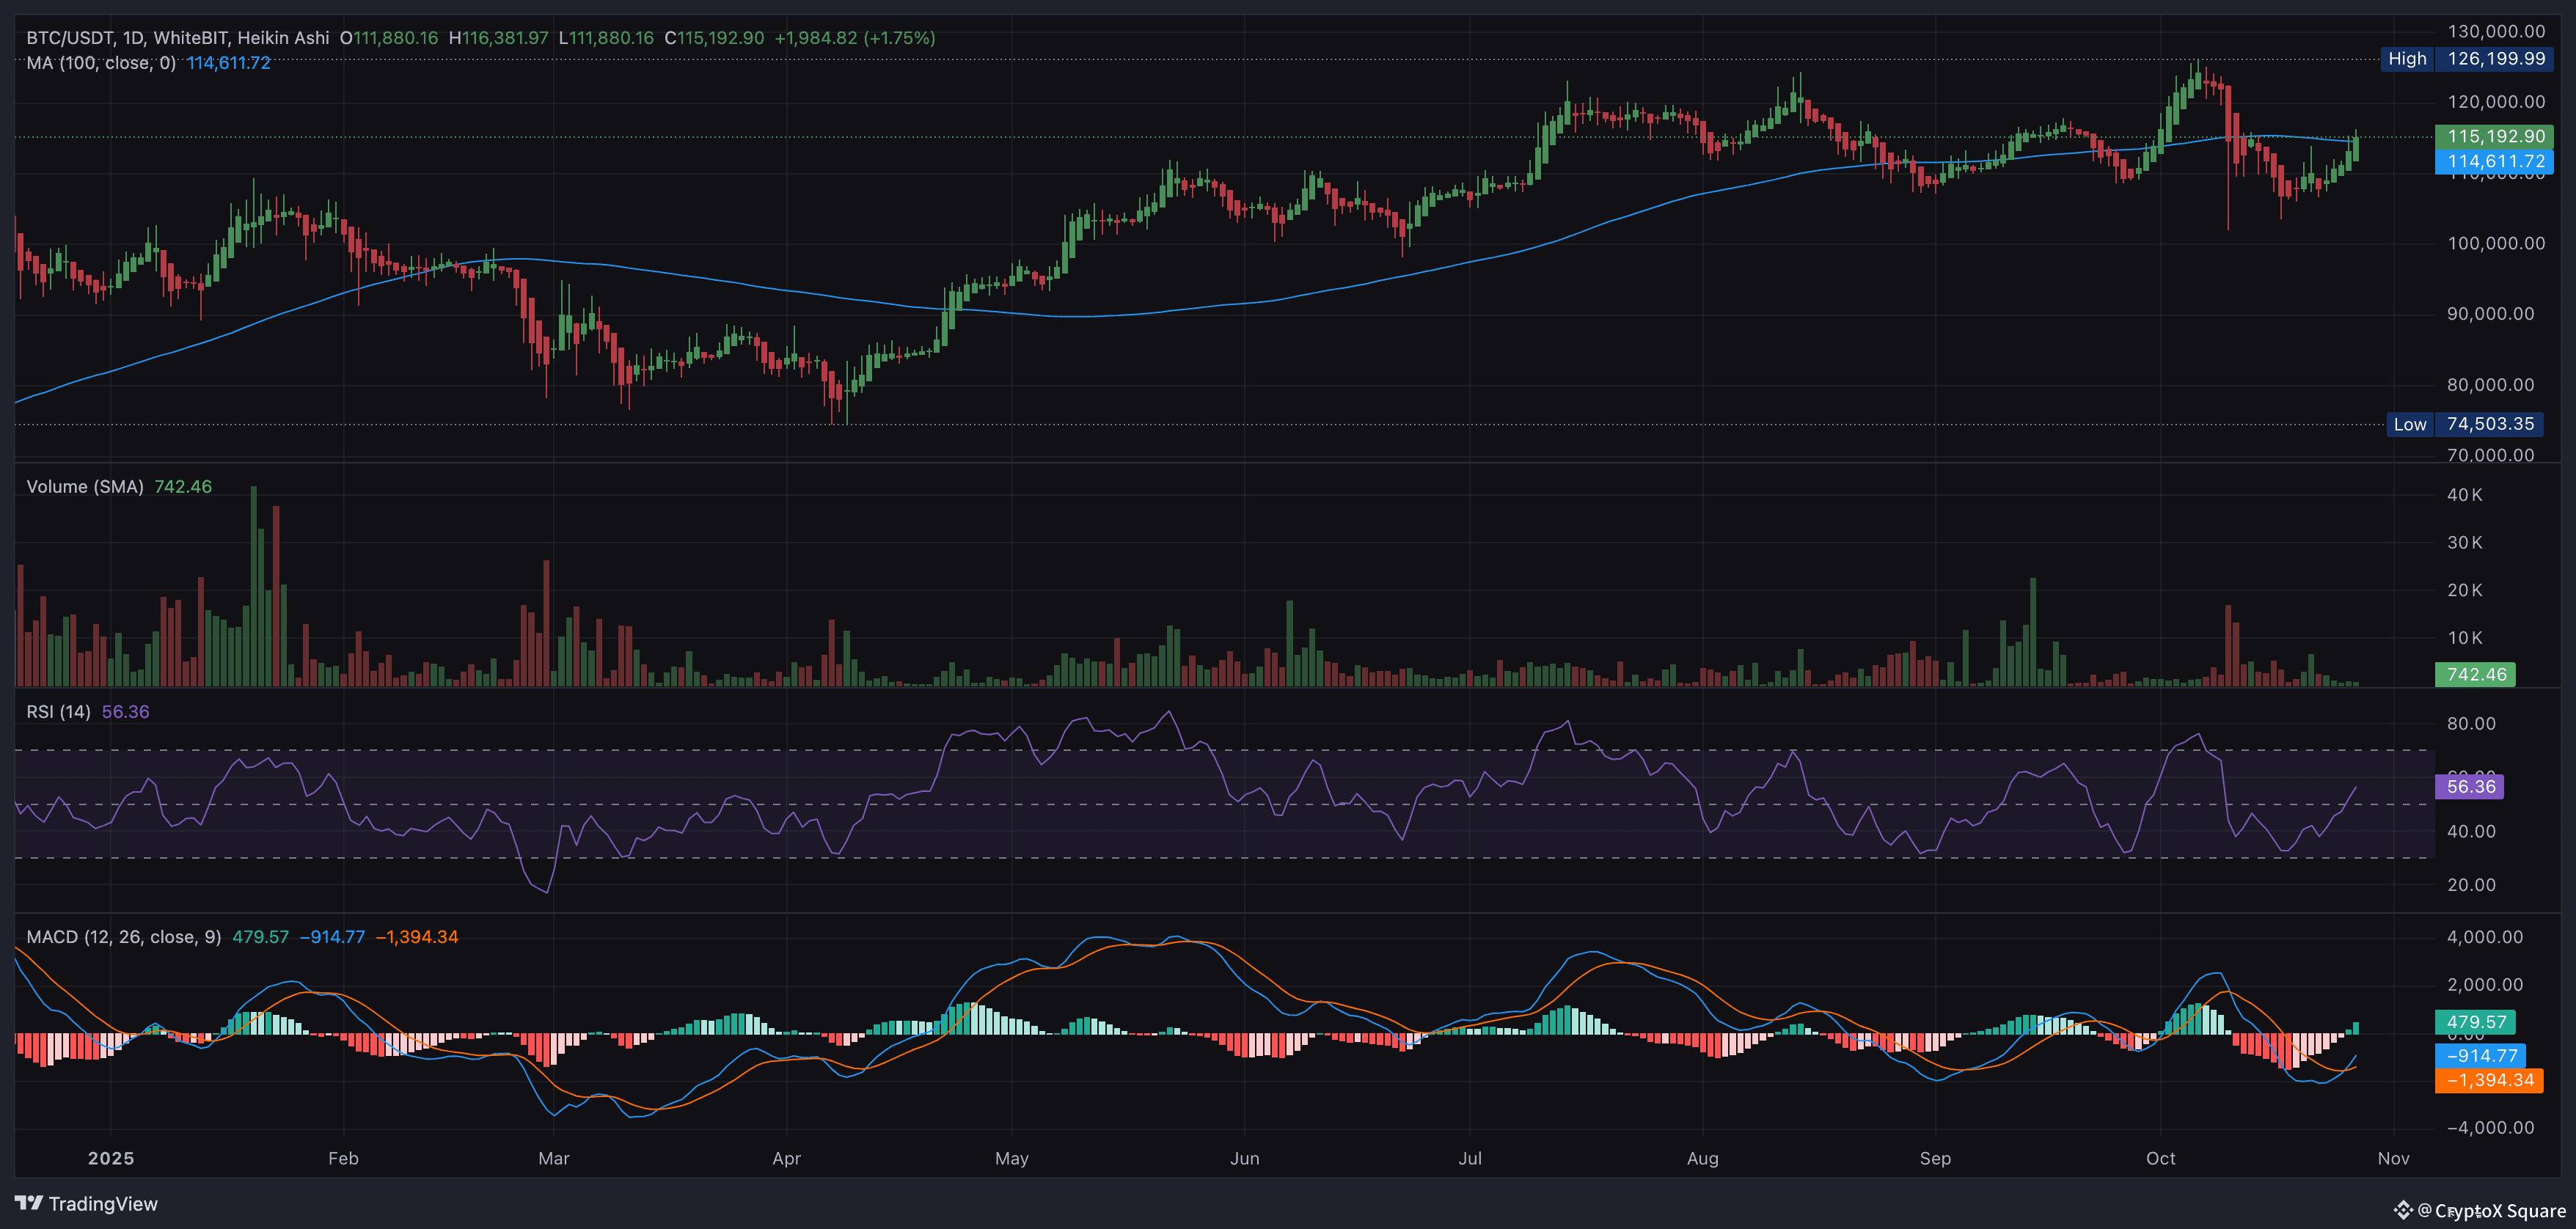
Momentum Indicators
RSI: Rebounding from neutral zone (~52), showing early signs of strength.
MACD: Bullish crossover imminent — momentum shift toward buyers.
Volume: Gradual uptick, suggesting accumulation rather than distribution.
These indicators reinforce the bullish narrative, indicating a market recovery phase rather than a continuation of the correction.

🚨Outlook: A Strong Year-End Recovery Ahead
With the broader market regaining confidence and institutional activity increasing, Bitcoin appears poised for a year-end surge. If the wedge breakout confirms, it could mark the start of another parabolic leg, echoing the early 2025 structure.
Analyst View:
“$BTC current consolidation looks like the calm before another major breakout. As long as $111K support holds, the next move could target new all-time highs near $140K,” notes one market strategist.
Summary
✅ Pattern: Falling Wedge (Bullish)
✅ Bias: Strongly Bullish Above $115K
✅ Short-Term Target: $120K – $128K
✅ Medium-Term Target: $135K – $140K
✅ Stop-Loss: Below $111.8K
Conclusion:
Bitcoin’s chart suggests that history may soon repeat itself. The ongoing wedge formation and improving technical momentum could lead to a swift recovery and a powerful Q4 rally. Traders should keep an eye on the $115K breakout zone for confirmation — because once that breaks, the path to $140K opens wide.